Archive for October, 2010
Wednesday, October 13th, 2010
In addition to software narratology we would like to introduce another 2 branches of memoretics (borrowed from “geographical” chorography and chorology), the science of memory snapshots:
Software Chorography
The study and visualization of small memory regions compared to the full memory dumps.
Software Chorology
The spacial equivalent of software narratology where the latter is considered in chronological terms. Studies spatial distribution and causal relations between software behavioral and structural phenomena inside particular memory regions.
To give a perspective where usual software traces and memory dumps reside in terms narrativity and non-narrativity (spatiality) we created this diagram:
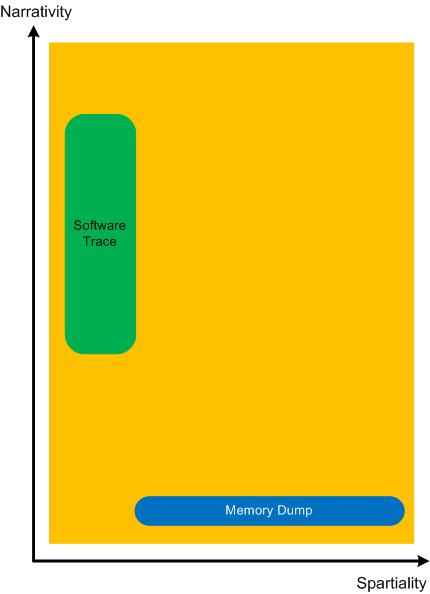
Memory dumps have some extension in the dimension of narrativity because it is possible to get stack traces and other execution residue from them that provide partial fragments of a software narrative.
- Dmitry Vostokov @ DumpAnalysis.org + TraceAnalysis.org -
Posted in Memoretics, Memory Visualization, Software Chorography, Software Chorology, Software Narratology | No Comments »
Wednesday, October 13th, 2010
Another important pattern category is Memory Hierarchy. Typical examples include a complete memory dump with a physical to virtual mapping and paged out memory. Please note that page file is optional and paging can be implemented without a page file. There can be several layers of hierarchy, for example:
- physical memory
- virtualized physical memory
- virtual memory
Another example is from the protected mode x86 architecture:
- physical memory
- linear memory (paging, virtual)
- logical memory (segments)
- Dmitry Vostokov @ DumpAnalysis.org + TraceAnalysis.org -
Posted in Breakfast with Intel, Crash Dump Analysis, Debugging, Memoretics, Structural Memory Patterns | No Comments »
Wednesday, October 13th, 2010
Sometimes, when we find an Anchor Message related to our problem description (for example, a COM port error) we are interested in its evolution throughout a software narrative:
#       PID     TID     Message

[...]

126303  5768    1272    OpenComPort returns Status = 0x0

[...]

231610  3464    1576    OpenComPort returns Status = 0x0

[...]

336535  5768    4292    OpenComPort returns Status = 0×0

[…]

423508  5252    2544    OpenComPort returns Status = 0xc000000f

[…]

531247  5768    5492    OpenComPort returns Status = 0xc000000f

[…]

639039  772     3404    OpenComPort returns Status = 0xc000000f

[…]
Then we can check activity between changes. We call this pattern Message Change.
- Dmitry Vostokov @ DumpAnalysis.org + TraceAnalysis.org -
Posted in CDF Analysis Tips and Tricks, Debugging, Software Trace Analysis, Trace Analysis Patterns | No Comments »
Wednesday, October 13th, 2010
In seeking spiritual faith a software generalist views various religious worldviews as packages providing interfaces (IReligion). The methods of such interface will be discussed in the next part but for now, I show a UML diagram.
Posted in Software and Religion, Uses of UML | No Comments »
Wednesday, October 13th, 2010
I now transition to 8 similar to 7-to-8 transition from user to kernel space (new dialectical quality):
switch(years_at_citrix)

{

  case 5:

  write_blog_post(”I’ve just passed 5 year mark … “);

  wait_for_certificate();

  write_blog_post(”Shortly after celebrating 5 years … “);

  break;

  case 6:

  write_blog_post(”Threads in my process run very fast. Not long ago … “);

  break;

  case 7:

  write_blog_post(”Transition to kernel mode and space … “);

  break;

  case 8:

  // … TBD
}
I also abandoned monthly counting started earlier because in kernel space time is counted in clock cycles per quantum unit where the latter is 1/3 of a clock tick (Windows Internals, 5th edition, pp. 406 - 408) :-)
- Dmitry Vostokov @ DumpAnalysis.org + TraceAnalysis.org -
Posted in Announcements, Citrix, Crash Dump Analysis, Debugging, Escalation Engineering, History, Software Architecture, Software Engineering, Software Technical Support, Software Trace Analysis, Tools | No Comments »
Monday, October 11th, 2010
Tool Objects name was motivated by the title of the book Tool and Object: A History and Philosophy of Category Theory that I’m reading:

I realized that troubleshooting can be represented as a category of memory states (or collections of proximate states) as objects and troubleshooting tools as arrows.
We can also consider tools as categories with arrows as troubleshooting actions. In the latter case we can model a collection of tools and transformations (morphisms) between them as a functor.
- Dmitry Vostokov @ DumpAnalysis.org + TraceAnalysis.org -
Posted in Books, Categorical Debugging, History, Mathematics of Debugging, Tool Objects, Tools | No Comments »
Monday, October 11th, 2010
It’s time to update my old Resume and CV: As a Book that was on sale for almost 2 years to reflect exponential changes in objectives, skills, achievements and deliverables since summer, 2003. Actually the number of pages has doubled. The 2nd edition is planned to be 111th book scheduled for publication in December:
- Title: Resume and CV: As a Book (2nd Edition)
- Author: Dmitry Vostokov
- Paperback: 32 pages
- Publisher: OpenTask (01 Dec 2010)
- ISBN-13: 978-1-908043-00-9
The front cover color follows the proverbs about “green fields” (I also fixed a bug that was on the first edition front cover) 

- Dmitry Vostokov @ DumpAnalysis.org + TraceAnalysis.org -
Posted in Announcements, Books, History, Publishing, Resume and CV | No Comments »
Friday, October 8th, 2010
The previously published script to dump raw stack of all threads dumps only 64-bit raw stack from 64-bit WOW64 process memory dumps (a 32-bit process saved in a 64-bit dump). In order to dump WOW64 32-bit raw stack from such 64-bit dumps we need another script. After I found a location of 32-bit TEB pointers (WOW64 TEB32) inside a 64-bit TEB structure I was able to create such a script:
0:000> .load wow64exts
0:000> !teb

Wow64 TEB32 at 000000007efdd000
Wow64 TEB at 000000007efdb000

    ExceptionList:        000000007efdd000

    StackBase:            000000000008fd20

    StackLimit:           0000000000082000

    SubSystemTib:         0000000000000000

    FiberData:            0000000000001e00

    ArbitraryUserPointer: 0000000000000000

    Self:                 000000007efdb000

    EnvironmentPointer:   0000000000000000

    ClientId:             0000000000000f34 . 0000000000000290

    RpcHandle:            0000000000000000

    Tls Storage:          0000000000000000

    PEB Address:          000000007efdf000

    LastErrorValue:       0

    LastStatusValue:      0

    Count Owned Locks:    0

    HardErrorMode:        0
0:000:x86> !wow64exts.info
PEB32: 0x7efde000

PEB64: 0x7efdf000
Wow64 information for current thread:
TEB32: 0x7efdd000

TEB64: 0x7efdb000
32 bit, StackBase   : 0×1a0000

        StackLimit  : 0×190000

        Deallocation: 0xa0000
64 bit, StackBase   : 0x8fd20

        StackLimit  : 0x82000

        Deallocation: 0x50000
[...]
0:000:x86> dd 000000007efdd000 L4

7efdd000  0019fa84 001a0000 00190000 00000000
So the script obviously should be this:
~*e r? $t1 = ((ntdll!_NT_TIB *)@$teb)->ExceptionList; !wow64exts.info; dds poi(@$t1+8) poi(@$t1+4)
Before running it against a freshly opened user dump we need to execute the following commands first after setting symbols right:
.load wow64exts;

.effmach x86
I’ve also created a page to put all such scripts together:
Raw Stack Analysis Scripts
- Dmitry Vostokov @ DumpAnalysis.org + TraceAnalysis.org -
Posted in Crash Dump Analysis, Debugging, WinDbg Scripts, WinDbg Tips and Tricks, x64 Windows | No Comments »
Friday, October 8th, 2010
I aim to release a beta version of that unified troubleshooting system together with EasyDbg (as WinDbg add-on) in a few months after finishing porting it to x64 platform. The system is very customizable and similar buttons can be created to launch troubleshooting tools and execute troubleshooting units of work for any client and server applications. It will also be covered in the forthcoming Software Troubleshooting and Debugging Tools presentation.
- Dmitry Vostokov @ DumpAnalysis.org + TraceAnalysis.org -
Posted in Announcements, Debugging, Debugging Methodology, EasyDbg, Escalation Engineering, Memory Dump Analysis Services, Software Technical Support, Tool Objects, Tools, Troubleshooting Methodology | No Comments »
Friday, October 8th, 2010
This pattern is called Invalid Exception Information and shows how to recognize it and get a stack trace right when a debugger is not able to locate a crash point. For example, WinDbg default analysis command is not able to locate the exception context for a crash and provides a heuristic stack trace:
0:000> !analyze -v
[...]
EXCEPTION_RECORD:  001150fc -- (.exr 0x1150fc)

ExceptionAddress: 7c7e2afb (kernel32!RaiseException+0x00000053)

   ExceptionCode: 0eedfade

  ExceptionFlags: 00000001

NumberParameters: 7

   Parameter[0]: 0098fa49

   Parameter[1]: 0374c200

   Parameter[2]: 00000000

   Parameter[3]: 005919b4

   Parameter[4]: 01d80010

   Parameter[5]: 00115704

   Parameter[6]: 001154a4
[...]
CONTEXT:  0012ffb4 — (.cxr 0×12ffb4)

eax=00000000 ebx=00000000 ecx=0000019c edx=00000214 esi=00000000 edi=00000000

eip=000003b0 esp=000002d8 ebp=2d59495b iopl=0 nv up ei ng zr na pe nc

cs=0032 ss=0010 ds=0002 es=0000 fs=0000 gs=0000 efl=000003e4

0032:000003b0 ??              ???
[...]
STACK_TEXT:

7c910328 ntdll!`string'+0x4

7c7db7d0 kernel32!ConsoleApp+0xe

7c7db7a4 kernel32!ConDllInitialize+0x20f

7c7db7b9 kernel32!ConDllInitialize+0x224

7c915239 ntdll!bsearch+0x42

7c91542b ntdll!RtlpLocateActivationContextSection+0x15a

7c915474 ntdll!RtlpCompareActivationContextDataTOCEntryById+0x0

7c916104 ntdll!RtlpFindUnicodeStringInSection+0x23d

7c91534a ntdll!RtlpFindNextActivationContextSection+0x61

7c915742 ntdll!RtlFindNextActivationContextSection+0x46

7c9155ed ntdll!RtlFindActivationContextSectionString+0xde

7c915ce9 ntdll!RtlDecodeSystemPointer+0x9e7

7c915d47 ntdll!RtlDecodeSystemPointer+0xb0b

7c9158ff ntdll!RtlDecodeSystemPointer+0x45b

7c915bf8 ntdll!RtlDosApplyFileIsolationRedirection_Ustr+0x346

7c915c5d ntdll!RtlDosApplyFileIsolationRedirection_Ustr+0x3de

7c97e214 ntdll!DllExtension+0xc

00800000 ApplicationA+0x400000

7c910000 ntdll!RtlFreeHeap+0x1a4

7c914a53 ntdll!LdrLockLoaderLock+0x146

7c912d04 ntdll!LdrLockLoaderLock+0x1d2

7c912d71 ntdll!LdrUnlockLoaderLock+0x88

7c916768 ntdll!LdrGetDllHandleEx+0xc9

7c912d80 ntdll!`string'+0x84

7c91690e ntdll!LdrGetDllHandleEx+0x2f1

7c912d78 ntdll!LdrUnlockLoaderLock+0xb1

7c97ecc0 ntdll!LdrpHotpatchCount+0x8

7c9167e8 ntdll!`string'+0xc4

7c9168d6 ntdll!LdrGetDllHandleEx+0x2de

7c9166b8 ntdll!LdrGetDllHandle+0x18

7c7de534 kernel32!GetModuleHandleForUnicodeString+0x1d

7c7de544 kernel32!GetModuleHandleForUnicodeString+0xa0

7c7de64b kernel32!BasepGetModuleHandleExW+0x18e

7c7de6cb kernel32!BasepGetModuleHandleExW+0x250

79000000 mscoree!_imp__EnterCriticalSection <PERF> +0x0

7c809ad8 kernel32!_except_handler3+0x0

7c7de548 kernel32!`string'+0x28

79002280 mscoree!`string'+0x0

02080000 xpsp2res+0xc0000

7c7db6d4 kernel32!_BaseDllInitialize+0x7a

7c7db6e9 kernel32!_BaseDllInitialize+0x488

7c917ef3 ntdll!LdrpSnapThunk+0xbd

7c9048b8 ntdll!$$VProc_ImageExportDirectory+0x14b8

7c9000d0 ntdll!RtlDosPathSeperatorsString <PERF> +0x0

7c905d48 ntdll!$$VProc_ImageExportDirectory+0x2948

7c910228 ntdll!RtlpRunTable+0x448

7c910222 ntdll!RtlpAllocateFromHeapLookaside+0x42

7c911086 ntdll!RtlAllocateHeap+0x43d

7c903400 ntdll!$$VProc_ImageExportDirectory+0x0

7c7d9036 kernel32!$$VProc_ImageExportDirectory+0x6a0a

791c6f2d mscorwks!DllMain+0x117

7c917e10 ntdll!`string'+0xc

7c918047 ntdll!LdrpSnapThunk+0x317

7c7d00f0 kernel32!_imp___wcsnicmp <PERF> +0x0

7c7d903c kernel32!$$VProc_ImageExportDirectory+0x6a10

7c917dba ntdll!LdrpGetProcedureAddress+0x186

7c900000 ntdll!RtlDosPathSeperatorsString <PERF> +0x0

7c917e5f ntdll!LdrpGetProcedureAddress+0x29b

7c7d262c kernel32!$$VProc_ImageExportDirectory+0x0

7c7d0000 kernel32!_imp___wcsnicmp <PERF> +0x0

79513870 mscorsn!DllMain+0x119

7c913425 ntdll!RtlDecodePointer+0x0

00726574 ApplicationA+0x326574

7c917e09 ntdll!LdrpGetProcedureAddress+0xa6

7c917ec0 ntdll!LdrGetProcedureAddress+0x18

7c9101e0 ntdll!CheckHeapFillPattern+0x54

7c9101db ntdll!RtlAllocateHeap+0xeac

40ae17ea msxml6!calloc+0xa9

40ae181f msxml6!calloc+0xde

40a30000 msxml6!_imp__OpenThreadToken <PERF> +0x0

7c910323 ntdll!RtlpImageNtHeader+0x56

7c910385 ntdll!RtlImageDirectoryEntryToData+0x57

00400100 ApplicationA+0x100

7c928595 ntdll!LdrpCallTlsInitializers+0x1d

00400000 ApplicationA+0x0

7c9285c7 ntdll!LdrpCallTlsInitializers+0xd8

7c90118a ntdll!LdrpCallInitRoutine+0x14

00a23010 ApplicationA+0x623010

7c9285d0 ntdll!`string'+0x18

7c935e24 ntdll!LdrpInitializeThread+0x147

7c91b1b7 ntdll!LdrpInitializeThread+0x13b

778e159a SETUPAPI!_DllMainCRTStartup+0x0

7c91b100 ntdll!`string'+0x88

7c91b0a4 ntdll!_LdrpInitialize+0x25b

7c90de9a ntdll!NtTestAlert+0xc

7c91b030 ntdll!`string'+0xc8

7c91b02a ntdll!_LdrpInitialize+0x246

7c90d06a ntdll!NtContinue+0xc

7c90e45f ntdll!KiUserApcDispatcher+0xf

00780010 ApplicationA+0x380010

7c951e13 ntdll!DbgUiRemoteBreakin+0x0

7c97e178 ntdll!LdrpLoaderLock+0x0

00d10000 ApplicationA+0x910000

7c951e40 ntdll!DbgUiRemoteBreakin+0x2d

7c90e920 ntdll!_except_handler3+0x0

7c951e60 ntdll!`string'+0x7c
Compare our invalid context data with the normal one having good efl and segment register values:
cs=0023 ss=002b ds=002b es=002b fs=0053 gs=002b efl=00010206
We look at our stack trace after resetting context and using kv command. We see that KiUserExceptionDispatcher has the valid exception context but exception pointers for UnhandledExceptionFilter are not valid:
0:000> .ecxr
0:000> kv

ChildEBP RetAddr  Args to Child

001132d0 7c90df4a 7c7d9590 00000002 001132fc ntdll!KiFastSystemCallRet

001132d4 7c7d9590 00000002 001132fc 00000001 ntdll!ZwWaitForMultipleObjects+0xc

00113370 7c7da115 00000002 001134a0 00000000 kernel32!WaitForMultipleObjectsEx+0x12c

0011338c 6993763c 00000002 001134a0 00000000 kernel32!WaitForMultipleObjects+0x18

00113d20 699382b1 00115018 00000001 00198312 faultrep!StartDWException+0x5df

00114d94 7c834526 00115018 00000001 00000000 faultrep!ReportFault+0x533

00115008 0040550c 00115018 7c9032a8 001150fc kernel32!UnhandledExceptionFilter+0×55b

WARNING: Stack unwind information not available. Following frames may be wrong.

00115034 7c90327a 001150fc 0012ffb4 0011512c ApplicationA+0×550c

001150e4 7c90e48a 00000000 0011512c 001150fc ntdll!ExecuteHandler+0×24

001150e4 7c7e2afb 00000000 0011512c 001150fc ntdll!KiUserExceptionDispatcher+0xe (CONTEXT @ 0011512c)

0011544c 0057ac37 0eedfade 00000001 00000007 kernel32!RaiseException+0×53

00115470 0098fa49 0eedfade 00000001 00000007 ApplicationA+0×17ac37

[…]

0012268c 7e398816 017d0f87 000607e8 0000001a USER32!InternalCallWinProc+0×28

001226f4 7e3a8ea0 00000000 017d0f87 000607e8 USER32!UserCallWinProcCheckWow+0×150
0:000> dd 00115018 L4

00115018  001150fc 0012ffb4 0011512c 001150d0
So we use the valid context pointer now:
0:000> .cxr 0011512c

eax=001153fc ebx=0eedfade ecx=00000000 edx=001537a8 esi=001154a4 edi=00000007

eip=7c7e2afb esp=001153f8 ebp=0011544c iopl=0         nv up ei pl nz na po nc

cs=001b  ss=0023  ds=0023  es=0023  fs=003b  gs=0000             efl=00200202

kernel32!RaiseException+0×53:

7c7e2afb 5e              pop     esi
0:000> kv

  *** Stack trace for last set context - .thread/.cxr resets it

ChildEBP RetAddr  Args to Child

0011544c 0057ac37 0eedfade 00000001 00000007 kernel32!RaiseException+0x53

WARNING: Stack unwind information not available. Following frames may be wrong.

00115470 0098fa49 0eedfade 00000001 00000007 ApplicationA+0x17ac37

[...]

0012268c 7e398816 017d0f87 000607e8 0000001a USER32!InternalCallWinProc+0x28

001226f4 7e3a8ea0 00000000 017d0f87 000607e8 USER32!UserCallWinProcCheckWow+0x150

00122748 7e3aacd1 00fd2ad0 0000001a 00000000 USER32!DispatchClientMessage+0xa3

00122778 7c90e473 00122788 00000030 00000030 USER32!__fnINSTRING+0x37

001227b4 7e3993e9 7e3993a8 00122840 00000000 ntdll!KiUserCallbackDispatcher+0x13

001227e0 7e3aa43b 00122840 00000000 00000000 USER32!NtUserPeekMessage+0xc

0012280c 004794d9 00122840 00000000 00000000 USER32!PeekMessageA+0xeb

001228bc 00461667 0012ff7c 00461680 001228e0 ApplicationA+0x794d9

[...]
- Dmitry Vostokov @ DumpAnalysis.org + TraceAnalysis.org -
Posted in Crash Dump Analysis, Debugging, WinDbg Tips and Tricks | No Comments »
Thursday, October 7th, 2010
It is time now to introduce a syntactical notation for memory (dump) and software trace analysis pattern languages (in addition to graphical notation proposed earlier). It should be simple and concise: allow easy grammar with plain syntax and obvious reading semantics. We propose to use capitalized letters for major pattern categories, for example, W for wait chains and D for deadlocks. Then use subscripts (or small letters) for pattern subcategories, for example, Wcs and Dlpc. Several categories and subcategories can be combined by using slash (/), for example, Wcs/Dcs/lpc. Slash notation is better viewed using subscripts:
Wcs/Dcs/lpc
Next part will introduce more categories and propose notational adornments for pattern succession, space differentiation and the inclusion of details in notational sentences.
- Dmitry Vostokov @ DumpAnalysis.org + TraceAnalysis.org -
Posted in Analysis Notation, Crash Dump Analysis, Crash Dump Patterns, Debugging, Science of Memory Dump Analysis, Science of Software Tracing, Software Behavior Patterns, Software Trace Analysis, Structural Memory Patterns, Trace Analysis Patterns | No Comments »
Tuesday, October 5th, 2010
The choice of webinars below mostly reflects my personal preferences and long time desire to speak on topics like systems thinking, troubleshooting tool design and development. The other topic about BSOD minidump analysis was requested by participants in an ongoing survey. There will be more topics in 2011. All forthcoming webinars will be hosted by Memory Dump Analysis Services. The planning list includes:
Systems Thinking in Memory Dump and Software Trace Analysis
Software Troubleshooting and Debugging Tools: Objects, Components, Patterns and Frameworks with UML
- UML basics
- DebugWare patterns
- Unified Troubleshooting Framework
- RADII software development process
- Hands-on exercise: designing and building a tool
Blue Screen Of Death Analysis Done Right: Minidump Investigation for System Administrators
- Making sense of !analyze –v output
- Get extra troubleshooting information with additional WinDbg commands
- Guessing culprits with raw stack analysis
- Who’s responsible: hardware or software?
- Checklist and patterns
- Including hands-on exercises: send your own minidumps
More detailed information will be available soon.
- Dmitry Vostokov @ DumpAnalysis.org + TraceAnalysis.org -
Posted in Announcements, CDF Analysis Tips and Tricks, Common Mistakes, Common Questions, Crash Analysis Report Environment (CARE), Crash Dump Analysis, Crash Dump De-analysis, Crash Dump Patterns, Crash Dumps for Dummies, DebugWare Patterns, Debugging, Debugging Industry, Debugging Methodology, Escalation Engineering, General Memory Analysis, Hermeneutics of Memory Dumps and Traces, Memory Systems Language, Minidump Analysis, Software Architecture, Software Behavior Patterns, Software Engineering, Software Technical Support, Software Trace Analysis, Software Tracing for Dummies, Structural Memory Patterns, Systems Thinking, Tools, Trace Analysis Patterns, Training and Seminars, Troubleshooting Methodology, Vista, Webinars, WinDbg Tips and Tricks, Windows 7, Windows Server 2008, Windows System Administration, x64 Windows | No Comments »
Monday, October 4th, 2010
Don’t name your driver a “Missile” blog post dealt with funny names seen in crash dumps. However, even innocuous driver names may occasionally provoke a laughter from people in the know. For example, SGUB32.SYS can be read 23BUGS in reverse. My recent encounter is a print driver SGNUD64.dll where we read 46DUNGS in reverse. Don’t rush to Google the name to find ISV, it was modified to avoid an engineering embarrassment, although a dung was really there
- Dmitry Vostokov @ DumpAnalysis.org + TraceAnalysis.org -
Posted in Crash Dump Analysis, Fun with Crash Dumps, Kernel Development | No Comments »
Monday, October 4th, 2010
This is an image fragment from the front cover of the forthcoming Debugged! MZ/PE December issue:
- Dmitry Vostokov @ DumpAnalysis.org + TraceAnalysis.org -
Posted in Art, Crash Dump Analysis, Debugged! MZ/PE, Debugging, Fun with Crash Dumps, Fun with Debugging, Physicalist Art | No Comments »
Monday, October 4th, 2010
It is a common technique in driver development to copy/paste an entire driver sample from WDK and modify it for a specific device or a filter value-adding functionality in a specific driver stack or framework. The problem here is that developers sometimes forget to change module resources and certain amount of detective work is required to find out the module vendor. I call this pattern Template Module. Here is an example. In a spooler service there were many threads blocked in displaying a dialog box:
0:000> ~34kL 100

Child-SP          RetAddr           Call Site

00000000`08a49368 00000000`774c5118 user32!NtUserWaitMessage+0xa

00000000`08a49370 00000000`774c5770 user32!DialogBox2+0x261

00000000`08a493f0 00000000`774c57e6 user32!InternalDialogBox+0x134

00000000`08a49450 00000000`774c3e36 user32!DialogBoxIndirectParamAorW+0x58

00000000`08a49490 000007fe`fa27cc97 user32!DialogBoxParamW+0x66

00000000`08a494d0 000007fe`fa28832b unidrvui!ICheckConstraintsDlg+0xbf

00000000`08a49950 000007fe`fa29423d unidrvui!BUpdateUISettingForOEM+0x2f

00000000`08a49980 00000000`50036d2c unidrvui!CPrintOemDriverUI::DrvUpdateUISetting+0x1d

00000000`08a499b0 00000000`50038a1d ModuleZ!DllGetClassObject+0×1fe74

[…]

00000000`08a4b250 000007fe`f759546b unidrvui!OEMDevicePropertySheets+0×56

00000000`08a4b280 000007fe`f759653e compstui!CallpfnPSUI+0×137

00000000`08a4b330 000007fe`f7596b84 compstui!InsertPSUIPage+0×24a

00000000`08a4b5f0 000007fe`fa2880e9 compstui!CPSUICallBack+0×3ec

00000000`08a4b6a0 000007fe`fa2836c4 unidrvui!BAddOemPluginPages+0×12d

00000000`08a4b6d0 000007fe`f759546b unidrvui!DrvDevicePropertySheets+0×2c8

00000000`08a4bb60 000007fe`f759653e compstui!CallpfnPSUI+0×137

00000000`08a4bc10 000007fe`f7596b84 compstui!InsertPSUIPage+0×24a

00000000`08a4bed0 000007fe`fb452838 compstui!CPSUICallBack+0×3ec

00000000`08a4bf80 000007fe`f759546b winspool!DevicePropertySheets+0×108

00000000`08a4bfb0 000007fe`f759653e compstui!CallpfnPSUI+0×137

00000000`08a4c060 000007fe`f7596b84 compstui!InsertPSUIPage+0×24a

00000000`08a4c320 000007fe`f759758e compstui!CPSUICallBack+0×3ec

00000000`08a4c3d0 000007fe`f75976b2 compstui!DoCommonPropertySheetUI+0xbe

00000000`08a4c430 000007fe`fb446339 compstui!CommonPropertySheetUIW+0xe

00000000`08a4c470 000007fe`fb44b425 winspool!CallCommonPropertySheetUI+0×65

00000000`08a4c4c0 00000000`5003623c winspool!PrinterPropertiesNative+0×121

00000000`08a4c950 00000000`50035d16 ModuleZ!DllGetClassObject+0×1f384

[…]

00000000`08a4dd70 000007fe`fb4472d8 unidrvui!DrvPrinterEvent+0×419

00000000`08a4de00 000007fe`fb44737f winspool!SpoolerPrinterEventNative+0×84

00000000`08a4de60 000007fe`faedc957 winspool!SpoolerPrinterEvent+0×13

00000000`08a4dea0 000007fe`faedc8c7 localspl!SplDriverEvent+0×4f

00000000`08a4def0 000007fe`faec3d74 localspl!PrinterDriverEvent+0xcf

00000000`08a4df30 000007fe`fa771f20 localspl!SplAddPrinter+0xae0

00000000`08a4e4e0 000007fe`fa7491d8 win32spl!NCSRCommon::TLocalPrinter::AddPrinterW+0xb4

00000000`08a4e5b0 000007fe`fa747511 win32spl!TPrintOpen::AddLocalPrinter+0xb8

00000000`08a4e6b0 000007fe`fa746dfb win32spl!TPrintOpen::AddAndInstallLocalPrinter+0×34d

00000000`08a4e830 000007fe`fa746bb0 win32spl!TPrintOpen::ReEstablishCacheConnectionNoGuidPrinter+0×157

00000000`08a4e900 000007fe`fa7467d1 win32spl!TPrintOpen::ReEstablishCacheConnection+0×178

00000000`08a4e980 000007fe`fa7465c1 win32spl!TPrintOpen::ReEstablishPrinterConnection+0×16d

00000000`08a4ea30 000007fe`fa73e5ad win32spl!TPrintOpen::ReEstablishConnectionFromKey+0×1fd

00000000`08a4eb30 000007fe`fa733492 win32spl!TPrintOpen::RediscoverPrinterConnections+0xd7

00000000`08a4ebe0 000007fe`fb3f2332 win32spl!TPrintProviderTable::forwardEnumPrinters+0×47

00000000`08a4ec70 00000000`ff3414c8 spoolss!EnumPrintersW+0×176

00000000`08a4ed20 00000000`ff3413cc spoolsv!YEnumPrinters+0×112

00000000`08a4eda0 000007fe`fe225ec5 spoolsv!RpcEnumPrinters+0×30

00000000`08a4edf0 000007fe`fe2bebed rpcrt4!Invoke+0×65

00000000`08a4ee70 000007fe`fe1f5df0 rpcrt4!Ndr64StubWorker+0×5a9

00000000`08a4f440 000007fe`fe2268d4 rpcrt4!NdrServerCallAll+0×40

00000000`08a4f490 000007fe`fe2269f0 rpcrt4!DispatchToStubInCNoAvrf+0×14

00000000`08a4f4c0 000007fe`fe227402 rpcrt4!RPC_INTERFACE::DispatchToStubWorker+0×100

00000000`08a4f5b0 000007fe`fe227080 rpcrt4!LRPC_SCALL::DispatchRequest+0×1c2

00000000`08a4f620 000007fe`fe2262bb rpcrt4!LRPC_SCALL::HandleRequest+0×200

00000000`08a4f740 000007fe`fe225e1a rpcrt4!LRPC_ADDRESS::ProcessIO+0×44a

00000000`08a4f860 000007fe`fe207769 rpcrt4!LOADABLE_TRANSPORT::ProcessIOEvents+0×24a

00000000`08a4f910 000007fe`fe207714 rpcrt4!ProcessIOEventsWrapper+0×9

00000000`08a4f940 000007fe`fe2077a4 rpcrt4!BaseCachedThreadRoutine+0×94

00000000`08a4f980 00000000`7758be3d rpcrt4!ThreadStartRoutine+0×24

00000000`08a4f9b0 00000000`776c6a51 kernel32!BaseThreadInitThunk+0xd

00000000`08a4f9e0 00000000`00000000 ntdll!RtlUserThreadStart+0×1d
We suspect ModuleZ but its module information points to Microsoft:
0:000> lmv m ModuleZ

start             end                 module name

00000000`50000000 00000000`500a4000   ModuleZ   (export symbols)       ModuleZ.DLL

    Loaded symbol image file: ModuleZ.DLL

    Image path: C:\Windows\System32\spool\drivers\x64\3\ModuleZ.DLL

    Image name: ModuleZ.DLL

    Timestamp:        Feb […] 2010

    […]

    File version:     2.5.0.0

    Product version:  2.5.0.0

    File flags:       0 (Mask 3F)

    File OS:          40004 NT Win32

    File type:        2.0 Dll

    File date:        00000000.00000000

    Translations:     0407.04b0

    CompanyName:      Microsoft Corp.

    ProductName:      Microsoft PS UI Replacement Sample

    InternalName:     PSUIREP

    OriginalFilename: PSUIREP.dll

    ProductVersion:   2.5

    FileVersion:      2.5.0.0

    FileDescription:  PS UI Replacement Sample

    LegalCopyright:   Copyright © 1998 - 2009 Microsoft Corp.

    LegalTrademarks:  Microsoft® is a registered trademark of Microsoft Corporation. Windows(TM) is a trademark of Microsoft Corporation

    Comments:         Written by Windows Printing & Imaging Team
Having never seen ModuleZ in Microsoft module lists and suspecting the word “Sample” in a file and product description we did Internet search and found the module name on various “DLL fixing” websites but still pointing to Microsoft in module description. However, in a full module list (lmt WinDbg command) we found more modules having Module* name structure:
0:000> lmv m ModuleC

start             end                 module name

00000000`10000000 00000000`100b7000   ModuleC   (deferred)

    Image path: C:\Windows\System32\spool\drivers\x64\3\ModuleC.DLL

    Image name: ModuleC.DLL

    Timestamp:        Feb […] 2010

    […]

    File version:     20.1.0.0

    Product version:  20.1.0.0

    File flags:       0 (Mask 17)

    File OS:          4 Unknown Win32

    File type:        2.0 Dll

    File date:        00000000.00000000

    Translations:     0409.04b0

    CompanyName:

    ProductName:      Printer Driver

    InternalName:     MC.dll

    OriginalFilename: MC.dll

    ProductVersion:   20.1.0.0

    FileVersion:      20.1.0.0

    FileDescription:  Printer Driver

    LegalCopyright:
0:000> lmv m ModuleO

start             end                 module name

00000000`6f280000 00000000`6f2e2000   ModuleO   (deferred)

    Image path: C:\Windows\System32\spool\drivers\x64\3\ModuleO.DLL

    Image name: ModuleO.DLL

    Timestamp:        Feb […] 2010

    […]

    File version:     2.4.0.0

    Product version:  2.4.0.0

    File flags:       8 (Mask 3F) Private

    File OS:          40004 NT Win32

    File type:        3.1 Driver

    File date:        00000000.00000000

    Translations:     0409.04b0

    CompanyName:      CompanyA

    ProductName:      CompanyA Printer driver

    InternalName:     ModuleO.dll

    OriginalFilename: ModuleO.dll

    ProductVersion:   2.4

    FileVersion:      2.4.0.0

    FileDescription:  CompanyA Printer driver

    LegalCopyright:   Copyright © CompanyA

    Comments:
We see that both module names and time stamps follow the same pattern so our “Microsoft” ModuleZ is definitely from CompanyA instead. We also check more detailed information:
0:000> !lmi 00000000`50000000

Loaded Module Info: [00000000`50000000]

         Module: ModuleZ

[...]

               Pdb: N:\ServerQ\[…]

[…]
0:000> !lmi 00000000`10000000

Loaded Module Info: [00000000`10000000]

         Module: ModuleC

[...]

               Pdb: N:\ServerQ\[…]

[…]
0:000> !lmi 00000000`6f280000

Loaded Module Info: [00000000`6f280000]

         Module: ModuleO

[...]

               Pdb: N:\ServerQ\[…]

[…]
All three modules have the same build server in their PDB file name path. We advised to contact CompanyA for updates.
- Dmitry Vostokov @ DumpAnalysis.org + TraceAnalysis.org -
Posted in Crash Dump Analysis, Crash Dump Patterns, Debugging | 1 Comment »
Monday, October 4th, 2010
After firing 3 bugtations in a row noticed that I lost all followers

- Dmitry Vostokov @ DumpAnalysis.org + TraceAnalysis.org -
Posted in Bugtations, Memory and Glitches | 1 Comment »