Demystifying first-chance exceptions (Part 2)
Thursday, February 4th, 2010Sometimes we are not interested in first-chance exceptions as in the previous part but are interested in only second-chance exceptions to be sure that they were not handled as a part of an implementation design. Some tools like ADPlus can save dump files for both debugger events but I was asked to explain the difference between the first- and second-chance exceptions on W2K3 system where NTSD debugger was used to attach to a service process and save a dump. Initially the following command was used:
C:\> ntsd -psn ServiceA -noio -g -c ".dump /ma /u C:\UserDumps\ServiceA; q"
The dump was saved and analyzed. An engineer then decided that a second-chance exception dump file was needed for confirmation of an unhandled exception (because it was perceived that a postmortem debugger wasn’t saving any crash dumps) and requested to use the same command but with an -x switch that disables first-chance exception break in a debugger:
C:\> ntsd -psn ServiceA -noio -g -x -c “.dump /ma /u C:\UserDumps\ServiceA; q”
Note that q command terminates the debuggee so it was also advised to use qd to detach NTSD and let the service die naturally.
Two different possible exception memory dumps and the third possibility of a postmortem memory dump already complicates the picture not counting possible process-dumper-in-the-middle memory dumps that can be saved by userdump.exe if there is any exception dialog between the first- and second-chance exception processing. So I created two “Time Arrow” diagrams aiming to depict two exception scenarios using TestDefaultDebugger tool and the following simplified commands on x64 W2K3 system:
C:\> ntsd -pn TestDefaultDebugger64.exe -g -c ".dump /ma /u C:\UserDumps\TDD; qd"
and
C:\> ntsd -pn TestDefaultDebugger64.exe -g -x -c “.dump /ma /u C:\UserDumps\TDD; qd”
Also drwtsn32.exe was set as a default postmortem debugger (but we could also use CDB, WinDbg or any other process dumper as shown in Vista example).
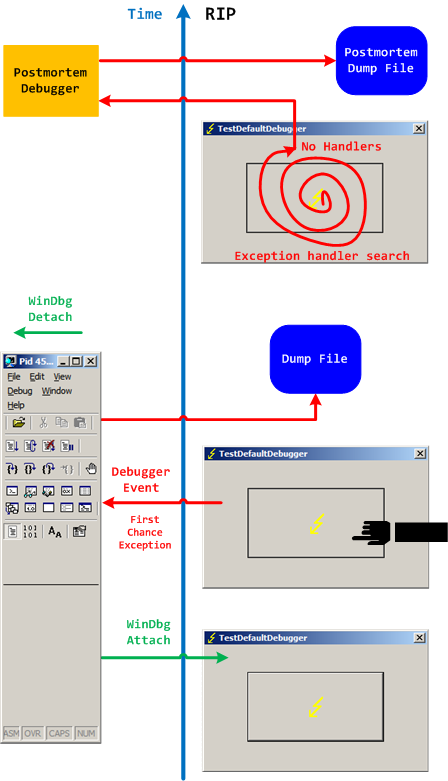
The first diagram shows that an attached debugger (a screenshot of WinDbg is used in place of NTSD for both diagrams) receives a first-chance debugger event and saves a process memory dump, then detaches and the previous debuggee process continues looking for exception handlers and not finding anyone launches a postmortem debugger and, as a result, another dump is saved too:
We can double check the first-chance exception dump file to see if it is the right one. Indeed, there are no signs of exception processing on thread raw stack:
This dump file has an exception of interest stored in it.

The stored exception information can be accessed via .ecxr.

(e50.e54): Access violation - code c0000005 (first/second chance not available)

*** ERROR: Module load completed but symbols could not be loaded for TestDefaultDebugger64.exe

TestDefaultDebugger64+0×1570:

00000000`00401570 c704250000000000000000 mov dword ptr [0],0 ds:00000000`00000000=????????
0:000> !teb

TEB at 000007fffffde000

    ExceptionList:        0000000000000000

    StackBase:            0000000000130000

    StackLimit:           000000000012c000

    SubSystemTib:         0000000000000000

    FiberData:            0000000000001e00

    ArbitraryUserPointer: 0000000000000000

    Self:                 000007fffffde000

    EnvironmentPointer:   0000000000000000

    ClientId:             0000000000000e50 . 0000000000000e54

    RpcHandle:            0000000000000000

    Tls Storage:          0000000000000000

    PEB Address:          000007fffffda000

    LastErrorValue:       0

    LastStatusValue:      c0000023

    Count Owned Locks:    0

    HardErrorMode:        0
0:000> dqs 000000000012c000 0000000000130000

00000000`0012c000  00000000`00000000

00000000`0012c008  00000000`00000000

00000000`0012c010  00000000`00000000

00000000`0012c018  00000000`00000000
[... no c0000005 ...]
00000000`0012ff60  00000000`00000000

00000000`0012ff68  00000000`00000000

00000000`0012ff70  00000000`00000000

00000000`0012ff78  00000000`77d596ac kernel32!BaseProcessStart+0x29

00000000`0012ff80  00000000`00000000

00000000`0012ff88  00000000`00000000

00000000`0012ff90  00000000`00000000

00000000`0012ff98  00000000`00000000

00000000`0012ffa0  00000000`00000000

00000000`0012ffa8  00000000`00000000

00000000`0012ffb0  00000000`004148d0 TestDefaultDebugger64+0x148d0

00000000`0012ffb8  00000000`00000000

00000000`0012ffc0  00000000`00000000

00000000`0012ffc8  00000000`00000000

00000000`0012ffd0  00000000`00000000

00000000`0012ffd8  00000000`00000000

00000000`0012ffe0  00000000`00000000

00000000`0012ffe8  00000000`00000000

00000000`0012fff0  00000000`00000000

00000000`0012fff8  00000000`00000000

00000000`00130000  00000020`78746341
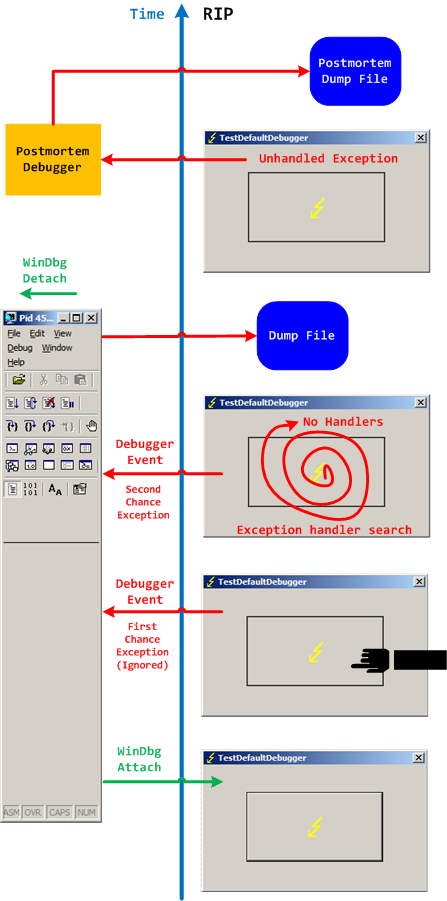
The second diagram shows that an attached debugger ignores a first-chance debugger event but saves a process memory dump upon a second-chance exception event after the debugee can’t find any handlers, then detaches and the previous debuggee process launches a postmortem debugger to save another postmortem memory dump:
In both second-chance and postmortem process memory dump files we can find c0000005 exception code on thread raw stack.
- Dmitry Vostokov @ DumpAnalysis.org + TraceAnalysis.org -