Native Script Debugging
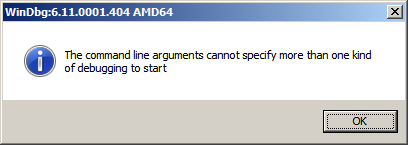
Monday, February 1st, 2010While testing a WinDbg script for the CARE system (the script enumerates files on a Windows PC and processes memory dumps to generate a log file with the output of debugger commands) I found that after successful processing of many files the next launched WinDbg instance suddenly showed this message box:
To find out, I attached another WinDbg instance to its process in order to examine the real command line. In this small case study instead of using kb WinDbg command to show a stack trace and its arguments I employ kn, .frame and kb <lines> commands for visual clarity and to illustrate strack trace frame navigation. In the failed WinDbg instance that had just started we see only one thread showing Message Box pattern:
0:000> ~*kn
.  0  Id: dc8.fb4 Suspend: 1 Teb: 000007ff`fffdc000 Unfrozen

 # Child-SP          RetAddr           Call Site

00 00000000`0025d4b8 00000000`76fc5118 USER32!NtUserWaitMessage+0xa

01 00000000`0025d4c0 00000000`76fc5770 USER32!DialogBox2+0x261

02 00000000`0025d540 00000000`7701000d USER32!InternalDialogBox+0x134

03 00000000`0025d5a0 00000000`7700f2b8 USER32!SoftModalMessageBox+0x9fb

04 00000000`0025d6d0 00000000`7700eb17 USER32!MessageBoxWorker+0x314

05 00000000`0025d890 00000000`7700ea10 USER32!MessageBoxTimeoutW+0xb3

06 00000000`0025d950 00000001`3f9016a6 USER32!MessageBoxW+0x4c

07 00000000`0025d990 00000001`3f90175c WinDbg!TextMsgBox+0x96

08 00000000`0025d9d0 00000001`3f9017d7 WinDbg!FormatMsgBoxV+0x9c

09 00000000`0025dbe0 00000001`3f9075c7 WinDbg!InfoBox+0x37

0a 00000000`0025dc20 00000001`3f9084f7 WinDbg!ParseCommandLine+0x1a57

0b 00000000`0025dcc0 00000001`3f913739 WinDbg!wmain+0×287

0c 00000000`0025fd80 00000000`7708be3d WinDbg!_CxxFrameHandler3+0×291

0d 00000000`0025fdc0 00000000`771c6a51 kernel32!BaseThreadInitThunk+0xd

0e 00000000`0025fdf0 00000000`00000000 ntdll!RtlUserThreadStart+0×1d
We see the frame # 0b contains the return address of wmain function (starting point of execution of UNICODE C/C++ programs) that has this prototype:
int wmain(int argc, wchar_t *argv[], wchar_t *envp[]);
We switch to that frame to examine its first 3 parameters and use kb command that shows stack traces starting from the current frame (we are interested in the top stack trace line only):
0:000> .frame b

0b 00000000`0025dcc0 00000001`3f913739 WinDbg!wmain+0×287
0:000> kb 1

RetAddr           : Args to Child                                                           : Call Site

00000001`3f913739 : 00000000`0000000c 00000000`00278b60 00000000`00279e10 000007de`a4ecc920 : WinDbg!wmain+0×287
Because the function prototype shows the second function parameter as an array of wide character null-terminated strings we use dpu command to dump them. We also note that we have only 0xc array members and use this as the length argument for dpu:
0:000> dpu 00000000`00278b60 Lc

00000000`00278b60  00000000`00278bc8 “C:\Program Files\Debugging Tools for Windows (x64)\WinD”

00000000`00278b68  00000000`00278c44 “-y”

00000000`00278b70  00000000`00278c4a “srv*c:\ms*http://msdl.microsoft.com/download/symbols;sr”

00000000`00278b78  00000000`00278d0c “-z”

00000000`00278b80  00000000`00278d12 “C:\MemoryDumps\CST\ColorimetricTracing”

00000000`00278b88  00000000`00278d60 “(4).DMP”

00000000`00278b90  00000000`00278d70 “-c”

00000000`00278b98  00000000`00278d76 “$$>a<DebuggerLogs.txt;q”

00000000`00278ba0  00000000`00278da6 “-Q”

00000000`00278ba8  00000000`00278dac “-QS”

00000000`00278bb0  00000000`00278db4 “-QY”

00000000`00278bb8  00000000`00278dbc “-QSY”
We see in the output above that “C:\MemoryDumps\CST\ColorimetricTracing” and “(4).DMP” strings were probably split from one file name “C:\MemoryDumps\CST\ColorimetricTracing (4).DMP” and this means that we forgot to enclose the file name parameter in double quotation marks when passing it from VB script to WinDbg.
- Dmitry Vostokov @ DumpAnalysis.org + TraceAnalysis.org -