OSMOSIS Memory Dumps

February 23rd, 2009

The main problem of memory dump analysis is the lack of consistent kernel virtual memory dumps saved on demand without system halt. LiveKd and Win32DD tools are physical memory dumpers only and do not save kernel memory dump files. These dumps are known to be inconsistent and I elaborated on different schemes to save memory consistently, for example, 1) to partition physical memory into 2 parts from OS boot time, 2) when memory snapshot is needed raise IRQL on all processors, 3) pump memory contents from one part to another (with compression if necessary, in such partition the reserved part of physical memory could be smaller), 4) lower IRQL on all processors to resume normal OS functions and 5) save consistent memory snapshot from reserved part of physical memory to a dump file in the background. The crucial feature of osmosis is its bipartite division and membrane. Hence the name of the project: 

OSMOSIS

Optimally Saved Memory of System Internal State

Optimally Saved Memory (of) Operating System Internal State


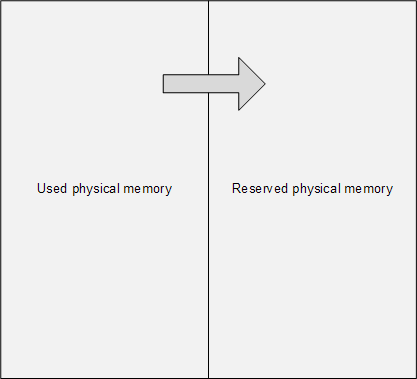
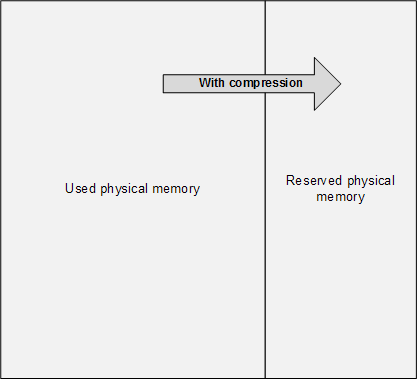
This is, of course, for OS running on physical machines, virtual machine case is much simpler in theory because we can freeze the whole VM or save its snapshot and later run an external tool or file converter on it.

- Dmitry Vostokov @ DumpAnalysis.org -

Book Update: Crash Dump Analysis for SA

February 20th, 2009

One of the good outcomes of the previously announced restructuring: the book Crash Dump Analysis for System Administrators (Windows edition) has been prioritized to be published on 30th of November, 2009 due to the overwhelming demand. The book will soon be available for pre-orders.

- Dmitry Vostokov @ DumpAnalysis.org -

Crash Dump Analysis Patterns (Part 81)

February 19th, 2009

One analysis problem that happens frequently is the absence of stack traces due to kernel stack pages being paged out and therefore not present in a complete memory dump that only contains physical memory. This shouldn’t be a problem for kernel or process memory dumps because they contain virtual memory. The problem usually manifests itself either on busy systems utilizing almost all physical memory or on over-aged systems where certain processes hadn’t been used for a long time. It could also be the case when a problem happened some time ago and only diagnosed much later. For example, this LPC wait chain for coupled processes happened to be 2 days ago before the dump was saved:

0: kd> !thread fffffadfcf9e8bf0 1f
THREAD fffffadfcf9e8bf0  Cid 61f0.2c70  Teb: 000007fffffdd000 Win32Thread: fffff97ff381a480 WAIT: (Unknown) UserMode Non-Alertable
    fffffadfcf9e8f58  Semaphore Limit 0x1
Waiting for reply to LPC MessageId 01e2cb39:
Current LPC port fffffa800e5a9d10
Impersonation token:  fffffa80039cd050 (Level Impersonation)
Owning Process fffffadffc7c7c20      
Image:         applicationA.exe
Wait Start TickCount      12018444           
Ticks: 11312740 (2:01:06:01.562)
Context Switch Count      456                 LargeStack
UserTime                  00:00:00.046
KernelTime                00:00:00.078
Start Address applicationA (0×0000000100061411)
Stack Init fffffadc125d4e00 Current fffffadc125d48e0
Base fffffadc125d5000 Limit fffffadc125cc000 Call 0
Priority 15 BasePriority 15 PriorityDecrement 0
Kernel stack not resident.

0: kd> !lpc message 01e2cb39
Searching message 1e2cb39 in threads …
    Server thread fffffadff93c5bf0 is working on message 1e2cb39

0: kd> !thread fffffadff93c5bf0 1f
THREAD fffffadff93c5bf0  Cid 0218.5130  Teb: 000007ffffcbc000 Win32Thread: 0000000000000000 WAIT: (Unknown) UserMode Non-Alertable
    fffffadff6c71c70  SynchronizationEvent
Impersonation token:  fffffa803bde5060 (Level Impersonation)
Owning Process fffffadcde439280     
Image:         applicationB.exe
Wait Start TickCount      12018444        
Ticks: 11312740 (2:01:06:01.562)
Context Switch Count      12            
UserTime                  00:00:00.000
KernelTime                00:00:00.000
Win32 Start Address 0×0000000001e2cb39
LPC Server thread working on message Id 1e2cb39
Start Address kernel32 (0×0000000077d6b6a0)
Stack Init fffffadc28b19e00 Current fffffadc28b19950
Base fffffadc28b1a000 Limit fffffadc28b14000 Call 0
Priority 14 BasePriority 13 PriorityDecrement 0
Kernel stack not resident.

One of tricks I started to recommend in such cases is to save user dumps of processes that could possibly be paged out before forcing a complete memory dump but I haven’t yet got enough data to see whether this helps or not.

- Dmitry Vostokov @ DumpAnalysis.org -

Memory Dump Analysis Pattern: A Definition

February 17th, 2009

I found today that I never came up with a definition for a memory dump analysis pattern and only mentioned similar design pattern definition in the first pattern post. Now it is time to draft it:

a common recurrent identifiable problem together with a set of recommendations and possible solutions to apply in a specific context

In memory dump analysis pattern catalogue some identified patterns are left without a set of recommendations and I’m going to rectify this in the nearest future.

- Dmitry Vostokov @ DumpAnalysis.org -

Wait Chain Patterns

February 17th, 2009

While preparing a presentation for an engineering conference I found that a page to reference various wait chain patterns is necessary, so I created this post:

I’ll update it as soon as I add more similar patterns.

- Dmitry Vostokov @ DumpAnalysis.org -

DLL Link Patterns

February 17th, 2009

While preparing a presentation for an engineering conference I found that another different page to reference link time problems is necessary, so I created this post:

I’ll update it as soon as I add more similar patterns.

- Dmitry Vostokov @ DumpAnalysis.org -

Memory Consumption Patterns

February 17th, 2009

While preparing a presentation for an engineering conference I found that yet another page to reference different kinds of insufficient memory patterns is necessary, so I created this post:

I’ll update it as soon as I add more similar patterns.

- Dmitry Vostokov @ DumpAnalysis.org -

Dynamic Memory Corruption Patterns

February 17th, 2009

While preparing a presentation for an engineering conference I found that another page to reference different kinds of dynamic memory corruption patterns is necessary, so I created this post too:

I’ll update it as soon as I add more similar patterns.

- Dmitry Vostokov @ DumpAnalysis.org -

Deadlock and Livelock Patterns

February 17th, 2009

While preparing a presentation for an engineering conference I found that a page to reference all different kinds of deadlocks is necessary, so I created this post:

I’ll update it as soon as I add more similar patterns.

- Dmitry Vostokov @ DumpAnalysis.org + TraceAnalysis.org -

The Mystery of Negative LockCount

February 16th, 2009

I’ve always wondered why LockCount is sometimes negative in the latest OS versions since SPs for Windows Server 2003:

0:000> !locks

CritSec +319ee0 at 00319EE0
LockCount -90
RecursionCount 1
OwningThread 1198
EntryCount 0
ContentionCount 734a6
*** Locked

CritSec +202e3d0 at 0202E3D0
LockCount -2
RecursionCount 1
OwningThread 1198
EntryCount 0
ContentionCount 0
*** Locked

CritSec +1b69ad4 at 01B69AD4
LockCount -2
RecursionCount 1
OwningThread 1198
EntryCount 0
ContentionCount 0
*** Locked

Finally the post on NT Debugging Blog pointed to WinDbg Help article (the section Interpreting Critical Section Fields in Windows Server 2003 SP1 and Later):

http://msdn.microsoft.com/en-us/library/cc267476.aspx

Be aware though that negative values could also mean Critical Section Corruption pattern:

CritSec printerA!DlgProc+53b38 at 107cddd8
WaiterWoken Yes
LockCount -69154612
RecursionCount 276618309
OwningThread 107cdd36

EntryCount 0
ContentionCount 0
*** Locked 

- Dmitry Vostokov @ DumpAnalysis.org -

Insufficient memory, handle leak, process factory, high contention and busy system: pattern cooperation

February 16th, 2009

It was reported that one system became slower and slower and eventually the complete memory dump was generated for analysis. Usual !vm 4 command shows pool allocation errors and particularly insufficient session pool memory for user session 1:

1: kd> !vm 4

*** Virtual Memory Usage ***
 Physical Memory:     1048503 (   4194012 Kb)
 Page File: \??\C:\pagefile.sys
   Current:   5109760 Kb  Free Space:   3668764 Kb
   Minimum:   5109760 Kb  Maximum:      5109760 Kb
 Available Pages:      409409 (   1637636 Kb)
 ResAvail Pages:       708135 (   2832540 Kb)
 Locked IO Pages:         108 (       432 Kb)
 Free System PTEs:     137566 (    550264 Kb)
 Free NP PTEs:          27288 (    109152 Kb)
 Free Special NP:           0 (         0 Kb)
 Modified Pages:          780 (      3120 Kb)
 Modified PF Pages:       771 (      3084 Kb)
 NonPagedPool Usage:    37587 (    150348 Kb)
 NonPagedPool Max:      65214 (    260856 Kb)

 PagedPool 0 Usage:     21583 (     86332 Kb)
 PagedPool 1 Usage:      3054 (     12216 Kb)
 PagedPool 2 Usage:      3076 (     12304 Kb)
 PagedPool 3 Usage:      3050 (     12200 Kb)
 PagedPool 4 Usage:      3040 (     12160 Kb)
 PagedPool Usage:       33803 (    135212 Kb)
 PagedPool Maximum:     66560 (    266240 Kb)

 ********** 185454 pool allocations have failed **********

 Shared Commit:        123289 (    493156 Kb)
 Special Pool:              0 (         0 Kb)
 Shared Process:       101937 (    407748 Kb)
 PagedPool Commit:      33850 (    135400 Kb)
 Driver Commit:          1697 (      6788 Kb)
 Committed pages:     1159581 (   4638324 Kb)
 Commit limit:        2283111 (   9132444 Kb)

[...]

 Session ID 1 @ af925000:
 Paged Pool Usage:       16868K

 *** 371034 Pool Allocation Failures ***

 Commit Usage:           17960K

 Session ID 2 @ af927000:
 Paged Pool Usage:        2856K
 Commit Usage:            3860K

[...]

The exploration of session 1 processes shows Process Factory pattern (5,000 launched processes) with explorer.exe ran amok:

1: kd> !sprocess 1
Dumping Session 1

_MM_SESSION_SPACE af925000
_MMSESSION        af925d80
PROCESS 87db34a0  SessionId: 1  Cid: 4a68    Peb: 7ffd4000  ParentCid: 01b8
    DirBase: cffb6d20  ObjectTable: e6084268  HandleCount: 11677.
    Image: csrss.exe

PROCESS 86083020  SessionId: 1  Cid: 4560    Peb: 7ffde000  ParentCid: 2978
    DirBase: cffb6f40  ObjectTable: e6c41410  HandleCount:  79.
    Image: AnotherApp.exe

PROCESS 8607c020  SessionId: 1  Cid: 44c8    Peb: 7ffdc000  ParentCid: 4cf8
    DirBase: cffb7080  ObjectTable: e3c9fd38  HandleCount: 25407.
    Image: explorer.exe

[...]

PROCESS 85e94738  SessionId: 1  Cid: 4868    Peb: 7ffde000  ParentCid: 44c8
    DirBase: cffb7c00  ObjectTable: e7038840  HandleCount:  39.
    Image: application.exe

PROCESS 85e5c020  SessionId: 1  Cid: 4668    Peb: 7ffd4000  ParentCid: 4a50
    DirBase: cffb7de0  ObjectTable: e11891d0  HandleCount: 172.
    Image: application.exe

PROCESS 85e51578  SessionId: 1  Cid: 4c9c    Peb: 7ffde000  ParentCid: 44c8
    DirBase: cffb7e40  ObjectTable: e2ee0070  HandleCount:  39.
    Image: application.exe

[...]

PROCESS 85c81020  SessionId: 1  Cid: 53a4    Peb: 7ffd7000  ParentCid: 44c8
    DirBase: cffb89c0  ObjectTable: e6d2f600  HandleCount:  39.
    Image: application.exe

PROCESS 85c6fb18  SessionId: 1  Cid: 53a8    Peb: 7ffd7000  ParentCid: 44c8
    DirBase: cffb89e0  ObjectTable: e54df078  HandleCount:  39.
    Image: application.exe

PROCESS 85c60020  SessionId: 1  Cid: 53bc    Peb: 7ffdf000  ParentCid: 44c8
    DirBase: cffb8a40  ObjectTable: e1214e90  HandleCount:  39.
    Image: application.exe

[...]

We can also see the very big number of handles in both csrss.exe and explorer.exe. If we look at one of 5,000 application.exe processes we would see that it is a GUI application and this explains session pool exhaustion:

1: kd> !process 85c60020 1f
PROCESS 85c60020  SessionId: 1  Cid: 53bc    Peb: 7ffdf000  ParentCid: 44c8
    DirBase: cffb8a40  ObjectTable: e1214e90  HandleCount:  39.
    Image: application.exe
    VadRoot 85c97450 Vads 80 Clone 0 Private 173. Modified 159. Locked 0.
    DeviceMap e3743340
    Token                             e2ead5e0
    ElapsedTime                       00:54:17.218
    UserTime                          00:00:00.015
    KernelTime                        00:00:00.000
    QuotaPoolUsage[PagedPool]         32460
    QuotaPoolUsage[NonPagedPool]      3200
    Working Set Sizes (now,min,max)  (30, 50, 345) (120KB, 200KB, 1380KB)
    PeakWorkingSetSize                778
    VirtualSize                       16 Mb
    PeakVirtualSize                   17 Mb
    PageFaultCount                    829
    MemoryPriority                    BACKGROUND
    BasePriority                      8
    CommitCharge                      212

THREAD 85c25db0  Cid 53bc.5470  Teb: 7ffde000 Win32Thread: bd1a18a8 WAIT: (Unknown) UserMode Non-Alertable
    85bbf2a8  SynchronizationEvent
Not impersonating
DeviceMap                 e3743340
Owning Process            85c60020       Image:         application.exe
Wait Start TickCount      1121133        Ticks: 206877 (0:00:53:52.453)
Context Switch Count      19355  NoStackSwap    LargeStack
UserTime                  00:00:00.015
KernelTime                00:00:00.000
Win32 Start Address application (0x00402a38)
Start Address kernel32!BaseProcessStartThunk (0x7c8217f8)
Stack Init ad2b8000 Current ad2b7b1c Base ad2b8000 Limit ad2b4000 Call 0
Priority 8 BasePriority 8 PriorityDecrement 0
ChildEBP RetAddr 
ad2b7b34 80833ec5 nt!KiSwapContext+0x26
ad2b7b60 80829bc0 nt!KiSwapThread+0x2e5
ad2b7ba8 bf89aacc nt!KeWaitForSingleObject+0x346
ad2b7c04 bf8c4816 win32k!xxxSleepThread+0×1be
ad2b7ca0 bf8a134f win32k!xxxInterSendMsgEx+0×798
ad2b7cec bf85ae3c win32k!xxxSendMessageTimeout+0×1f3
ad2b7d10 bf8c13dc win32k!xxxWrapSendMessage+0×1b
ad2b7d40 8088ad3c win32k!NtUserMessageCall+0×9d

ad2b7d40 7c9485ec nt!KiFastCallEntry+0xfc (TrapFrame @ ad2b7d64)
0012f814 00000000 ntdll!KiFastSystemCallRet

We also see extremely high executive resource contention and various signs of a busy system like the fact that all processors are busy and very high number of ready threads at normal priority (about 1,000):

1: kd> !locks
**** DUMP OF ALL RESOURCE OBJECTS ****

Resource @ DriverA (0xbae016a0)    Exclusively owned
    Contention Count = 277088870
    NumberOfExclusiveWaiters = 3591
     Threads: 83b46db0-01<*> << Too many exclusive waiters to list>>

1: kd> !running

System Processors ff (affinity mask)
  Idle Processors 0

     Prcb      Current   Next   
  0  ffdff120  86300b40            …………….
  1  f772f120  f77320a0  852fadb0  …………….
  2  f7737120  f773a0a0  861528d0  …………….
  3  f773f120  f77420a0  877a4020  …………….
  4  f7747120  f774a0a0  865909a8  …………….
  5  f774f120  f77520a0  83d62cd0  …………….
  6  f7757120  f775a0a0  841aa020  …………….
  7  f775f120  f77620a0  ffb7b5e0  …………….

1: kd> !ready
Processor 0: No threads in READY state
Processor 1: Ready Threads at priority 10
    THREAD 861b1898  Cid 4860.4894  Teb: 7ffd8000 Win32Thread: bc1669a8 READY
Processor 1: Ready Threads at priority 9
    THREAD 83b46db0  Cid 44c8.a11c  Teb: 7f8f8000 Win32Thread: bcbabb38 READY
Processor 1: Ready Threads at priority 8
    THREAD 851408d0  Cid 6338.6398  Teb: 7ffdf000 Win32Thread: bc9bfbb8 READY
    THREAD 83eb1730  Cid 8f30.9568  Teb: 7ffdf000 Win32Thread: 00000000 READY
    THREAD fd310af8  Cid d53c.b4d8  Teb: 7ffdf000 Win32Thread: 00000000 READY
    THREAD 83bce8d0  Cid abec.6450  Teb: 7ffdd000 Win32Thread: 00000000 READY
    THREAD 83de2388  Cid a618.d79c  Teb: 7ffde000 Win32Thread: 00000000 READY
    THREAD 84197b40  Cid 44c8.6974  Teb: 7fe6a000 Win32Thread: bc662d48 READY
[…]

Processor 1: Ready Threads at priority 7
    THREAD 86d0c890  Cid 3524.365c  Teb: 7ff8e000 Win32Thread: bc403bb0 READY
Processor 2: No threads in READY state
Processor 3: No threads in READY state
Processor 4: No threads in READY state
Processor 5: No threads in READY state
Processor 6: No threads in READY state
Processor 7: No threads in READY state

There is AnotherApp.exe in the session process list that executes a VBS script:  

1: kd> .process /r /p 86083020
Implicit process is now 86083020
Loading User Symbols

1: kd> !process 86083020
[...]

        THREAD 860b0db0  Cid 4560.4e4c  Teb: 7ffdd000 Win32Thread: bc1bf4d0 WAIT: (Unknown) KernelMode Non-Alertable
            860b0e28  NotificationTimer

1: kd> .thread 860b0db0
Implicit thread is now 860b0db0

1: kd> kv 100
ChildEBP RetAddr  Args to Child             
ae7ec76c 80833ec5 860b0db0 860b0ea0 00000000 nt!KiSwapContext+0x26
ae7ec798 80829069 0000001e 00000000 bae016a0 nt!KiSwapThread+0x2e5
ae7ec7e0 badff394 00000000 00000000 ffdff5f0 nt!KeDelayExecutionThread+0x2ab
[...]
0012f6ac 7c8024d5 00000000 00000000 00a43280 kernel32!CreateProcessInternalA+0x28b
0012f6e4 00401b31 00000000 00a43280 00000000 kernel32!CreateProcessA+0×2c
[…]

1: kd> da /c 100 00a43280
00a43280  “wscript.exe C:\Scripts\script.vbs parameters”

The examination of that script showed that it contained a coding error resulted in an infinite loop.

- Dmitry Vostokov @ DumpAnalysis.org -

Inverse Temperature Spike

February 16th, 2009

The first week in February was extremely cold in Ireland with sub-zero temperatures and snowfall. This culminated on Sunday, 8th with even more snowfall that I haven’t seen in Ireland for 8 years. I woke up that morning and everything outside my apartment was white so I went out to take a few pictures:

- Dmitry Vostokov @ DumpAnalysis.org

The Topos of Debugging

February 15th, 2009

An idea struck me today while I was walking in People’s Park near Dun Laoghaire to formalize various effective intuitive notions in memory dump analysis, debugging and troubleshooting using topos theory. More on this later.

- Dmitry Vostokov @ DumpAnalysis.org -

WDPF book gains value after being used

February 13th, 2009

Noticed today on Amazon that my book becomes more expensive after being used:

- Dmitry Vostokov @ DumpAnalysis.org -

Crash Dump Analysis Patterns (Part 80)

February 13th, 2009

I remember in my old days of PDP-11 system programming I learnt about the system call to spawn processes and wrote a program in assembly language that was spawning itself. This recursive spawning resulted in geometrical progression of running tasks and brought RSX-11M system to halt very quickly. Recently I observed the similar but non-recursive Process Factory pattern in one of memory dumps: explorer was relentlessly creating application.exe processes and at the time some effect was noticed there were more than 5,000 of them:

1: kd> !vm
[...]
5d20 application.exe 212 ( 848 Kb)
5d08 application.exe 212 ( 848 Kb)
5d04 application.exe 212 ( 848 Kb)
5cf8 application.exe 212 ( 848 Kb)
5cf0 application.exe 212 ( 848 Kb)
5ce8 application.exe 212 ( 848 Kb)
5cdc application.exe 212 ( 848 Kb)
5ccc application.exe 212 ( 848 Kb)
5cc8 application.exe 212 ( 848 Kb)
5cc0 application.exe 212 ( 848 Kb)
5ca8 application.exe 212 ( 848 Kb)
5c9c application.exe 212 ( 848 Kb)
5c98 application.exe 212 ( 848 Kb)
5c90 application.exe 212 ( 848 Kb)
5c88 application.exe 212 ( 848 Kb)
5c7c application.exe 212 ( 848 Kb)
5c70 application.exe 212 ( 848 Kb)
5c68 application.exe 212 ( 848 Kb)
5c64 application.exe 212 ( 848 Kb)
5c60 application.exe 212 ( 848 Kb)
5c50 application.exe 212 ( 848 Kb)
5c4c application.exe 212 ( 848 Kb)
5c44 application.exe 212 ( 848 Kb)
5c3c application.exe 212 ( 848 Kb)
5c34 application.exe 212 ( 848 Kb)
5c2c application.exe 212 ( 848 Kb)
5c24 application.exe 212 ( 848 Kb)
5c1c application.exe 212 ( 848 Kb)
5bf8 application.exe 212 ( 848 Kb)
5be0 application.exe 212 ( 848 Kb)
5bd4 application.exe 212 ( 848 Kb)
5bd0 application.exe 212 ( 848 Kb)
5ba4 application.exe 212 ( 848 Kb)
5b58 application.exe 212 ( 848 Kb)
5b50 application.exe 212 ( 848 Kb)
5b44 application.exe 212 ( 848 Kb)
5b38 application.exe 212 ( 848 Kb)
5b30 application.exe 212 ( 848 Kb)
5b04 application.exe 212 ( 848 Kb)
5af4 application.exe 212 ( 848 Kb)
5ad8 application.exe 212 ( 848 Kb)
5ad4 application.exe 212 ( 848 Kb)
5ac8 application.exe 212 ( 848 Kb)
5ac4 application.exe 212 ( 848 Kb)
5ab4 application.exe 212 ( 848 Kb)
5aa4 application.exe 212 ( 848 Kb)
5a9c application.exe 212 ( 848 Kb)
5a94 application.exe 212 ( 848 Kb)
5a8c application.exe 212 ( 848 Kb)
5a88 application.exe 212 ( 848 Kb)
5a74 application.exe 212 ( 848 Kb)
[...]

1: kd> !process 0 0
**** NT ACTIVE PROCESS DUMP ****
PROCESS 8b57f020  SessionId: none  Cid: 0004    Peb: 00000000  ParentCid: 0000
    DirBase: cffb3020  ObjectTable: e1003da0  HandleCount: 3932.
    Image: System

PROCESS 8a9f8d88  SessionId: none  Cid: 01b8    Peb: 7ffdf000  ParentCid: 0004
    DirBase: cffb3040  ObjectTable: e13e3f68  HandleCount: 111.
    Image: smss.exe

PROCESS 89f0d508  SessionId: 0  Cid: 01f0    Peb: 7ffd8000  ParentCid: 01b8
    DirBase: cffb3060  ObjectTable: e16bc370  HandleCount: 1292.
    Image: csrss.exe

PROCESS 89eea7c8  SessionId: 0  Cid: 0208    Peb: 7ffde000  ParentCid: 01b8
    DirBase: cffb3080  ObjectTable: e14b4160  HandleCount: 564.
    Image: winlogon.exe

[...]

PROCESS 8607c020  SessionId: 1  Cid: 44c8    Peb: 7ffdc000  ParentCid: 4cf8
    DirBase: cffb7080  ObjectTable: e3c9fd38  HandleCount: 25407.
    Image: explorer.exe

[...]

PROCESS 85e1d020  SessionId: 1  Cid: 538c    Peb: 7ffda000  ParentCid: 44c8
    DirBase: cffb8980  ObjectTable: e8065b20  HandleCount:  39.
    Image: application.exe

PROCESS 85c74610  SessionId: 1  Cid: 5394    Peb: 7ffd9000  ParentCid: 44c8
    DirBase: cffb89a0  ObjectTable: e6951878  HandleCount:  39.
    Image: application.exe

PROCESS 85c81020  SessionId: 1  Cid: 53a4    Peb: 7ffd7000  ParentCid: 44c8
    DirBase: cffb89c0  ObjectTable: e6d2f600  HandleCount:  39.
    Image: application.exe

PROCESS 85c6fb18  SessionId: 1  Cid: 53a8    Peb: 7ffd7000  ParentCid: 44c8
    DirBase: cffb89e0  ObjectTable: e54df078  HandleCount:  39.
    Image: application.exe

PROCESS 85c60020  SessionId: 1  Cid: 53bc    Peb: 7ffdf000  ParentCid: 44c8
    DirBase: cffb8a40  ObjectTable: e1214e90  HandleCount:  39.
    Image: application.exe

PROCESS 85c5d380  SessionId: 1  Cid: 53c8    Peb: 7ffde000  ParentCid: 44c8
    DirBase: cffb8a60  ObjectTable: e7baf638  HandleCount:  39.
    Image: application.exe

PROCESS 85c648b8  SessionId: 1  Cid: 53dc    Peb: 7ffde000  ParentCid: 44c8
    DirBase: cffb8a80  ObjectTable: e759d060  HandleCount:  39.
    Image: application.exe

PROCESS 85c62528  SessionId: 1  Cid: 53e0    Peb: 7ffde000  ParentCid: 44c8
    DirBase: cffb8aa0  ObjectTable: e3b8fa00  HandleCount:  39.
    Image: application.exe

PROCESS 85c59d88  SessionId: 1  Cid: 53e8    Peb: 7ffdc000  ParentCid: 44c8
    DirBase: cffb8ac0  ObjectTable: e31751e0  HandleCount:  39.
    Image: application.exe

PROCESS 85c46d88  SessionId: 1  Cid: 542c    Peb: 7ffd5000  ParentCid: 4d9c
    DirBase: cffb8b00  ObjectTable: e6fbc500  HandleCount: 136.
    Image: nlapplication.exe

PROCESS 85c3c020  SessionId: 1  Cid: 5464    Peb: 7ffdc000  ParentCid: 44c8
    DirBase: cffb8b40  ObjectTable: e218b948  HandleCount:  39.
    Image: application.exe

PROCESS 85c2a020  SessionId: 1  Cid: 546c    Peb: 7ffdb000  ParentCid: 44c8
    DirBase: cffb8b60  ObjectTable: e639a8d0  HandleCount:  39.
    Image: application.exe

PROCESS 85c202c8  SessionId: 1  Cid: 5474    Peb: 7ffd7000  ParentCid: 44c8
    DirBase: cffb8b80  ObjectTable: e517caa8  HandleCount:  39.
    Image: application.exe

PROCESS 85c1b020  SessionId: 1  Cid: 547c    Peb: 7ffd6000  ParentCid: 44c8
    DirBase: cffb8ba0  ObjectTable: e6c0cbc0  HandleCount:  39.
    Image: application.exe

PROCESS 85c1dd88  SessionId: 1  Cid: 5484    Peb: 7ffd5000  ParentCid: 44c8
    DirBase: cffb8bc0  ObjectTable: e4a42f68  HandleCount:  39.
    Image: application.exe

PROCESS 85d3ed88  SessionId: 1  Cid: 5488    Peb: 7ffd5000  ParentCid: 44c8
    DirBase: cffb8be0  ObjectTable: e68558f0  HandleCount:  39.
    Image: application.exe

[...]

We see that all created processes have the same parent process with PID 44c8 and when we inspect it we see many threads inside creating application.exe process:

1: kd> .process /r /p 8607c020
Implicit process is now 8607c020
Loading User Symbols

1: kd> !process 8607c020
PROCESS 8607c020  SessionId: 1  Cid: 44c8    Peb: 7ffdc000  ParentCid: 4cf8
    DirBase: cffb7080  ObjectTable: e3c9fd38  HandleCount: 25407.
    Image: explorer.exe
    VadRoot 88efec98 Vads 3445 Clone 0 Private 30423. Modified 71292. Locked 0.
    DeviceMap e3743340
    Token                             e29be5e0
    ElapsedTime                       00:54:31.359
    UserTime                          00:00:19.234
    KernelTime                        00:04:04.828
    QuotaPoolUsage[PagedPool]         1075132
    QuotaPoolUsage[NonPagedPool]      137800
    Working Set Sizes (now,min,max)  (15457, 50, 345) (61828KB, 200KB, 1380KB)
    PeakWorkingSetSize                48919
    VirtualSize                       585 Mb
    PeakVirtualSize                   978 Mb
    PageFaultCount                    123488
    MemoryPriority                    BACKGROUND
    BasePriority                      8
    CommitCharge                      49919

[...]

THREAD 84f25300  Cid 44c8.6288  Teb: 7ff8e000 Win32Thread: bc486830 READY
IRP List:
    88699110: (0006,0220) Flags: 00000884  Mdl: 00000000
Not impersonating
DeviceMap                 e3743340
Owning Process            8607c020       Image:         explorer.exe
Wait Start TickCount      1327981        Ticks: 29 (0:00:00:00.453)
Context Switch Count      145332                 LargeStack
UserTime                  00:00:00.000
KernelTime                00:00:00.093
Win32 Start Address SHLWAPI!SHCreateThread (0x77ec3ea5)
Start Address kernel32!BaseThreadStartThunk (0x7c8217ec)
Stack Init a98e4000 Current a98e3700 Base a98e4000 Limit a98e0000 Call 0
Priority 8 BasePriority 8 PriorityDecrement 0
ChildEBP RetAddr 
a98e3718 80833ec5 nt!KiSwapContext+0x26
a98e3744 80829bc0 nt!KiSwapThread+0x2e5
a98e378c 8087e0d8 nt!KeWaitForSingleObject+0x346
a98e37c4 8087e397 nt!ExpWaitForResource+0x30
a98e37e4 badff32a nt!ExAcquireResourceExclusiveLite+0x8d
a98e3808 badffe35 driverA+0x132a
a98e3824 bae00208 driverA+0x1e35
a98e3868 bae0e45a driverA+0x2208
a98e38a0 8081e095 driverA+0x1045a
a98e38b4 b972c73b nt!IofCallDriver+0x45
[...]
a98e38e8 b9b194e1 nt!IofCallDriver+0x45
[...]
a98e3940 b85cbf08 nt!IofCallDriver+0x45
a98e3968 b85bcfcc driverB!LowerDevicePassThrough+0x48
a98e398c b85bd63d driverB+0x6fcc
a98e3a24 b85cb167 driverB+0x763d
a98e3a34 b85cb1b7 driverB+0x15167
a98e3a5c 8081e095 driverB!DispatchPassThrough+0x48
a98e3a70 808fb13b nt!IofCallDriver+0x45
a98e3b58 80939c6a nt!IopParseDevice+0xa35
a98e3bd8 80935d9e nt!ObpLookupObjectName+0x5b0
a98e3c2c 808ece57 nt!ObOpenObjectByName+0xea
a98e3ca8 808ee0f1 nt!IopCreateFile+0x447
a98e3d04 808f1e31 nt!IoCreateFile+0xa3
a98e3d44 8088ad3c nt!NtOpenFile+0x27
a98e3d44 7c9485ec nt!KiFastCallEntry+0xfc (TrapFrame @ a98e3d64)
03bbda04 7c82bdf6 ntdll!KiFastSystemCallRet
03bbda2c 7c82dd9a kernel32!BasepSxsCreateStreams+0xe2
03bbda9c 7c82d895 kernel32!BasepSxsCreateProcessCsrMessage+0x136
03bbe2c4 7c8024a0 kernel32!CreateProcessInternalW+0x1943
03bbe2fc 7ca36750 kernel32!CreateProcessW+0×2c
03bbed80 7ca36b45 SHELL32!_SHCreateProcess+0×387
03bbedd4 7ca3617b SHELL32!CShellExecute::_DoExecCommand+0xb4
03bbede0 7ca35a76 SHELL32!CShellExecute::_TryInvokeApplication+0×49
03bbedf4 7ca3599f SHELL32!CShellExecute::ExecuteNormal+0xb1
03bbee08 7ca35933 SHELL32!ShellExecuteNormal+0×30
03bbee24 7ca452ff SHELL32!ShellExecuteExW+0×8d

1: kd> .thread 84e6a600
Implicit thread is now 84e6a600

1: kd> kv 100
[...]
03bbda04 7c82bdf6 001200a9 03bbda8c 03bbdb20 ntdll!KiFastSystemCallRet
03bbda2c 7c82dd9a 00000000 00000003 001200a9 kernel32!BasepSxsCreateStreams+0xe2
03bbda9c 7c82d895 00000000 00000000 03bbdc38 kernel32!BasepSxsCreateProcessCsrMessage+0x136
03bbe2c4 7c8024a0 00000000 01dafb9c 01dad904 kernel32!CreateProcessInternalW+0x1943
03bbe2fc 7ca36750 01dafb9c 01dad904 00000000 kernel32!CreateProcessW+0×2c
03bbed80 7ca36b45 00010098 00000000 01daffac SHELL32!_SHCreateProcess+0×387
[…]

1: kd> du /c 100 01dafb9c
01dafb9c  “C:\Program Files\App Package\Application.exe”

The difference of this pattern and similar Handle Leak or Zombie Processes is the fact that leaks usually happen when a process forgets to close handles but Process Factory creates active processes which are full resource containers and consume system resources, for example, they all have full handle table or consume GDI resources if they are GUI processes.

- Dmitry Vostokov @ DumpAnalysis.org -

Music for Debugging: Some Bugs Never Disappear

February 11th, 2009

If you complain about heap corruption again or type !locks every day and see pages of output filled with columns the following album from Supertramp reminds us that

Some Things Never Change

Here is my track name interpretation:

1. It’s a Buggy World
2. You Code, I Debug
3. Let’s Debug Together
4. Live to Debug It
5. Some Bugs Never Disappear
6. Read My Bug Report Please
7. Sooner or Later I Fix It
8. Help Me Down that Code Path
9. And the Customer
10. Il Est De Mon Bug!
11. Where There’s a Bug

- Dmitry Vostokov @ DumpAnalysis.org -

Stack trace collection, blocked thread and coupled processes: pattern cooperation

February 11th, 2009

This is a continuation of the story of a process hang simulation where I made all threads in IE7 instance frozen. I left that process frozen after my experiments and later tried to reply to one e-mail using PHP-based browser client running in another IE7 process. And I found that the mouse click on ”Reply” button didn’t bring out any GUI response. I tried to close IE7 instance: all tabs closed except the one that was hanging. So I dumped the process and found a blocking thread inside waiting for an RPC call. I made all threads in the first IE7 process unfrozen and the second hanging IE7 process immediately exited. Instead of digging into the dump further I decided to repeat the problem. First I launched the fresh instance of IE7 and opened my e-mail client. After clicking on “Reply” with success I dumped the process using Vista Task Manager and renamed the resulted memory dump as iexplore2.dmp. Then I launched another IE instance and made all threads frozen. Then I came back to the first instance of IE7 and tried to do ”Reply” again. After waiting for about 10 minutes for any response I dumped the process again and renamed the dump file as iexplore3.dmp. Comparing thread stack traces from both dump files showed one difference: the blocked OLE/RPC thread obviously processing some JavaScript code:

[Before hang]

0:000> ~[0n36]k 100
ChildEBP RetAddr 
161bfc00 76b60dde ntdll!KiFastSystemCallRet
161bfc04 705e41a1 user32!NtUserWaitMessage+0xc
161bfc68 76c24911 ieframe!CTabWindow::_TabWindowThreadProc+0x2d0
161bfc74 76fee4b6 kernel32!BaseThreadInitThunk+0xe
161bfcb4 76fee489 ntdll!__RtlUserThreadStart+0x23
161bfccc 00000000 ntdll!_RtlUserThreadStart+0x1b

[After hang]

0:000> ~[0n36]k 100
ChildEBP RetAddr 
WARNING: Stack unwind information not available. Following frames may be wrong.
161bc27c 76b60208 ntdll!KiFastSystemCallRet
161bc2d0 767fab28 user32!RealMsgWaitForMultipleObjectsEx+0x13c
161bc2f8 767fac88 ole32!CCliModalLoop::BlockFn+0×97
161bc320 76907b73 ole32!ModalLoop+0×5b
161bc33c 76908b68 ole32!ThreadSendReceive+0×12c
161bc364 769089d4 ole32!CRpcChannelBuffer::SwitchAptAndDispatchCall+0×194
161bc444 767fad2e ole32!CRpcChannelBuffer::SendReceive2+0xef
161bc460 767face0 ole32!CCliModalLoop::SendReceive+0×1e
161bc4d8 7681e688 ole32!CAptRpcChnl::SendReceive+0×73
161bc52c 7667264e ole32!CCtxComChnl::SendReceive+0×1c5
161bc544 766726af rpcrt4!NdrProxySendReceive+0×43
161bc9c8 76f3ad86 rpcrt4!NdrProxySendReceive+0xa4

161bc9e0 76f3ad58 oleaut32!IEnumVARIANT_RemoteNext_Proxy+0×19
161bc9fc 6c1f2a7b oleaut32!IEnumVARIANT_Next_Proxy+0×1c
161bca5c 6c1f2b9c mshtml!SearchBrowsersForWindow+0×1bd
161bca84 6c1a2932 mshtml!GetTargetWindow+0×53
161bcabc 6c1b1300 mshtml!CWindow::FindWindowByName+0xe1
161bcad4 706498d4 mshtml!CWindow::FindWindowByName+0×17
161bcaf4 70649e5a ieframe+0×1198d4
161bcb48 70649ff6 ieframe+0×119e5a
161bcbac 70649b82 ieframe+0×119ff6
161bcbe0 6c189f9b ieframe+0×119b82
161bcc10 6c119cba mshtml!COmWindowProxy::FindFrame+0×5c
161bcc44 6c18be8e mshtml!COmWindowProxy::AccessAllowedToFrame+0×7f
161bccb4 6c1c4a2e mshtml!COmWindowProxy::open+0×15b
161bcd1c 6c0371b6 mshtml!Method_IDispatchpp_oDoBSTR_oDoBSTR_oDoBSTR_oDoVARIANTBOOL+0xeb
161bcdb4 6c037493 mshtml!CBase::ContextInvokeEx+0×4ef
161bcde0 6c037607 mshtml!CBase::InvokeEx+0×25
161bce48 6c0374c2 mshtml!COmWindowProxy::InvokeEx+0×297
161bce70 6c5b348e mshtml!COmWindowProxy::subInvokeEx+0×26
161bcea8 6c5b33fe jscript!IDispatchExInvokeEx2+0xac
161bcee0 6c5b3e09 jscript!IDispatchExInvokeEx+0×56
161bcf50 6c5b30eb jscript!InvokeDispatchEx+0×78
161bcf98 6c5b18ab jscript!VAR::InvokeByName+0xba
161bcfd8 6c5b2109 jscript!VAR::InvokeDispName+0×43
161bcffc 6c5b28d8 jscript!VAR::InvokeByDispID+0xb9
161bd0b4 6c5b1019 jscript!CScriptRuntime::Run+0×167f
161bd0cc 6c5b2aa8 jscript!ScrFncObj::Call+0×8d
161bd158 6c5b00f2 jscript!NameTbl::InvokeInternal+0xe0
161bd184 6c5b28d8 jscript!VAR::InvokeByDispID+0xfd
161bd23c 6c5b1019 jscript!CScriptRuntime::Run+0×167f
161bd254 6c5b1b7f jscript!ScrFncObj::Call+0×8d
161bd2c4 6c59f9d2 jscript!CSession::Execute+0xa7
161bd314 6c59fdf7 jscript!COleScript::ExecutePendingScripts+0×147
161bd378 6c59fc46 jscript!COleScript::ParseScriptTextCore+0×243
161bd3a4 6bfcca36 jscript!COleScript::ParseScriptText+0×2b

161bd404 6c1b1931 mshtml!CScriptCollection::ParseScriptText+0×240
161bf48c 6c12adae mshtml!CWindow::ExecuteScriptUri+0×197
161bf4cc 6c1b2f77 mshtml!CWindow::NavigateEx+0×50
161bf530 6c1b3372 mshtml!CDoc::ExecuteScriptUri+0×1f7
161bf560 6c27b8ac mshtml!CDoc::ExecuteScriptURL+0×4b
161bf5a8 6c27a54c mshtml!CHyperlink::ClickAction+0×1a9
161bf5b8 6c121847 mshtml!CAnchorElement::ClickAction+0×10
161bf5e4 6c07a7ef mshtml!CElement::DoClick+0×121
161bf610 6c07a5bd mshtml!CAnchorElement::DoClick+0×4d
161bf69c 6c07f680 mshtml!CDoc::PumpMessage+0xcbd
161bf7e8 6c12a7e0 mshtml!CDoc::OnMouseMessage+0×3d7
161bf90c 6c039a11 mshtml!CDoc::OnWindowMessage+0×8f7
161bf938 76b5f8d2 mshtml!CServer::WndProc+0×78
161bf964 76b5f794 user32!InternalCallWinProc+0×23
161bf9dc 76b606f6 user32!UserCallWinProcCheckWow+0×14b
161bfa0c 76b6069c user32!CallWindowProcAorW+0×97
161bfa2c 6baad980 user32!CallWindowProcW+0×1b
161bfa98 6baa104a GoogleToolbarDynamic_F423308312A7B033+0×3d980
161bfabc 6bb67e57 GoogleToolbarDynamic_F423308312A7B033+0×3104a
161bfae8 76b5f8d2 GoogleToolbarDynamic_F423308312A7B033+0xf7e57
161bfb14 76b5f794 user32!InternalCallWinProc+0×23
161bfb8c 76b60008 user32!UserCallWinProcCheckWow+0×14b
161bfbf0 76b60060 user32!DispatchMessageWorker+0×322
161bfc00 705e42c1 user32!DispatchMessageW+0xf
161bfc68 76c24911 ieframe+0xb42c1
161bfc74 76fee4b6 kernel32!BaseThreadInitThunk+0xe

Upon seeing SendReceive2 on the latter stack trace I recalled that it is possible to know the target process PID: In Search of Lost CID. The same procedure applied here reveals PID = 0xdec:

0:000> ~[0n36]kv 9
ChildEBP RetAddr  Args to Child             
WARNING: Stack unwind information not available. Following frames may be wrong.
161bc27c 76b60208 161bc230 161bc2a4 00000000 ntdll!KiFastSystemCallRet
161bc2d0 767fab28 00000000 161bc318 00000000 user32!RealMsgWaitForMultipleObjectsEx+0x13c
161bc2f8 767fac88 161bc318 00000000 161bc328 ole32!CCliModalLoop::BlockFn+0x97
161bc320 76907b73 00000000 00000000 161bc42c ole32!ModalLoop+0x5b
161bc33c 76908b68 00000000 161bc440 00000000 ole32!ThreadSendReceive+0x12c
161bc364 769089d4 161bc42c 00000000 161bc488 ole32!CRpcChannelBuffer::SwitchAptAndDispatchCall+0x194
161bc444 767fad2e 14f75040 161bc56c 161bc550 ole32!CRpcChannelBuffer::SendReceive2+0xef
161bc460 767face0 161bc56c 161bc550 00000000 ole32!CCliModalLoop::SendReceive+0×1e
161bc4d8 7681e688 14f75040 161bc56c 161bc550 ole32!CAptRpcChnl::SendReceive+0×73

Note: 14f75040 is 00000000 in iexplore3.dmp from ftp because the dumps were stripped from almost all process data and contain only values necessary to reconstruct stack traces. So you won’t be able to extract correct raw stack data from them.

0:000> ddp 14f75040
14f75040  76828438 76907c77 ole32!CRpcChannelBuffer::QueryInterface
14f75044  7681c7e4 7689b57c ole32!CRpcChannelBuffer::QueryInterface
14f75048  00000003
14f7504c  00000002
14f75050  00000000
14f75054  00000000
14f75058  0046ccd0 0046ce50
14f7505c  0e8de858 00000000
14f75060  1acb7310 00000044
14f75064  1acb3130 76828510 ole32!CStdIdentity::`vftable’
14f75068  7682b098 767f8066 ole32!CDestObject::QueryInterface
14f7506c  00070005 ee0100ed
14f75070  00000000
14f75074  00000000
14f75078  00000d78
14f7507c  00000000
14f75080  76828438 76907c77 ole32!CRpcChannelBuffer::QueryInterface
14f75084  7681c7e4 7689b57c ole32!CRpcChannelBuffer::QueryInterface
14f75088  00000001
14f7508c  00000024
14f75090  00000000
14f75094  00000000
14f75098  07abd4a8 07aacab0
14f7509c  00000000
14f750a0  00000000
14f750a4  1ae12b10 76828510 ole32!CStdIdentity::`vftable’
14f750a8  7682b098 767f8066 ole32!CDestObject::QueryInterface
14f750ac  00070005 ee0100ed
14f750b0  ffffffff
14f750b4  00001134
14f750b8  00001134
14f750bc  00000000

0:000> dd 0046ccd0 l4
0046ccd0  0046ce50 0046cc50 00000dec 00000000

In Task Manager I found this to be ieuser.exe process so I suspect there is a high degree of process coupling between all launched IE7 processes and ieuser.exe including COM/OLE runtime.

The stripped versions of dumps are available for practice on ftp:

ftp://dumpanalysis.org/pub/ie7_pattern_cooperation2.zip

- Dmitry Vostokov @ DumpAnalysis.org -

How to Read Math Textbooks

February 10th, 2009

If you are interested in mathematical ideas or want to learn serious math you can skip proofs when reading various math textbooks. My speed of math book processing greatly increased after I started to skip proofs of lemmas and theorems. The slow progress through proofs inhibited my reading advance in the past. Even professional mathematicians confess after a few beers how slow they are as Thomas Garrity mentioned in the preface to his book All the Mathematics You Missed. I found that it is more important is to read several books on the same subject to see different explanations and more examples than to concentrate on a one book. By skipping proofs I can now read 2-3 more books in the same amount of time.

- Dmitry Vostokov @ DumpAnalysis.org -

Geometrical Debugging (Part 1)

February 10th, 2009

Most of (if not all) debugging is arithmetical. Here I would like to introduce a new kind of debugging and troubleshooting approach that interprets observables as objects in their own spaces, for example, the possible space of various GUI forms. These spaces are not necessarily rational-valued spaces of simulation output or discreet arithmetic spaces of memory locations and values.

This geometrical approach applies modeling and systems theory to debugging and troubleshooting by treating them as mappings (or functions in the case of one-to-one or many-to-one mappings) from the space of all possible software environment states (SE) to the space(s) of observables. Here we have a family of mappings to different spaces:

fi: SE → SOi

Some observables can be found fixed like the list of components and the number of mappings can be reduced (i < j):

fj: SEa,b,c,d,… → SOj

In every system and its environment we have something fixed as parameters (a, b, c, d, …) and this could be the list of components as high level ”genotype” or it could be just specific code (low-level “genotype”), specific data or hardware specification. The whole family of mappings become parametrized. If we want, we can reduce mappings even more to treat them as many-valued (one-to-many or many-to-many) if several observables belong to the same kind of space. 

Let me illustrate this by an analogy with modeling of a natural system. The system to be modeled is a falling ball together with its environment (Earth). The system obviously has some internal structure (abstract space of states, E) but we don’t know it. Fortunately, we can observe some measurable values like the ball position at any time (Q). So we have these mappings for balls with different masses:

fm: E → Q

We also find that for any individual ball its mass doesn’t change so we abstract it as a parameter:

f: Em → Q

The same modeling approach can be applied to a software system be it an application or a service running inside an operating system or a software system itself running inside a hardware. The case of pure software system abstracted from hardware is simple. In such a case SE space theoretically could be the space of abstract memory dumps. Practically we deal with the space of observables (universal memory dumps) that approximate SE and spaces of software “phenotypes”, observable behaviour, like distorted GUI, for example, or measured values of memory and CPU consumption or disk I/O throughput. 

- Dmitry Vostokov @ DumpAnalysis.org -

WDPF book is available on Amazon

February 10th, 2009

The book is available for ordering from Amazon with a significant discount:

Windows Debugging: Practical Foundations

Buy from Amazon

Although listed as temporarily out of stock at the time of this writing it should appear in stock in a few days. Search Inside is also enabled.

- Dmitry Vostokov @ DumpAnalysis.org -