August 6th, 2009
The hierarchy of Ψ1, …, Ψ8, …, Ψ16, …, Ψ32, …, Ψ64, …, …, …, ΨΨ numbers where the subscript denotes the number of bits a memory address can have, so Ψ32 and Ψ64 are memorillion and quadrimemorillion of memory dumps respectively. We only need to figure out the meaning of Ψ0 and ΨΨ. Perhaps there is some meaning in Dirac notation here: <Ψ0|ΨΨ>. More on this later because I have to finish this week the book x64 Windows Debugging: Practical Foundations and write an errata file for the previous x86 version of the book series.
Note: Ψ is an M upside down.
- Dmitry Vostokov @ DumpAnalysis.org -
Posted in Crash Dump Analysis, Crash Dump Patterns, Fun with Crash Dumps, Futuristic Memory Dump Analysis, Intelligent Memory Movement, Psi-computation, Science of Memory Dump Analysis | No Comments »
August 6th, 2009
There is an obvious pattern called Missing Component. We don’t see trace statements we expect and wonder whether the component was not loaded, its container ceased to exist or simply it wasn’t selected for tracing. In many support cases there is a trade-off between tracing everything and the size of trace files. Customers and engineers usually prefer smaller files to analyze. However in the case of predictable and reproducible issues with short duration we can always select all components or deselect a few (instead of selecting a few). Here is the article for Citrix CDF tracing best practices and it can be applied to other software traces as well:
Tracing Best Practices
We can find an example from Discontinuity pattern where the possibility of a sudden and silent gap in trace statements could happen because not all necessary components were selected for tracing.
Sometimes, in cases when the missing component was selected for tracing but we don’t see any trace output from it other module traces can give us an indication, perhaps showing the load failure message. For example, Process Monitor tracing done in parallel can reveal load failures.
- Dmitry Vostokov @ TraceAnalysis.org -
Posted in CDF Analysis Tips and Tricks, Citrix, Debugging, Software Trace Analysis, Trace Analysis Patterns | 4 Comments »
August 4th, 2009
Sometimes there are reported delays in application startup, session initialization, long response times and simply the absence of response. All these problems can be reflected in software traces showing sudden gaps in threads of activity. I call this pattern Discontinuity per analogy with continuous and discontinuous functions in mathematics. Here is an example I came upon recently and it will be covered fully in the forthcoming pattern cooperation case study spanning both memory dump and trace analysis. One process was reported to have a long period of CPU spiking calculation and a CDF trace was recorded. When we open it we see this periodic error:
N   PID  TID  Time         Message

[…]

326 2592 5476 08:17:18.823 OpenRegistry: Attempting to open [… Hive path …]

327 2592 5476 08:17:18.824 OpenRegistry: Failed: 2

[…]
However when looking for any discontinuities for the thread 5476 we see this gap of more than 7 minutes:
N    PID  TID  Time         Message

[...]

3395 2592 5476 08:17:19.608 OpenRegistry: Attempting to open [... Hive path ...]

3396 2592 5476 08:17:19.608 OpenRegistry: Failed: 2

3461 2592 5476 08:24:31.137 OpenRegistry: Attempting to open [… Hive path …]

3462 2592 5476 08:24:31.137 OpenRegistry: Failed: 2

[…]
Therefore we have 3 possibilities here:
1. The process twice did lengthy CPU spiking calculations involving registry access and was quiet between them.
2. Registry access belonged to some background activity and ceased for 7 minutes and during that time it had CPU spiking intensive calculation.
3. This discontinuity is irrelevant because either the calculation module was not selected for tracing or it simply doesn’t have relevant tracing statement coverage for the code that does calculation.
Stay tuned because this story will be unfolded in other patterns and in the final case study.
- Dmitry Vostokov @ TraceAnalysis.org -
Posted in CDF Analysis Tips and Tricks, Debugging, Software Trace Analysis, Trace Analysis Patterns | 2 Comments »
August 4th, 2009
OpenTask plans to expand its Practical Foundations series and publish the following 2 books for the forthcoming Memory Dump Analysis Fundamentals certification (Unix track) being developed by Memory Analysis and Debugging Institute:
Linux, FreeBSD and Mac OS X Debugging: Practical Foundations (ISBN: 978-1906717773)
64-bit Linux, FreeBSD and Mac OS X Debugging: Practical Foundations (ISBN: 978-1906717780)
- Dmitry Vostokov @ DumpAnalysis.org -
Posted in Announcements, Assembly Language, Books, Certification, Crash Dump Analysis, Debugging, Education and Research, FreeBSD Crash Corner, GDB for WinDbg Users, Linux Crash Corner, Mac Crash Corner, Memory Dump Analysis Jobs, Publishing, Software Engineering, Software Technical Support, Testing, Tools, Training and Seminars | No Comments »
August 3rd, 2009
When we have software traces that record process identifiers (PID) and thread identifiers (TID) it is important to differentiate between trace statements sorted by time and by Thread of Activity. The latter is simply the flow of trace messages sorted by TID and it is very helpful in cases with dense traces coming from hundreds of processes and components. Here is an example from MessageHistory bulk trace fragment showing different threads of activity in different colors:
Start time: 21:5:36:651

Format time: 21:5:43:133

Number of messages sent: 24736

Number of messages posted: 905
[...]

21:5:41:990 S PID: a7c TID: 554 HWND: 0×0000000000010E62  Class: “ToolbarWindow32″ Title: “” WM_USER+4b (0×44b) wParam: 0×14 lParam: 0×749e300

21:5:41:990 S PID: a7c TID: 554 HWND: 0×00010E4A  Class: “CtrlNotifySink” Title: “” WM_NOTIFY (0×4e) wParam: 0×0 lParam: 0×749efa8

21:5:41:990 S PID: a7c TID: 554 HWND: 0×00010E62  Class: “ToolbarWindow32″ Title: “” WM_USER+3f (0×43f) wParam: 0×14 lParam: 0×749e1e0

21:5:41:990 S PID: a7c TID: 554 HWND: 0×00010E62  Class: “ToolbarWindow32″ Title: “” WM_USER+4b (0×44b) wParam: 0×14 lParam: 0×749e300

21:5:41:990 S PID: a7c TID: 554 HWND: 0×00010E62  Class: “ToolbarWindow32″ Title: “” WM_USER+19 (0×419) wParam: 0×14 lParam: 0×0

21:5:41:990 S PID: a7c TID: 554 HWND: 0×00010E62  Class: “ToolbarWindow32″ Title: “” WM_USER+61 (0×461) wParam: 0×6 lParam: 0×0

21:5:41:990 S PID: a7c TID: 554 HWND: 0×00010E62  Class: “ToolbarWindow32″ Title: “” WM_USER+56 (0×456) wParam: 0×0 lParam: 0×0

21:5:41:990 S PID: a7c TID: 554 HWND: 0×00010E4A  Class: “CtrlNotifySink” Title: “” WM_NOTIFY (0×4e) wParam: 0×0 lParam: 0×749f290

21:5:41:990 S PID: a7c TID: 554 HWND: 0×000E04A8  Class: “CtrlNotifySink” Title: “” WM_NCPAINT (0×85) wParam: 0xffffffffcc043bdb lParam: 0×0

21:5:41:990 P PID: a7c TID: 554 HWND: 0×000E04A8  Class: “CtrlNotifySink” Title: “” WM_PAINT (0xf) wParam: 0×0 lParam: 0×0

21:5:42:007 S PID: 1a8 TID: 660 HWND: 0×0001003C  Class: “CiceroUIWndFrame” Title: “TF_FloatingLangBar_WndTitle” WM_WINDOWPOSCHANGING (0×46) wParam: 0×0 lParam: 0×29af030

21:5:42:007 P PID: a7c TID: 9b4 HWND: 0×00010084  Class: “CiceroUIWndFrame” Title: “TF_FloatingLangBar_WndTitle” WM_TIMER (0×113) wParam: 0×6 lParam: 0×0

21:5:42:007 P PID: 1a8 TID: 660 HWND: 0×0001003C  Class: “CiceroUIWndFrame” Title: “TF_FloatingLangBar_WndTitle” WM_TIMER (0×113) wParam: 0×8 lParam: 0×0

21:5:42:007 P PID: a7c TID: 9b4 HWND: 0×00010084  Class: “CiceroUIWndFrame” Title: “TF_FloatingLangBar_WndTitle” WM_TIMER (0×113) wParam: 0×9 lParam: 0×0

21:5:42:022 P PID: a7c TID: a28 HWND: 0×0001061A  Class: “WPDShServiceObject” Title: “WPDShServiceObject_WND” WM_TIMER (0×113) wParam: 0xd lParam: 0×0

21:5:42:022 P PID: a7c TID: 9b4 HWND: 0×00010084  Class: “CiceroUIWndFrame” Title: “TF_FloatingLangBar_WndTitle” WM_TIMER (0×113) wParam: 0×8 lParam: 0×0

21:5:42:022 P PID: a7c TID: 9b4 HWND: 0×00010084  Class: “CiceroUIWndFrame” Title: “TF_FloatingLangBar_WndTitle” WM_PAINT (0xf) wParam: 0×0 lParam: 0×0

21:5:42:036 P PID: 1a8 TID: 660 HWND: 0×0001003C  Class: “CiceroUIWndFrame” Title: “TF_FloatingLangBar_WndTitle” WM_TIMER (0×113) wParam: 0×5 lParam: 0×0

21:5:42:054 S PID: a7c TID: 9b4 HWND: 0×0001006C  Class: “ReBarWindow32″ Title: “” WM_USER+10 (0×410) wParam: 0×2 lParam: 0×0

21:5:42:054 S PID: a7c TID: 9b4 HWND: 0×0001006C  Class: “ReBarWindow32″ Title: “” WM_USER+18 (0×418) wParam: 0×2 lParam: 0×1041a

21:5:42:054 S PID: a7c TID: 9b4 HWND: 0×0001006C  Class: “ReBarWindow32″ Title: “” WM_USER+1a (0×41a) wParam: 0×0 lParam: 0×1041c

21:5:42:054 S PID: a7c TID: 9b4 HWND: 0×0001006C  Class: “ReBarWindow32″ Title: “” WM_USER+19 (0×419) wParam: 0×0 lParam: 0×0

21:5:42:054 S PID: a7c TID: 9b4 HWND: 0×00010084  Class: “CiceroUIWndFrame” Title: “TF_FloatingLangBar_WndTitle” WM_WINDOWPOSCHANGING (0×46) wParam: 0×0 lParam: 0×2bef960

21:5:42:054 P PID: a7c TID: 9b4 HWND: 0×00010084  Class: “CiceroUIWndFrame” Title: “TF_FloatingLangBar_WndTitle” WM_TIMER (0×113) wParam: 0×10 lParam: 0×0

21:5:42:054 P PID: a7c TID: 9b4 HWND: 0×00010084  Class: “CiceroUIWndFrame” Title: “TF_FloatingLangBar_WndTitle” WM_TIMER (0×113) wParam: 0×5 lParam: 0×0

21:5:42:074 S PID: a7c TID: 554 HWND: 0×00010E32  Class: “DirectUIHWND” Title: “” WM_NCHITTEST (0×84) wParam: 0×0 lParam: 0×640406

21:5:42:074 S PID: a7c TID: 554 HWND: 0×00010E30  Class: “DUIViewWndClassName” Title: “” WM_NCHITTEST (0×84) wParam: 0×0 lParam: 0×640406

21:5:42:074 S PID: a7c TID: 554 HWND: 0×00010E32  Class: “DirectUIHWND” Title: “” WM_SETCURSOR (0×20) wParam: 0×10e32 lParam: 0×2000001

21:5:42:074 S PID: a7c TID: 554 HWND: 0×00010E30  Class: “DUIViewWndClassName” Title: “” WM_SETCURSOR (0×20) wParam: 0×10e32 lParam: 0×2000001

21:5:42:074 S PID: a7c TID: 554 HWND: 0×00010E20  Class: “ShellTabWindowClass” Title: “Release” WM_SETCURSOR

[…]
Ususally when we see an error indication we select its current thread of activity and investigate what happened in this process and thread before. Here is a synthesised example from real CDF traces:
No     PID  TID  Time         Message

[...]

165797 4280 5696 07:07:23.709 FreeToken Handle 00000000

165798 4660 7948 07:07:23.709 EnumProcesses failed. Error=-2144534527

165799 7984 6216 07:07:23.749 GetData threw exception

165800 7984 6216 07:07:23.750 === Begin Exception Dump ===

[…]
We see the error and sort by TID 7948 to see what happened before and get additional information like server name:
No     PID  TID  Time         Message

[...]

165223 4660 7948 07:07:23.704 GetServerName: Exit. ServerName = SERVER02

165224 4660 7948 07:07:23.704 GetServerProcesses: ServerName is SERVER02

165798 4660 7948 07:07:23.709 EnumProcesses failed. Error=-2144534527

[…]
- Dmitry Vostokov @ TraceAnalysis.org -
Posted in CDF Analysis Tips and Tricks, Debugging, Software Trace Analysis, Trace Analysis Patterns | 3 Comments »
July 31st, 2009
Mark Russinovich and Bryce Cogswell published a graphical virtual memory visualization tool: VMMap. Since more and more tools appear I attempted to classify them into 2 major categories or memory views they can provide:
1. Traditional or synthetic memory visualization tools: show derived characteristics, like colors or computed values and graphs, from memory ranges.
2. Natural memory visualization tools: treat memory as a bitmap but can also include image annotations. Image annotation was one of my main interests when I worked at Accusoft (now Accusoft Pegasus) a decade ago.
- Dmitry Vostokov @ DumpAnalysis.org -
Posted in Debugging, Memory Visualization, Tools | 1 Comment »
July 31st, 2009
Centralized IT Ready In Xen
- Dmitry Vostokov @ DumpAnalysis.org -
Posted in Citrix, New Acronyms | No Comments »
July 30th, 2009
I got an Amazon voucher yesterday and finally after an hour of consideration recalled that I was planning to buy this book but saved in my cart previously:
Elements of Programming (by Alexander Stepanov and Paul McJones)

And so it happened I bought it. STL and meta-programming was (and perhaps still is) one of my favourite libraries and paradigms (correspondingly) and I was really excited when I saw C++-like templates during Search Inside. It is good to see that hardcore C++ books come back after some period of silence. Looking forward to reading and posting a review afterwards. I also see that Bjarne Stroustrup posted a review (the only one on Amazon by this moment and looking at his profile I see that he likes Chinese detective stories (his wish list). After reading another review that mentioned the fact that Stepanov recommends massive An Elementary Text-Book of Algebra by George Chrystal. So I bought 2 volumes of it too from Amazon Canada (the cheapest courier shipment for me, arriving tomorrow).
- Dmitry Vostokov @ DumpAnalysis.org -
Posted in Books, C and C++, Computer Science | No Comments »
July 29th, 2009
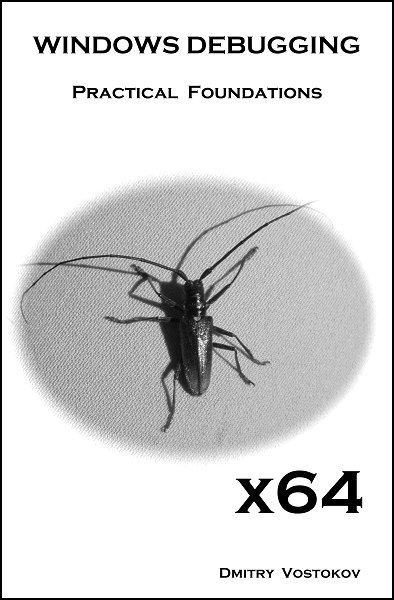
Here is the front cover for the forthcoming book X64 Windows Debugging: Practical Foundations (ISBN: 978-1906717568):
- Dmitry Vostokov @ DumpAnalysis.org -
Posted in Announcements, Books, Crash Dump Analysis, Debugging, Publishing | No Comments »
July 29th, 2009
Often analysis of software traces starts with searching for short textual patterns, like a failure or an exception code or simply the word “exception”. And indeed, some software components are able to record their own exceptions or exceptions that were propagated to them including full stack traces. This is all common in .NET and Java environments. Here is a synthetic and beautified example based on real software traces:
N      PID  TID  Message

[...]

265799 8984 4216 ComponentA.Store.GetData threw exception: ‘System.Reflection.TargetInvocationException: DCOM connection to server failed with error: ‘Exception from HRESULT: 0×842D0001′ —> System.Runtime.InteropServices.COMException (0×842D0001): Exception from HRESULT: 0×842D0001

   at ComponentA.GetData(Byte[] pKey)

   at System.RuntimeMethodHandle._InvokeMethodFast(Object target, Object[] arguments, SignatureStruct& sig, MethodAttributes methodAttributes, RuntimeTypeHandle typeOwner)

   at System.RuntimeMethodHandle.InvokeMethodFast(Object target, Object[] arguments, Signature sig, MethodAttributes methodAttributes, RuntimeTypeHandle typeOwner)

   at System.Reflection.RuntimeMethodInfo.Invoke(Object obj, BindingFlags invokeAttr, Binder binder, Object[] parameters, CultureInfo culture, Boolean skipVisibilityChecks)

   at System.Reflection.RuntimeMethodInfo.Invoke(Object obj, BindingFlags invokeAttr, Binder binder, Object[] parameters, CultureInfo culture)

   at ComponentB.Connections.ComInterfaceProxy.Invoke(IMessage message)’

265800 8984 4216 === Begin Exception Dump ===

265801 8984 4216 ComponentB.Exceptions.ConnectionException: DCOM connection to server failed with error: ‘Exception from HRESULT: 0×842D0001′ —> System.Runtime.InteropServices.COMException (0×842D0001): Exception from HRESULT: 0×842D0001

265802 8984 4216 at ComponentA.Store.GetData(Byte[] pKey)

[…]

265808 8984 4216 Exception rethrown at [0]:

265809 8984 4216 at System.Runtime.Remoting.Proxies.RealProxy.HandleReturnMessage(IMessage reqMsg, IMessage retMsg)

265810 8984 4216 at System.Runtime.Remoting.Proxies.RealProxy.PrivateInvoke(MessageData& msgData, Int32 type)

265811 8984 4216 at ComponentA.Store.GetData(Byte[] pKey)

265812 8984 4216 at ComponentA.App.EnumBusinessObjects()

[…]

265816 8984 4216 ===> InnerException:

265817 8984 4216 ** COM Exception Error Code: 0×842d0001

265818 8984 4216 System.Runtime.InteropServices.COMException (0×842D0001): Exception from HRESULT: 0×842D0001

265819 8984 4216 at ComponentA.Store.GetData(Byte[] pKey)

265820 8984 4216 === End Exception Dump ===

[…]
In the embedded stack trace we see that App object was trying to enumerate business objects and asked Store object to get some data and the latter object was probably trying to communicate to the real data store via DCOM. The communication attempt failed with HRESULT.
- Dmitry Vostokov @ TraceAnalysis.org -
Posted in .NET Debugging, CDF Analysis Tips and Tricks, Citrix, Debugging, Software Trace Analysis, Trace Analysis Patterns | 2 Comments »
July 28th, 2009
Here is another addition to identification of memory dumps coming from VMWare, VirtualPC and Xen Server virtualized Windows systems. Now I had a look at Windows Server 2008 Hyper-V host system running Windows Server 2008 as a guest and found that this information could serve as an identification if infrastructure components were installed:
kd> lm

[...]

fffffa60`00cc2000 fffffa60`00cd7000   winhv       (deferred)

fffff960`00810000 fffff960`0081b000   VMBusVideoD (deferred)

fffffa60`00c7e000 fffffa60`00cc2000   vmbus       (deferred)

fffffa60`00df6000 fffffa60`00dfbb00   VMBusHID    (deferred)

fffffa60`0201c000 fffffa60`02028000   VMBusVideoM (deferred)

[...]
winhv driver has lots of exported hypervisor related functions:
kd> x winhv!*

*** ERROR: Symbol file could not be found.  Defaulted to export symbols for winhv.sys -

fffffa60`00cc3100 winhv!WinHvGetCurrentVpIndex (<no parameter info>)

fffffa60`00cc3160 winhv!WinHvSetSintOnCurrentProcessor (<no parameter info>)

fffffa60`00cc3230 winhv!WinHvNtProcessorToVpIndex (<no parameter info>)

fffffa60`00cc3260 winhv!WinHvDisconnectPort (<no parameter info>)

fffffa60`00cc32e0 winhv!WinHvDeletePort (<no parameter info>)

fffffa60`00cc35c0 winhv!WinHvMapGpaPages (<no parameter info>)

fffffa60`00cc36e0 winhv!WinHvSetVpRegisters (<no parameter info>)

fffffa60`00cc3e20 winhv!WinHvGetVpRegisters (<no parameter info>)

fffffa60`00cc3ed0 winhv!WinHvLowMemoryPolicyAutoDeposit (<no parameter info>)

fffffa60`00cc4110 winhv!WinHvSetPartitionProperty (<no parameter info>)

fffffa60`00cc4250 winhv!WinHvGetPartitionProperty (<no parameter info>)

fffffa60`00cc4290 winhv!WinHvPostMessage (<no parameter info>)

fffffa60`00cc4320 winhv!WinHvCreatePort (<no parameter info>)

fffffa60`00cc4380 winhv!WinHvConnectPort (<no parameter info>)

fffffa60`00cc43e0 winhv!WinHvCreateVp (<no parameter info>)

fffffa60`00cc4430 winhv!WinHvMapEventLogBuffer (<no parameter info>)

fffffa60`00cc44d0 winhv!WinHvCreateEventLogBuffer (<no parameter info>)

fffffa60`00cc4580 winhv!WinHvGetPartitionId (<no parameter info>)

fffffa60`00cc45d0 winhv!WinHvWithdrawAllMemory (<no parameter info>)

fffffa60`00cc4600 winhv!WinHvReleaseEventLogBuffer (<no parameter info>)

fffffa60`00cc4630 winhv!WinHvCreatePartition (<no parameter info>)

fffffa60`00cc49d0 winhv!WinHvDeletePartition (<no parameter info>)

fffffa60`00cc4f50 winhv!WinHvUnmapGpaPages (<no parameter info>)

fffffa60`00cc5150 winhv!WinHvInstallIntercept (<no parameter info>)

fffffa60`00cc5240 winhv!WinHvInitializeEventLogBufferGroup (<no parameter info>)

fffffa60`00cc52c0 winhv!WinHvDeleteVp (<no parameter info>)

fffffa60`00cc5340 winhv!WinHvGetPortProperty (<no parameter info>)

fffffa60`00cc53a0 winhv!WinHvSetEventLogGroupSources (<no parameter info>)

fffffa60`00cc55a0 winhv!WinHvOnInterrupt (<no parameter info>)

fffffa60`00cc5870 winhv!WinHvCancelTimer (<no parameter info>)

fffffa60`00cc5a20 winhv!WinHvSetAbsoluteTimer (<no parameter info>)

fffffa60`00cc5b40 winhv!WinHvSetEventLogCompletedNotificationRoutine (<no parameter info>)

fffffa60`00cc5b50 winhv!WinHvQueryInterceptIrql (<no parameter info>)

fffffa60`00cc5b60 winhv!WinHvGetSintMessage (<no parameter info>)

fffffa60`00cc5b90 winhv!WinHvAllocatePartitionSintIndex (<no parameter info>)

fffffa60`00cc5d60 winhv!WinHvClearVirtualInterrupt (<no parameter info>)

fffffa60`00cc5db0 winhv!WinHvFlushEventLogBuffer (<no parameter info>)

fffffa60`00cc5e10 winhv!WinHvQueryReferenceCounter (<no parameter info>)

fffffa60`00cc5e50 winhv!WinHvSignalEvent (<no parameter info>)

fffffa60`00cc5ea0 winhv!WinHvWriteGpa (<no parameter info>)

fffffa60`00cc5fb0 winhv!WinHvReadGpa (<no parameter info>)

fffffa60`00cc60c0 winhv!WinHvTranslateVirtualAddress (<no parameter info>)

fffffa60`00cc61a0 winhv!WinHvAssertVirtualInterrupt (<no parameter info>)

fffffa60`00cc6240 winhv!WinHvGetSintEventFlags (<no parameter info>)

fffffa60`00cc6e90 winhv!WinHvIsCompatibleServicedHypervisorImplementation (<no parameter info>)

fffffa60`00cc6e90 winhv!WinHvIsCompatibleServicedDriverImplementation (<no parameter info>)

fffffa60`00cc6e90 winhv!WinHvIsCompatibleHypervisorImplementation (<no parameter info>)

fffffa60`00cc6e90 winhv!WinHvIsCompatibleDriverImplementation (<no parameter info>)

fffffa60`00cc6ea0 winhv!WinHvLookupPortId (<no parameter info>)

fffffa60`00cc6ee0 winhv!WinHvLowMemoryPolicyRaiseException (<no parameter info>)

fffffa60`00cc6f90 winhv!WinHvLowMemoryPolicyReturnStatus (<no parameter info>)

fffffa60`00cc7070 winhv!WinHvQueryFeaturesState (<no parameter info>)

fffffa60`00cc71f0 winhv!WinHvDeleteEventLogBuffer (<no parameter info>)

fffffa60`00cc7220 winhv!WinHvUnmapEventLogBuffer (<no parameter info>)

fffffa60`00cc7250 winhv!WinHvFinalizeEventLogBufferGroup (<no parameter info>)

fffffa60`00cc7310 winhv!WinHvSetEndOfMessage (<no parameter info>)

fffffa60`00cc7340 winhv!WinHvAllocateSingleSintIndex (<no parameter info>)

fffffa60`00cc7530 winhv!WinHvClearLogicalProcessorRunTimeGroup (<no parameter info>)

fffffa60`00cc7560 winhv!WinHvSetLogicalProcessorRunTimeGroup (<no parameter info>)

fffffa60`00cc7740 winhv!WinHvGetMemoryBalance (<no parameter info>)

fffffa60`00cc77a0 winhv!WinHvGetLogicalProcessorRunTime (<no parameter info>)

fffffa60`00cc7830 winhv!WinHvGetNextChildPartition (<no parameter info>)

fffffa60`00ccf0e0 winhv!WinHvReportPresentHypervisor (<no parameter info>)

fffffa60`00ccf400 winhv!WinHvSetSint (<no parameter info>)

fffffa60`00ccf5b0 winhv!WinHvMapStatsPage (<no parameter info>)

fffffa60`00ccfa90 winhv!WinHvWithdrawMemory (<no parameter info>)

fffffa60`00ccfc80 winhv!WinHvDepositMemory (<no parameter info>)

fffffa60`00ccfd80 winhv!WinHvAllocatePortId (<no parameter info>)

fffffa60`00ccfff0 winhv!WinHvUnmapStatsPage (<no parameter info>)

fffffa60`00cd02d0 winhv!WinHvDeleteTimer (<no parameter info>)

fffffa60`00cd02f0 winhv!WinHvCreateTimer (<no parameter info>)

fffffa60`00cd0360 winhv!WinHvFreePortId (<no parameter info>)

fffffa60`00cd03c0 winhv!WinHvSupplyInterruptVector (<no parameter info>)

fffffa60`00cd0a80 winhv!WinHvAdjustFeaturesState (<no parameter info>)

fffffa60`00cd0aa0 winhv!WinHvQueryFeatureInformation (<no parameter info>)

fffffa60`00cd0ab0 winhv!WinHvGetIdentifierString (<no parameter info>)

fffffa60`00cd0bd0 winhv!WinHvFreeSingleSintIndex (<no parameter info>)

fffffa60`00cd0c20 winhv!WinHvFreePartitionSintIndex (<no parameter info>)

fffffa60`00cd0dd0 winhv!DllUnload (<no parameter info>)

fffffa60`00cd0f30 winhv!WinHvReclaimInterruptVector (<no parameter info>)

fffffa60`00cd1030 winhv!WinHvRestorePartitionState (<no parameter info>)

fffffa60`00cd1170 winhv!WinHvSavePartitionState (<no parameter info>)

fffffa60`00cd3050 winhv!DllInitialize (<no parameter info>)

fffffa60`00cd3990 winhv!DriverEntry (<no parameter info>)
If we have a clean virtualized guest without any tools installed then we can rely on hardware information:
kd> !sysinfo machineid

Machine ID Information [From Smbios 2.3, DMIVersion 35, Size=3752]

BiosVendor = American Megatrends Inc.

BiosVersion = 080002

BiosReleaseDate = 05/05/2008

SystemManufacturer = Microsoft Corporation

SystemProductName = Virtual Machine

SystemVersion = 5.0

BaseBoardManufacturer = Microsoft Corporation

BaseBoardProduct = Virtual Machine

BaseBoardVersion = 5.0
- Dmitry Vostokov @ DumpAnalysis.org -
Posted in Crash Dump Analysis, Hyper-V, Virtualization, Windows Server 2008 | 1 Comment »
July 27th, 2009
We have the following crash pointing to Driver.sys
7: kd> KL

Child-SP          RetAddr           Call Site

fffffadd`7671a678 fffff800`0102e5f4 nt!KeBugCheckEx

fffffadd`7671a680 fffff800`0102d587 nt!KiBugCheckDispatch+0x74

fffffadd`7671a800 fffffadd`88e5dbf3 nt!KiPageFault+0x207

fffffadd`7671a998 fffffadd`88df63f5 Driver!memcpy+0×83

fffffadd`7671a9a0 fffffadd`88dfe97b Driver!ItemCopyTo+0×85

fffffadd`7671a9e0 fffffadd`88e45bd1 Driver!CallbackEx+0×3cb

fffffadd`7671aa80 fffffadd`88dfb130 Driver!Callback+0×131

fffffadd`7671ab90 fffffadd`88dfaef3 Driver!Reply+0×1a0

fffffadd`7671ac40 fffffadd`88de9e23 Driver!OnDataReceive+0×1a3

fffffadd`7671acc0 fffff800`0124e932 Driver!ReaderThread+0×553

fffffadd`7671ad70 fffff800`010202b6 nt!PspSystemThreadStartup+0×3e

fffffadd`7671add0 00000000`00000000 nt!KxStartSystemThread+0×16
7: kd> !analyze -v

[...]

DRIVER_IRQL_NOT_LESS_OR_EQUAL (d1)

An attempt was made to access a pageable (or completely invalid) address at an interrupt request level (IRQL) that is too high.  This is usually caused by drivers using improper addresses. If kernel debugger is available get stack backtrace.

Arguments:

Arg1: 0000000000000007, memory referenced

Arg2: 0000000000000002, IRQL

Arg3: 0000000000000001, value 0 = read operation, 1 = write operation

Arg4: fffffadd88e5dbf3, address which referenced memory

[...]

TRAP_FRAME:  fffffadd7671a800 -- (.trap 0xfffffadd7671a800)

[...]
7: kd> .trap 0xfffffadd7671a800

[...]

NOTE: The trap frame does not contain all registers.

Some register values may be zeroed or incorrect
7: kd> r

Last set context:

rax=0000000000001000 rbx=0000000000000000 rcx=0000000000000007

rdx=fffffadda17d001d rsi=0000000000000000 rdi=0000000000000000

rip=fffffadd88e5dbf3 rsp=fffffadd7671a998 rbp=0000000000000001

 r8=0000000000000001  r9=fffffadda254f2f0 r10=0000000000000000

r11=0000000000000007 r12=0000000000000000 r13=0000000000000000

r14=0000000000000000 r15=0000000000000000

iopl=0 nv up ei pl nz na pe nc

cs=0010 ss=0018 ds=0006 es=0000 fs=fadf gs=ffff efl=00010202

Driver!memcpy+0×83:

fffffadd`88e5dbf3 8801  mov byte ptr [rcx],al ds:0006:0007=??
.trap warning above perhaps explains why we have non-standard values in ds, fs and gs. Typical expected values in kernel mode are these (ds is ignored in 64-bit mode anyway):
cs=0010 ss=0018 ds=002b es=002b fs=0053 gs=002b efl=00010202
7: kd> kL

Child-SP          RetAddr           Call Site

fffffadd`7671a998 fffffadd`88df63f5 Driver!memcpy+0×83

fffffadd`7671a9a0 fffffadd`88dfe97b Driver!ItemCopyTo+0×85

fffffadd`7671a9e0 fffffadd`88e45bd1 Driver!CallbackEx+0×3cb

fffffadd`7671aa80 fffffadd`88dfb130 Driver!Callback+0×131

fffffadd`7671ab90 fffffadd`88dfaef3 Driver!Reply+0×1a0

fffffadd`7671ac40 fffffadd`88de9e23 Driver!OnDataReceive+0×1a3

fffffadd`7671acc0 fffff800`0124e932 Driver!ReaderThread+0×553

fffffadd`7671ad70 fffff800`010202b6 nt!PspSystemThreadStartup+0×3e

fffffadd`7671add0 00000000`00000000 nt!KxStartSystemThread+0×16
We clearly have an instance of a NULL pointer data access. If we try to match this stack trace to known faults in database we would probably find many entries because memcpy is a generic function from C library. So we should try with ItemCopyTo. Indeed, we find a few matches but with slightly different stack traces:
b7535c7c b75931fa Driver!ItemCopyTo+0×6a

b7535ca4 b75c24c4 Driver!CallbackEx+0×23a

b7535d04 b7590c79 Driver!Callback+0xd4

b7535d44 b7590b41 Driver!Reply+0xe9

b7535d68 b7584b87 Driver!OnDataReceive+0×111

b7535dac 8094bea4 Driver!ReaderThread+0×397

b7535ddc 8088f61e nt!PspSystemThreadStartup+0×2e

00000000 00000000 nt!KiThreadStartup+0×16
Offsets are different but the function names are the same. We also don’t see memcpy call but if we look at the faulted instruction we suspect it was inlined memcpy call:
eax=88642870 ebx=00000005 ecx=00000001 edx=00000005 esi=88f3f9a4 edi=00000029

eip=b758d3ca esp=b7535c6c ebp=b7535c7c iopl=0 nv up ei pl nz ac po nc

cs=0008 ss=0010 ds=0023 es=0023 fs=0030 gs=0000 efl=00010212

Driver!ItemCopyTo+0×6a:

b758d3ca f3a5  rep movs dword ptr es:[edi],dword ptr [esi]
We also notice that the found stack trace is from x86 32-bit Windows but ours is from x64 Windows so we suspect the platformorphic fault here and check if we have a fix for x64 binaries.
- Dmitry Vostokov @ DumpAnalysis.org -
Posted in Crash Dump Analysis, Crash Dump Patterns | No Comments »
July 27th, 2009
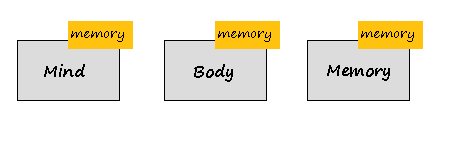
If memory is the basis of everything we might think that memoidealism is a kind of dual aspect monism or plural aspect monism, where mind, body and perhaps many other aspects are manifestations of one single memory substance. Or perhaps, memory is the same as matter or the realm of ideas (materialism or some sort of idealism), and memoidealism is the kind of monism. Or memory is the same or not the same as mind or matter and can be associated with one side of dualism. Not at all, memory is the aspect or attribute of mind, body and other substances, possibly itself. This can be illustrated on the following picture:
If there are only 2 substances then we have monistic aspect dualism as an extension of monism, for example, the extension of idealism:

or the extension of materialism (memuonic theory, memuonics):

Therefore, Memory is a substance and an aspect (attribute) at the same time. This is the essence of MAP (Monistic Aspect Pluralism).
- Dmitry Vostokov @ DumpAnalysis.org -
Posted in Memoidealism, Memuonics, New Acronyms, Philosophy, Science of Memory Dump Analysis | 3 Comments »
July 26th, 2009
Paraphrasing “Knowing about knowing about knowing” (Side-box 0.1, Consciousness, David Rose) as “Knowing about knowing about problem solving”, I would suggest the following references to raise the level of awareness from meta-troubleshooting and meta-debugging, the subject of various general purpose debugging books to the next epistemic level. I’m currently reading the following books and let you know about my progress along the journey:
Toward a Unified Theory of Problem Solving: Views From the Content Domains

The Psychology of Problem Solving

The Cambridge Handbook of Expertise and Expert Performance

- Dmitry Vostokov @ DumpAnalysis.org -
Posted in Books, Crash Dump Analysis, Debugging, Education and Research, Software Technical Support, Troubleshooting Methodology | No Comments »
July 25th, 2009
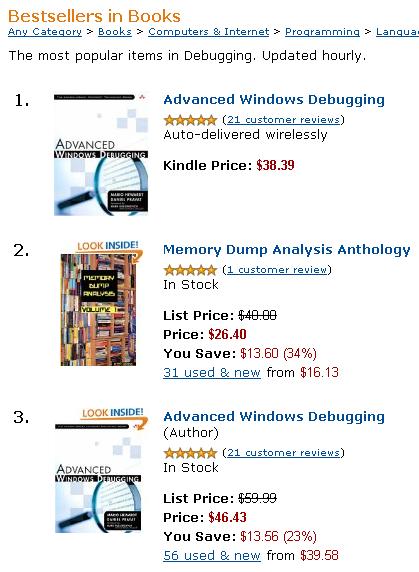
Noticed today that it is still one of the top bestselling debugging books on Amazon:
- Dmitry Vostokov @ DumpAnalysis.org -
Posted in Announcements, Books, Crash Dump Analysis, Debugging, Publishing | No Comments »
July 24th, 2009
One of the authors of June Debugged! MZ/PE issue, Kapildev Ramlal, published a short article about XCode debugging of multithreaded deadlocks and a few GDB commands:
Episode 1 of XCode iPhone Debugging Adventures
- Dmitry Vostokov @ DumpAnalysis.org -
Posted in Debugging, GDB for WinDbg Users, Mac Crash Corner | No Comments »
July 23rd, 2009
Finally the issue is available on Amazon and through other sellers:
Debugged! MZ/PE: Modeling Software Defects

I’m now planning the September issue and post details later.
- Dmitry Vostokov @ DumpAnalysis.org -
Posted in Announcements, Books, Certification, Citrix, Crash Dump Analysis, Debugged! MZ/PE, Debugging, Education and Research, Publishing, Software Defect Construction, Software Engineering, Software Technical Support, Testing, Tools, Training and Seminars, Troubleshooting Methodology, WinDbg Tips and Tricks | No Comments »
July 23rd, 2009
Jamie Fenton has finally made available for beta testing fantastic memory visualization system HayWire & Barn Burner I use often for mining curious pictures from virtual memory space, like “cosmic rays“. Besides providing artistic pleasure, real-time natural memory visualization can have other applications including visual debugging. Looking forward to seeing more wonders in this area of research!
- Dmitry Vostokov @ DumpAnalysis.org -
Posted in Announcements, Crash Dump Analysis, Debugging, Education and Research, Fun with Crash Dumps, Futuristic Memory Dump Analysis, Memory Visualization, Tools | 2 Comments »