Registry Corruption: A Case Study

August 17th, 2009

A friend of mine couldn’t start Windows XP on his notebook. As soon as he entered his credentials in a logon window the system experienced a BSOD event. He booted from another media and collected mini-dumps. All of them were consistent in resisting to my attempts to load symbols and modules. Even explicit downloading the symbol package from Microsoft didn’t help. All bugcheck info and stack traces were like this pointing to pool corruption:

0: kd> !analyze -v
[...]
BAD_POOL_CALLER (c2)
The current thread is making a bad pool request. Typically this is at a bad IRQL level or double freeing the same allocation, etc.
Arguments:
Arg1: 00000043, Attempt to free a virtual address which was never in any pool
Arg2: c9c00000, Address being freed.
Arg3: 00000000, 0
Arg4: 00000000, 0
[...]

1: kd> kv 100
ChildEBP RetAddr  Args to Child             
WARNING: Stack unwind information not available. Following frames may be wrong.
f6cc09e4 80548c2d 000000c2 00000043 c9c00000 nt+0x22f43
f6cc0a24 8054b49a c9c00000 e2039410 e23fd000 nt+0x71c2d
f6cc0a64 8063bf19 c9c00000 00000000 f6cc0ad0 nt+0x7449a
f6cc0a74 8063eb20 c9c00000 00002000 00000000 nt+0x164f19
f6cc0ad0 8063ef05 e1f6e008 00000000 00000000 nt+0x167b20
f6cc0b1c 8063087e e1f6e008 00000000 00000001 nt+0x167f05
f6cc0b34 806383a9 e1f6e101 00000005 00000000 nt+0x15987e
f6cc0ba0 80625bf9 f6cc0bdc 00000005 00000000 nt+0x1613a9
f6cc0bf8 8062ad8b f6cc0d04 00000000 f6cc0c64 nt+0x14ebf9
f6cc0c20 80631f24 f6cc0ccc f6cc0c6c f6cc0c5c nt+0x153d8b
f6cc0cac 806257b4 f6cc0ce4 f6cc0ccc 00000000 nt+0x15af24
f6cc0d40 806259be 0006dcc4 0006dcac 00000000 nt+0x14e7b4
f6cc0d54 8054162c 0006dcc4 0006dcac 0006dcf0 nt+0x14e9be
f6cc0d64 7c91e514 badb0d00 0006dc98 00000000 nt+0x6a62c
f6cc0d68 badb0d00 0006dc98 00000000 00000000 0x7c91e514
f6cc0d6c 0006dc98 00000000 00000000 00000090 0xbadb0d00
f6cc0d70 00000000 00000000 00000090 000000a4 0x6dc98

Portions of raw stack data available in minidump didn’t have any traces of other modules and drivers except nt:

1: kd> !thread
GetPointerFromAddress: unable to read from 80562134
[...]
86485da8: Unable to get thread contents

1: kd> dps f6cc09cc-3000 f6cc09cc+3000
[...]
f6cc095c  ????????
f6cc0960  ????????
f6cc0964  ????????
f6cc0968  00000000
f6cc096c  00000000
f6cc0970  003d0058
f6cc0974  f6cc09a8
f6cc0978  00000000
f6cc097c  0000c000
f6cc0980  00000000
f6cc0984  00000000
f6cc0988  8648b4d8
f6cc098c  863eb240
f6cc0990  00000000
f6cc0994  01ffffff
f6cc0998  f6cc093c
f6cc099c  00000000
f6cc09a0  f6cc0a14
f6cc09a4  80539ac0 nt+0x62ac0
f6cc09a8  804d8228 nt+0x1228
f6cc09ac  ffffffff
f6cc09b0  00000002
f6cc09b4  80506653 nt+0x2f653
f6cc09b8  f78a9548
f6cc09bc  c9c00000
f6cc09c0  0000bb40
[...]
f6cc0fcc  00000000
f6cc0fd0  00000000
f6cc0fd4  00000000
f6cc0fd8  00000000
f6cc0fdc  00000000
f6cc0fe0  7c91d5aa
f6cc0fe4  7c940574
f6cc0fe8  0015fd80
f6cc0fec  00100020
f6cc0ff0  00000000
f6cc0ff4  00000000
f6cc0ff8  00000000
f6cc0ffc  00000000
f6cc1000  ????????
f6cc1004  ????????
f6cc1008  ????????
[...]

So I advised to give me a kernel dump and fortunately there was one available too. It was more amenable for analysis and showed the involvement of registry:

0: kd> kv 100
ChildEBP RetAddr  Args to Child             
f690a9e4 80548c2d 000000c2 00000043 dcf40000 nt!KeBugCheckEx+0x1b
f690aa24 8054b49a dcf40000 e1294410 e17c6000 nt!MiFreePoolPages+0x8b
f690aa64 8063bf19 dcf40000 00000000 f690aad0 nt!ExFreePoolWithTag+0x1ba
f690aa74 8063eb20 dcf40000 00002000 00000000 nt!CmpFree+0×17
f690aad0 8063ef05 e11c4b60 00000000 00000000 nt!HvpRecoverData+0×3ec
f690ab1c 8063087e e11c4b60 00000000 00000001 nt!HvMapHive+0×133
f690ab34 806383a9 e11c4c01 00000005 00000000 nt!HvInitializeHive+0×416
f690aba0 80625bf9 f690abdc 00000005 00000000 nt!CmpInitializeHive+0×26d
f690abf8 8062ad8b f690ad04 00000000 f690ac64 nt!CmpInitHiveFromFile+0xa3
f690ac20 80631f24 f690accc f690ac6c f690ac5c nt!CmpCmdHiveOpen+0×21
f690acac 806257b4 f690ace4 f690accc 00000000 nt!CmLoadKey+0×90
f690ad40 806259be 0006dcc4 0006dcac 00000000 nt!NtLoadKey2+0×1fc
f690ad54 8054162c 0006dcc4 0006dcac 0006dcf0 nt!NtLoadKey+0×12

f690ad54 7c91e514 0006dcc4 0006dcac 0006dcf0 nt!KiFastCallEntry+0xfc
WARNING: Frame IP not in any known module. Following frames may be wrong.
0006dcf0 00000000 00000000 00000000 00000000 0×7c91e514

Examination of parameters on raw stack pointed to a user hive for MyFriend user:

0: kd> dpu f690ace4
f690ace4  00000018
f690ace8  80000ce0
f690acec  f690ad0c “Z\..(”
f690acf0  00000240
f690acf4  00000000
f690acf8  00000000
f690acfc  00660066
f690ad00  00eddea0
f690ad04  00660066
f690ad08  e10b1e60 “\??\C:\Documents and Settings\MyFriend\ntuser.dat”
f690ad14  00000028
[…]

So the solution was to log as Administrator and recreate the user.

- Dmitry Vostokov @ DumpAnalysis.org -

x64 WDPF book is available on Amazon

August 16th, 2009

Finally the book came through the publishing process and is available on Amazon and other bookstores:

x64 Windows Debugging: Practical Foundations

Buy from Amazon

- Dmitry Vostokov @ DumpAnalysis.org -

3 Years of Blogging!

August 14th, 2009

Today I celebrate 3 years of blogging that resulted in 1,430 posts across 8 blogs. I would like to thank everyone for their continuing support!

The updated timeline

This blog post belongs to the 4th year of blogging. 

- Dmitry Vostokov @ DumpAnalysis.org -

Assembling code in WinDbg

August 13th, 2009

I was recently asked why the following code used byte ptr modifier for MOV instruction when assigning a number to a memory location pointed to by a register:

C/C++ code:

int a;
int *pa = &a;

void foo()
{
    __asm
    {
        // ...
        mov eax,   [pa]
        mov [eax], 1
        // ...
    }
}

Generated x86 assembly language code:

0:000:x86> uf foo
[...]
0042d64e c60001 mov byte ptr [eax],1
[…]

It looks like by default Visual C++ inline assembler treats MOV as “byte ptr” because it doesn’t know about C or C++ language semantics. Originally I thought that was the sign of a code optimization because the resulted binary code is smaller than the one generated by dword ptr. In order to check that I used a WinDbg command:

0:000> a
77067dfe mov dword ptr [eax], 1
mov dword ptr [eax], 1
77067e04

0:000> u 77067dfe
ntdll!DbgBreakPoint:
77067dfe c70001000000    mov     dword ptr [eax],1
77067e04 0c8b            or      al,8Bh
77067e06 54              push    esp
77067e07 2408            and     al,8
77067e09 c70200000000    mov     dword ptr [edx],0
77067e0f 897a04          mov     dword ptr [edx+4],edi
77067e12 0bff            or      edi,edi
77067e14 741e            je      ntdll!RtlInitString+0×34 (77067e34)

This could be possible because the variable “a” is global, initialized to 0 during the program startup, so it is safe to change just one byte. If “a” was a local variable (on stack) than other 3 bytes of DWORD could contain garbage from the previously used stack memory. However, I noticed that the program was compiled as Debug target with all optimization turned off. If Visual C++ compiler was used it should have assumed that the variable “a” could have been referenced from other compilation units and no longer contained 0 before the assignment in foo function. I recreated the same code in C/C++, built the new Debug executable, and indeed, it used dword ptr instead of byte ptr as expected from C/C++ semantics.

- Dmitry Vostokov @ DumpAnalysis.org -

The Debugging Verses (1)

August 13th, 2009

Studying poetry and reading books about Stalin certainly influenced this first verse:

Welcome, Doctor DebugLove!
Your name, pronounced, fixes bugs!

- Dmitry Vostokov @ DumpAnalysis.org -

Forthcoming Advanced .NET Debugging book

August 12th, 2009

Pre-ordered today on Amazon this forthcoming book:

Advanced .NET Debugging (Addison-Wesley Microsoft Technology Series)

Buy from Amazon

I was able to find TOC on InformIt. Looking forward to reading it. .NET crash dump (mixed managed and unmanaged code) and software trace analysis is a sizable part of my day-to-day activities.

When ordering I recalled that I’m was also working on a .NET debugging and memory dump analysis book:

Unmanaged Code: Escaping the Matrix of .NET

but I had to postpone it due to other commitments. It is now planned for the next year after I accumulate more material and real-world case studies.

Taking the opportunity, I also created a category .NET Debugging where I put some old blog posts and patterns related to managed code.

- Dmitry Vostokov @ DumpAnalysis.org -

Einstein’s Mistakes

August 12th, 2009

I finished reading Dirac’s biography The Strangest Man 3 months ago and started to read this book. Its title intrigued me when I was browsing recent physics releases on Amazon and I bought it. It looks to me like the mix of brief biographical notes with explanation of physical theories. Here learning from mistakes undoubtedly helps to understand special and general relativity better. I also liked the short and clear explanation of EPR paradox in just one page, “revisionist” and unusual biographical notes on other scientists and their faults, like Galileo and Newton, and notes about Einstein’s private life. This makes him really human (he was like an ideal scientist from Plato Universe for me before). When I was reading Not Even Wrong and the Trouble With Physics books I thought of the possible “yellow press physics” (which is not bad, and doesn’t mean bad quality for me, I like to read yellow press sometimes and listen to pop music) and one day, at lunch, when reading about Newton madness and other peculiar character traits I thought about “yellow press physics” again. Was the choice of this book hardcover and jacket colors (yellow) made deliberate? Anyway, while approaching the end of the book and reading about how Einstein wasted 20-30 years on his idée fixe unified theories I immediately recalled String Theory, and indeed, the author voiced the same thoughts a few moments later when I turned a page over. I also liked the discussion on how General Relativity might have been discovered if it wasn’t formulated by Einstein. The author tells us that it would have been done via a QFT route. Einstein has fallen in my eyes, and now, after reading this book, he is not quite the hero of science like I imagined before. Nevertheless, his stature from McDonald’s is still on my shelves.

Einstein’s Mistakes: The Human Failings of Genius
Buy from Amazon

I don’t want to repeat Einstein’s mistakes… 

- Dmitry Vostokov @ LiterateScientist.com -

RADII Process Illustrated

August 12th, 2009

Previously introduced RADII software development process acquires definite shape as a product supportability driven software support tools development process. In summary, supportability of a product gives rise to Requirements, they expand into Architecture segments, then into Design segments, then into Implementation segments, and finally, into several Improvement phases. In short, RADII:

Every segment is a separate troubleshooting or debugging tool. All segments share elements of RADII via DebugWare patterns and can be further refined via iterative and incremental SDLC if needed.

- Dmitry Vostokov @ DumpAnalysis.org -

Stack trace collection, suspended threads, not my version, special process, main thread and blocked LPC chain threads: pattern cooperation

August 11th, 2009

It was reported that one server was hanging during automated reboot. Stack trace collection shows a few suspended and frozen threads. They all belong to the same process, ServiceA:

PROCESS 8545eb18  SessionId: 0  Cid: 0fec    Peb: 7ffd4000  ParentCid: 0fdc
    DirBase: 3fbeb8e0  ObjectTable: e19dd1d0  HandleCount: 169.
    Image: ServiceA.exe

THREAD 859cc900  Cid 0fec.0ff0  Teb: 7ffdf000 Win32Thread: bc1738d0 WAIT: (Unknown) KernelMode Non-Alertable
SuspendCount 1
FreezeCount 1

       859cca90  Semaphore Limit 0×2

THREAD 858c6480  Cid 0fec.0ff4  Teb: 7ffde000 Win32Thread: bc178c40 WAIT: (Unknown) KernelMode Non-Alertable
SuspendCount 1
       f55747d8  SynchronizationEvent

THREAD 859f2338  Cid 0fec.0ff8  Teb: 7ffdd000 Win32Thread: 00000000 WAIT: (Unknown) KernelMode Non-Alertable
SuspendCount 1
FreezeCount 1

       859f24c8  Semaphore Limit 0×2

THREAD 859be2b8  Cid 0fec.0ffc  Teb: 7ffdc000 Win32Thread: bc1915d8 WAIT: (Unknown) KernelMode Non-Alertable
SuspendCount 1
FreezeCount 1

       859be448  Semaphore Limit 0×2

[...]

When zooming into this process we see that one thread was processing an exception:

0: kd> .process /r /p 8545eb18
Implicit process is now 8545eb18
Loading User Symbols

0: kd> !process 8545eb18
[...]
THREAD 858c6480  Cid 0fec.0ff4  Teb: 7ffde000 Win32Thread: bc178c40 WAIT: (Unknown) KernelMode Non-Alertable
SuspendCount 1
    f55747d8  SynchronizationEvent
Not impersonating
DeviceMap                 e10008e8
Owning Process            8545eb18       Image:         ServiceA.exe
Attached Process          N/A            Image:         N/A
Wait Start TickCount      6927           Ticks: 89866 (0:00:23:24.156)
Context Switch Count      156                 LargeStack
UserTime                  00:00:00.031
KernelTime                00:00:00.000
Win32 Start Address 0x611054cb
Start Address kernel32!BaseThreadStartThunk (0x7c8217ec)
Stack Init f5575000 Current f557471c Base f5575000 Limit f5571000 Call 0
Priority 10 BasePriority 8 PriorityDecrement 0
ChildEBP RetAddr 
f5574734 80833ec5 nt!KiSwapContext+0x26
f5574760 80829c14 nt!KiSwapThread+0x2e5
f55747a8 809a25c8 nt!KeWaitForSingleObject+0x346
f5574888 809a3739 nt!DbgkpQueueMessage+0x178
f55748ac 809a386e nt!DbgkpSendApiMessage+0x45
f5574938 8082d7ec nt!DbgkForwardException+0x90
f5574cf4 8088bed2 nt!KiDispatchException+0×1ea
f5574d5c 8088be86 nt!CommonDispatchException+0×4a
f5574da0 7c829c3a nt!Kei386EoiHelper+0×186
f5574dd0 00000000 kernel32!LoadResource+0×5d

We zoom into its parameters in search of semantically consistent output of .exr, .cxr and .trap commands:

0: kd> .thread 858c6480
Implicit thread is now 858c6480

0: kd> kv 100
ChildEBP RetAddr  Args to Child             
f5574734 80833ec5 858c6480 858c6528 00000200 nt!KiSwapContext+0x26
f5574760 80829c14 00000000 858c6480 f55747d0 nt!KiSwapThread+0x2e5
f55747a8 809a25c8 f55747d8 00000000 00000000 nt!KeWaitForSingleObject+0x346
f5574888 809a3739 8545eb18 00000000 f55748c0 nt!DbgkpQueueMessage+0x178
f55748ac 809a386e f55748c0 00000001 f5574d64 nt!DbgkpSendApiMessage+0x45
f5574938 8082d7ec f5574d10 00000001 00000000 nt!DbgkForwardException+0x90
f5574cf4 8088bed2 f5574d10 00000000 f5574d64nt!KiDispatchException+0×1ea
f5574d5c 8088be86 005bf4b4 61213267 badb0d00 nt!CommonDispatchException+0×4a
f5574da0 7c829c3a 71c22898 00000001 ffffffff nt!Kei386EoiHelper+0×186
f5574dd0 00000000 005bf448 00000023 00000000 kernel32!LoadResource+0×5d

After probing parameters for KiDispatchException we get these results pointing to ModuleA:

0: kd> .exr f5574d10
ExceptionAddress: 61213267 (ModuleA!GetData+0×0000b57f)
   ExceptionCode: c0000005 (Access violation)
  ExceptionFlags: 00000000
NumberParameters: 2
   Parameter[0]: 00000000
   Parameter[1]: 71c22898
Attempt to read from address 71c22898

0: kd> .trap f5574d64
ErrCode = 00000004
eax=71c22898 ebx=0073a7a8 ecx=7c829c3a edx=71c1c000 esi=00000104 edi=00000000
eip=61213267 esp=005bf448 ebp=005bf4b4 iopl=0 nv up ei pl nz na po nc
cs=001b ss=0023 ds=0023 es=0023 fs=003b gs=0000 efl=00000202
ModuleA!GetData+0×0000b57f:
001b:61213267 0fb700 movzx   eax,word ptr [eax]  ds:0023:71c22898=????

We check its data using lmv WinDbg command and find out that it is old and needs to be updated. But we don’t stop our investigation here. The fact that ServiceA was suspended means that it was probably being debugged or memory dumped. And indeed, we see NTSD in a process list:

0: kd> !process 0 0
**** NT ACTIVE PROCESS DUMP ****
PROCESS 8619d5d0  SessionId: none  Cid: 0004    Peb: 00000000  ParentCid: 0000
    DirBase: 3fbeb020  ObjectTable: e1001e08  HandleCount: 1651.
    Image: System

PROCESS 85e95d88  SessionId: none  Cid: 019c    Peb: 7ffdf000  ParentCid: 0004
    DirBase: 3fbeb040  ObjectTable: e16d5f18  HandleCount:  19.
    Image: smss.exe

PROCESS 85e4fd88  SessionId: 0  Cid: 01cc    Peb: 7ffd4000  ParentCid: 019c
    DirBase: 3fbeb060  ObjectTable: e1561d70  HandleCount: 907.
    Image: csrss.exe

PROCESS 85e42d88  SessionId: 0  Cid: 01e4    Peb: 7ffde000  ParentCid: 019c
    DirBase: 3fbeb080  ObjectTable: e16a97b0  HandleCount: 504.
    Image: winlogon.exe

[...]

PROCESS 85a4dd18  SessionId: 0  Cid: 0fdc    Peb: 7ffda000  ParentCid: 0214
    DirBase: 3fbeb520  ObjectTable: e1aa5b38  HandleCount: 121.
    Image: ntsd.exe

[...]

If we zoom into NTSD process we would see that its main thread was waiting for a console input:

0: kd> !process 0fdc ff
[...]
THREAD 859f8768  Cid 0fdc.0fe0  Teb: 7ffdf000 Win32Thread: bc14cb38 WAIT: (Unknown) UserMode Non-Alertable
    859f8954  Semaphore Limit 0x1
Waiting for reply to LPC MessageId 00001f98:
Current LPC port e19f03a0
Not impersonating
DeviceMap                 e10008e8
Owning Process            85a4dd18       Image:         ntsd.exe
Attached Process          N/A            Image:         N/A
Wait Start TickCount      6932           Ticks: 89861 (0:00:23:24.078)
Context Switch Count      450                 LargeStack
UserTime                  00:00:00.000
KernelTime                00:00:00.078
Win32 Start Address ntsd!mainCRTStartup (0×0100845a)
Start Address kernel32!BaseProcessStartThunk (0×7c8217f8)
Stack Init f55c5000 Current f55c4c08 Base f55c5000 Limit f55c1000 Call 0
Priority 13 BasePriority 13 PriorityDecrement 0
Kernel stack not resident.
ChildEBP RetAddr 
f55c4c20 80833ec5 nt!KiSwapContext+0×26
f55c4c4c 80829c14 nt!KiSwapThread+0×2e5
f55c4c94 80920fba nt!KeWaitForSingleObject+0×346
f55c4d50 8088b3fc nt!NtRequestWaitReplyPort+0×776
f55c4d50 7c94860c nt!KiFastCallEntry+0xfc
0006ece0 7c947899 ntdll!KiFastSystemCallRet
0006ece4 7c94ec4a ntdll!ZwRequestWaitReplyPort+0xc
0006ed04 7c80cf8c ntdll!CsrClientCallServer+0×8c
0006edfc 7c872904 kernel32!ReadConsoleInternal+0×1b8
0006ee84 7c8018f4 kernel32!ReadConsoleA+0×3b
0006eedc 01005141 kernel32!ReadFile+0×64

0006ef04 01006974 ntsd!ConIn+0×183
0006ff38 010082d1 ntsd!MainLoop+0×1eb
0006ff44 01008589 ntsd!main+0×149
0006ffc0 7c82f23b ntsd!mainCRTStartup+0×12f
0006fff0 00000000 kernel32!BaseProcessStart+0×23

We follow LPC chain to csrss.exe to find out another blocked thread there:

0: kd> !lpc message 00001f98
Searching message 1f98 in threads …
Client thread 859f8768 waiting a reply from 1f98                         
Searching thread 859f8768 in port rundown queues …

Server communication port 0xe19b6b08
    Handles: 1   References: 1
    The LpcDataInfoChainHead queue is empty
        Connected port: 0xe19f03a0      Server connection port: 0xe1361d20

Client communication port 0xe19f03a0
    Handles: 1   References: 4
    The LpcDataInfoChainHead queue is empty

Server connection port e1361d20  Name: ServiceAPort
    Handles: 1   References: 233
    Server process  : 85e4fd88 (csrss.exe)
    Queue semaphore : 85e9b078
    Semaphore state 0 (0×0)
    The message queue is empty
    The LpcDataInfoChainHead queue is empty
Done.

0: kd> !process 85e4fd88 ff
[…]
THREAD 8549db60  Cid 01cc.1390  Teb: 7ffad000 Win32Thread: bc15aea8 WAIT: (Unknown) UserMode Non-Alertable
    8549dd4c  Semaphore Limit 0×1
Waiting for reply to LPC MessageId 00004feb:
Pending LPC Reply Message:
e191b6d0: [e1a162e8,e19ffc18]
Not impersonating
DeviceMap                 e10008e8
Owning Process            85e4fd88       Image:         csrss.exe
Attached Process          N/A            Image:         N/A
Wait Start TickCount      12095          Ticks: 84698 (0:00:22:03.406)
Context Switch Count      35                 LargeStack
UserTime                  00:00:00.000
KernelTime                00:00:00.000
Start Address 0×75943b55
Stack Init f5625000 Current f5624bf0 Base f5625000 Limit f5622000 Call 0
Priority 15 BasePriority 13 PriorityDecrement 0
Kernel stack not resident.
ChildEBP RetAddr 
f5624c08 80833ec5 nt!KiSwapContext+0×26
f5624c34 80829c14 nt!KiSwapThread+0×2e5
f5624c7c 809222f6 nt!KeWaitForSingleObject+0×346
f5624d38 8088b3fc nt!NtSecureConnectPort+0×6ce
f5624d38 7c94860c nt!KiFastCallEntry+0xfc
015ff778 7c947939 ntdll!KiFastSystemCallRet
015ff77c 77c2e7c3 ntdll!NtSecureConnectPort+0xc
015ff8a0 77c4607b RPCRT4!LRPC_CASSOCIATION::OpenLpcPort+0×21e
015ff8e0 77c45ffb RPCRT4!LRPC_CASSOCIATION::ActuallyDoBinding+0×55
015ff958 77c4f6a5 RPCRT4!LRPC_CASSOCIATION::AllocateCCall+0×190
015ff98c 77c4f5d1 RPCRT4!LRPC_BINDING_HANDLE::AllocateCCall+0×1f2
015ff9b8 77c4f201 RPCRT4!LRPC_BINDING_HANDLE::NegotiateTransferSyntax+0xd3
015ff9d0 77c4ed14 RPCRT4!I_RpcGetBufferWithObject+0×5b
015ff9e0 77c4f464 RPCRT4!I_RpcGetBuffer+0xf
015ff9f0 77cb30e4 RPCRT4!NdrGetBuffer+0×2e
015ffddc 779b4695 RPCRT4!NdrClientCall2+0×197
[…]

We follow LPC chain again to see that csrss.exe thread was waiting for a reply from our suspended and frozen ServiceA: 

0: kd> !lpc message 00004feb
Searching message 4feb in threads …
Client thread 8549db60 waiting a reply from 4feb                         
Searching thread 8549db60 in port rundown queues …

Server connection port e19a50e0  Name: ServiceAPort
    Handles: 1   References: 20
    Server process  : 8545eb18 (ServiceA.exe)
    Queue semaphore : 85443320
    Semaphore state 9 (0×9)
        Messages in queue:
        0000 e1a866e0 - Busy  Id=000022e7  From: 01e4.01e8  Context=80060004  [e19a50f0 . e1878688]
                   Length=011800e8  Type=0000000a (LPC_CONNECTION_REQUEST)
                   Data: 00000000 00000000 00000000 00000000 00000000 00000000
        0000 e1878688 - Busy  Id=00003297  From: 0ac0.0b54  Context=804d0045  [e1a866e0 . e1036740]
                   Length=011800e8  Type=0000000a (LPC_CONNECTION_REQUEST)
                   Data: 00000000 00000000 00000000 00000000 00000000 00000000
        0000 e1036740 - Busy  Id=00003986  From: 0ce4.0ce8  Context=00000042  [e1878688 . e1441228]
                   Length=011800e8  Type=0000000a (LPC_CONNECTION_REQUEST)
                   Data: 00000000 00000000 00000000 00000000 00000000 00000000
        0000 e1441228 - Busy  Id=00003a32  From: 0db4.0e14  Context=00000050  [e1036740 . e1a162e8]
                   Length=011800e8  Type=0000000a (LPC_CONNECTION_REQUEST)
                   Data: 00000000 00000000 00000000 00000000 00000000 00000000
        0000 e1a162e8 - Busy  Id=00004c75  From: 059c.05ac  Context=00000051  [e1441228 . e191b6d0]
                   Length=011800e8  Type=0000000a (LPC_CONNECTION_REQUEST)
                   Data: 00000000 00000000 00000000 00000000 00000000 00000000
        0000 e191b6d0 - Busy  Id=00004feb  From: 01cc.1390  Context=00000051  [e1a162e8 . e19ffc18]
                   Length=011800e8  Type=0000000a (LPC_CONNECTION_REQUEST)
                   Data: 00000000 00000000 00000000 00000000 00000000 00000000
        0000 e19ffc18 - Busy  Id=000055e3  From: 13fc.05b4  Context=800d0009  [e191b6d0 . e19f4ea0]
                   Length=011800e8  Type=0000000a (LPC_CONNECTION_REQUEST)
                   Data: 00000000 00000000 00000000 00000000 00000000 00000000
        0000 e19f4ea0 - Busy  Id=00006844  From: 0b00.0f20  Context=006b3d60  [e19ffc18 . e19a50f0]
                   Length=011800e8  Type=0000000a (LPC_CONNECTION_REQUEST)
                   Data: 00000000 00000000 00000000 00000000 00000000 00000000
    The message queue contains 8 messages
    The LpcDataInfoChainHead queue is empty
Done.

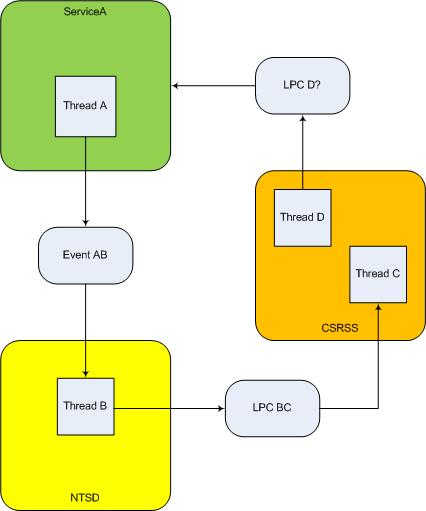
It doesn’t look as a deadlock because, although we have a cyclic process wait chain ServiceA -> NTSD -> CSRSS -> ServiceA, NTSD was waiting for a different thread in CSRSS than the one in CSRSS waiting for a reply from ServiceA. If these threads are unrelated then we don’t have a deadlock, strictly speaking, because the latter involves activity chains with ownership, not a container dependency (a process is a container for threads). I illustrated all this on the following diagram:

- Dmitry Vostokov @ DumpAnalysis.org -

The Strange Love of Dr. DebugLove

August 10th, 2009

I’m very delighted to be a Dr. DebugLove! There are many Dr. Debug out there (Google shows 1,840,000 hits) but do they really love debugging like I do? Of course, they do, but I’m the first to acknowledge my strange love publicly by accepting a pseudonym.

- Dmitry Vostokov @ DumpAnalysis.org -

Memory Dumps as Posets

August 9th, 2009

Last week I was comparing the existing collection of memory dump analysis patterns to the collection of trace analysis patterns (in formation) in the search of isomorphism (or more correctly, general morphism) similar to Missing Component pattern. It is not a coincidence that such pattern pairs can be formed. For example, it is possible to discern deadlocks from both crash dumps and software traces (if appropriate information is available there). Fundamentally, it is implied by the definition of a software trace as some sort of a memory dump. And we can see traces in memory dumps too, for example, Execution Residue pattern. Because raw stack data resides in stack pages and in contemporary operating systems they are created from zero pages (metaphorically, out of the void) we can say that stack regions of threads are sorted by their creation time, for example, in this process user memory dump:

0:017> !runaway 4
 Elapsed Time
  Thread       Time
   0:49c       0 days 5:16:31.076
   4:4d8       0 days 5:16:30.967
   3:4d0       0 days 5:16:30.967
   2:4cc       0 days 5:16:30.967
   1:4c8       0 days 5:16:30.967
   5:4e8       0 days 5:16:30.936
   6:b6c       0 days 5:16:15.695
   7:b70       0 days 5:16:15.679
   9:b88       0 days 5:16:15.586
   8:b84       0 days 5:16:15.586
  11:348       0 days 5:16:12.934
  10:bfc       0 days 5:16:12.934
  12:1200      0 days 5:15:16.528
  15:1298      0 days 5:15:15.220
  14:1290      0 days 5:15:15.220
  13:128c      0 days 5:15:15.220
  17:12e4      0 days 5:15:13.257
  16:12dc      0 days 5:15:13.257
  18:12ec      0 days 5:15:13.117
  20:12f4      0 days 5:15:13.085
  19:12f0      0 days 5:15:13.085
  21:17a0      0 days 5:13:16.321
  22:1628      0 days 5:13:15.729
  24:1778      0 days 1:35:50.773
  23:17ec      0 days 1:35:50.773
  25:1570      0 days 1:27:54.190
  26:1724      0 days 1:27:10.151
  27:1490      0 days 0:05:46.732
  28:1950      0 days 0:02:28.153
  29:19b4      0 days 0:00:58.108
  30:177c      0 days 0:00:38.358
  31:1798      0 days 0:00:23.351
  32:1a7c      0 days 0:00:08.343

If we have complete memory dumps we can also account for other processes and their elapsed time. Within stack pages we have partial stack traces but do not have exact timing information between them except for stack frames from the current frozen thread stack trace or, if we are lucky, from a partial stack trace from the past execution. However, the timing between frames from different stacks is undefined and we can only guess it from higher level considerations like semantics of procedure calls and other information.

These considerations and the notion of a poset (partially ordered set) let me thinking about memory dumps as posets. I even created my interpretation of POSET abbreviation for this occasion:

POSET 

Partially Ordered Software Execution Trace   

- Dmitry Vostokov @ DumpAnalysis.org -

Errata for WDPF book

August 9th, 2009

Errata for the previous book Windows Debugging: Practical Foundations has been published:

Errata

Next week the updated version (revision 2.0) should be available on Amazon and other stores for both paperback and hardback titles. Digital version on Lulu has already been updated.

- Dmitry Vostokov @ DumpAnalysis.org -

x64 Windows Debugging: Practical Foundations

August 8th, 2009

The digital version of the book is finally available:

x64 Windows Debugging: Practical Foundations

Paperback should be available in 1-2 weeks on Amazon and other stores. When working on the book I fixed errors in the previous x86 version. Errata file for it should be available tomorrow.

- Dmitry Vostokov @ DumpAnalysis.org -

Bsoddite Movement

August 7th, 2009

The new contemporary movement of engineers resisting dump analysis automation (including automated debugging and perhaps automated software construction too)

Inspired by Luddite movement.

- Dmitry Vostokov @ DumpAnalysis.org -

Reconstructing Blue Screen of Death

August 7th, 2009

While I was listening to Klaus Schulze In Blue album a colleague sent me the link to a tool that reconstructs blue screens from minidumps (small memory dumps):

BlueScreenView (written by Nir Sofer)

I immediately downloaded it at it works even with kernel dumps but without pointing to a module that triggered the bugcheck (it shows modules for minidumps):

It ignores memory dumps and minidumps from x64 Windows so the next version I hope should do it :-)

PS. Long time ago I was thinking about writing a kernel driver that saves BSOD screen and embeds it in a memory dump.

- Dmitry Vostokov @ DumpAnalysis.org -

Ideas and Modern Mind

August 7th, 2009

This is an encyclopedic work I bought in a local book shop and finally finished reading today. It took me a year to read from cover to cover and pages were falling out of the glue but I continued to read. Highly recommended for education and another view on human history. The review of Freud was enlightening to me because I didn’t know about the recent scholarship criticizing his work. In fact, I so liked this book that just bought it again in a hardcover version from Folio Society and start rereading it again soon.

Ideas: A History of Thought and Invention, from Fire to Freud

Buy from Amazon

The second encyclopedic book seems was written before the previous one but looks like the logical sequel to it. I’m starting reading it next week.

The Modern Mind: An Intellectual History of the 20th Century

Buy from Amazon

- Dmitry Vostokov @ LiterateScientist.com -

Bugtation No.100

August 6th, 2009

The road to immortality is paved with memory dumps.

Dmitry Vostokov

- Dmitry Vostokov @ DumpAnalysis.org -

Moving towards the Psi point

August 6th, 2009

The hierarchy of Ψ1, …, Ψ8, …, Ψ16, …, Ψ32, …, Ψ64, …, …, …, ΨΨ numbers where the subscript denotes the number of bits a memory address can have, so Ψ32 and Ψ64 are memorillion and quadrimemorillion of memory dumps respectively. We only need to figure out the meaning of Ψ0 and ΨΨ. Perhaps there is some meaning in Dirac notation here: <Ψ0Ψ>. More on this later because I have to finish this week the book x64 Windows Debugging: Practical Foundations and write an errata file for the previous x86 version of the book series.

Note: Ψ is an M upside down.

- Dmitry Vostokov @ DumpAnalysis.org -

Trace Analysis Patterns (Part 9)

August 6th, 2009

There is an obvious pattern called Missing Component. We don’t see trace statements we expect and wonder whether the component was not loaded, its container ceased to exist or simply it wasn’t selected for tracing. In many support cases there is a trade-off between tracing everything and the size of trace files. Customers and engineers usually prefer smaller files to analyze. However in the case of predictable and reproducible issues with short duration we can always select all components or deselect a few (instead of selecting a few). Here is the article for Citrix CDF tracing best practices and it can be applied to other software traces as well:

Tracing Best Practices

We can find an example from Discontinuity pattern where the possibility of a sudden and silent gap in trace statements could happen because not all necessary components were selected for tracing.

Sometimes, in cases when the missing component was selected for tracing but we don’t see any trace output from it other module traces can give us an indication, perhaps showing the load failure message. For example, Process Monitor tracing done in parallel can reveal load failures.

- Dmitry Vostokov @ TraceAnalysis.org -

New Dump Analyst Position

August 5th, 2009

Jobs section on the portal features the new open position:

Dump Analyst for Samsung SDS India

- Dmitry Vostokov @ DumpAnalysis.org -