Icons for Memory Dump Analysis Patterns (Part 12)
March 25th, 2010Today we introduce an icon for Hidden Exception pattern:
B/W
![]()
Color
![]()
- Dmitry Vostokov @ DumpAnalysis.org + TraceAnalysis.org -
Today we introduce an icon for Hidden Exception pattern:
B/W
![]()
Color
![]()
- Dmitry Vostokov @ DumpAnalysis.org + TraceAnalysis.org -
Here is one of the first case studies in pattern-driven software trace analysis. A user starts printing but nothing comes out. However, if the older printer driver is installed everything works as expected. We suspect that print spooler crashes if the newer printer driver is used. Based on known module name in ETW trace we find PID for print spooler process (19984) and immediately see discontinuity in the trace with the large time delta between the last PID message and the last trace statement (almost 4 minutes):
No Source PID TID Time Message
712 \src\print\ui 19984 16200 12:22:31.571 PropertySheet returns 1
[… no messages for PID 19984 …]
5103 \src\mgmt 1292 7604 12:26:11.659 WaitAction
If we select the adjoint thread of source \src\print\driver (in other words, filter only its messages) we would see discontinuity with the similar time delta. We know that printer driver runs in print spooler context. However, PID had changed and that means print spooler was restarted (perhaps after a crash):
No Source PID TID Time Message
557 \src\print\driver 19984 16200 12:22:28.069 DisableDevice returns
[… discontinuity for \print\driver …]
1462 \src\print\driver 10828 17584 12:26:03.854 DllMain
- Dmitry Vostokov @ DumpAnalysis.org + TraceAnalysis.org -
Today we introduce an icon for Inconsistent Dump pattern:
B/W
![]()
Color
![]()
- Dmitry Vostokov @ DumpAnalysis.org + TraceAnalysis.org -
Today we introduce an icon for NULL Pointer (data) pattern:
B/W
![]()
Color
![]()
- Dmitry Vostokov @ DumpAnalysis.org + TraceAnalysis.org -
Comments in italics are mine and express my own views, thoughts and opinions
Windows Internals by M. Russinovich, D. Solomon and A. Ionescu:
Processor mode doesn’t affect thread scheduling (p. 414)
Preemption can be before a quantum ends and in that case the preempted thread is pushed at the front of a ready queue (pp. 414 - 415)
Clock interval extension of quanta for interrupted threads (pp. 416 - 417)
Context Switching (p. 418) - just noticed (never paid attention to before) that WinDbg shows empty context for the preempted thread:
x86 W2K3:
0: kd> kL
ChildEBP RetAddr
ba3a2a44 80833ed1 nt!KiSwapContext+0x26
ba3a2a70 80829c14 nt!KiSwapThread+0x2e5
ba3a2ab8 b9c5674d nt!KeWaitForSingleObject+0x346
[...]
0: kd> r
Last set context:
eax=00000000 ebx=00000000 ecx=00000000 edx=00000000 esi=00000000 edi=00000000
eip=8088f77e esp=ba3a2a38 ebp=ba3a2a70 iopl=0 nv up di pl nz na po nc
cs=0008 ss=0010 ds=0000 es=0000 fs=0000 gs=0000 efl=00000000
nt!KiSwapContext+0×26:
8088f77e 8b2c24 mov ebp,dword ptr [esp] ss:0010:ba3a2a38=ba3a2a70
0: kd> uf nt!KiSwapContext
nt!KiSwapContext:
8088f758 sub esp,10h
8088f75b mov dword ptr [esp+0Ch],ebx
8088f75f mov dword ptr [esp+8],esi
8088f763 mov dword ptr [esp+4],edi
8088f767 mov dword ptr [esp],ebp
8088f76a mov ebx,dword ptr fs:[1Ch]
8088f771 mov edi,ecx
8088f773 mov esi,edx
8088f775 movzx ecx,byte ptr [edi+4Eh]
8088f779 call nt!SwapContext (8088f880)
8088f77e mov ebp,dword ptr [esp]
8088f781 mov edi,dword ptr [esp+4]
8088f785 mov esi,dword ptr [esp+8]
8088f789 mov ebx,dword ptr [esp+0Ch]
8088f78d add esp,10h
8088f790 ret
x64 W2K8:
1: kd> kL
*** Stack trace for last set context - .thread/.cxr resets it
Child-SP RetAddr Call Site
fffffa60`02ddc7c0 fffff800`0187a6fa nt!KiSwapContext+0x7f
fffffa60`02ddc900 fffff800`0186f35b nt!KiSwapThread+0x13a
fffffa60`02ddc970 fffff800`01ad9e57 nt!KeWaitForSingleObject+0x2cb
fffffa60`02ddca00 fffff800`01ad9219 nt!AlpcpReceiveMessagePort+0x287
fffffa60`02ddca60 fffff800`01ada58a nt!AlpcpReceiveMessage+0x245
fffffa60`02ddcb00 fffff800`01877ef3 nt!NtAlpcSendWaitReceivePort+0x1da
fffffa60`02ddcbb0 00000000`7747756a nt!KiSystemServiceCopyEnd+0x13
00000000`0020f5a8 00000000`00000000 ntdll!ZwAlpcSendWaitReceivePort+0xa
1: kd> r
Last set context:
rax=0000000000000000 rbx=0000000000000000 rcx=0000000000000000
rdx=0000000000000000 rsi=0000000000000000 rdi=0000000000000000
rip=fffff8000187ac7f rsp=fffffa6002ddc7c0 rbp=fffffa80047ca290
r8=0000000000000000 r9=0000000000000000 r10=0000000000000000
r11=0000000000000000 r12=0000000000000000 r13=0000000000000000
r14=0000000000000000 r15=0000000000000000
iopl=0 nv up di pl nz na pe nc
cs=0000 ss=0000 ds=0000 es=0000 fs=0000 gs=0000 efl=00000000
nt!KiSwapContext+0×7f:
fffff800`0187ac7f 488d8c2400010000 lea rcx,[rsp+100h]
1: kd> uf nt!KiSwapContext
nt!KiSwapContext:
fffff800`0187ac00 sub rsp,138h
fffff800`0187ac07 lea rax,[rsp+100h]
fffff800`0187ac0f movaps xmmword ptr [rsp+30h],xmm6
fffff800`0187ac14 movaps xmmword ptr [rsp+40h],xmm7
fffff800`0187ac19 movaps xmmword ptr [rsp+50h],xmm8
fffff800`0187ac1f movaps xmmword ptr [rsp+60h],xmm9
fffff800`0187ac25 movaps xmmword ptr [rsp+70h],xmm10
fffff800`0187ac2b movdqa xmmword ptr [rax-80h],xmm11
fffff800`0187ac31 movdqa xmmword ptr [rax-70h],xmm12
fffff800`0187ac37 movdqa xmmword ptr [rax-60h],xmm13
fffff800`0187ac3d movdqa xmmword ptr [rax-50h],xmm14
fffff800`0187ac43 movdqa xmmword ptr [rax-40h],xmm15
fffff800`0187ac49 mov qword ptr [rax],rbx
fffff800`0187ac4c mov qword ptr [rax+8],rdi
fffff800`0187ac50 mov qword ptr [rax+10h],rsi
fffff800`0187ac54 mov qword ptr [rax+18h],r12
fffff800`0187ac58 mov qword ptr [rax+20h],r13
fffff800`0187ac5c mov qword ptr [rax+28h],r14
fffff800`0187ac60 mov qword ptr [rax+30h],r15
fffff800`0187ac64 mov rbx,qword ptr gs:[20h]
fffff800`0187ac6d mov rdi,rcx
fffff800`0187ac70 mov rsi,rdx
fffff800`0187ac73 movzx ecx,byte ptr [rdi+156h]
fffff800`0187ac7a call nt!SwapContext (fffff800`0187af50)
fffff800`0187ac7f lea rcx,[rsp+100h]
fffff800`0187ac87 movdqa xmm6,xmmword ptr [rsp+30h]
fffff800`0187ac8d movdqa xmm7,xmmword ptr [rsp+40h]
fffff800`0187ac93 movdqa xmm8,xmmword ptr [rsp+50h]
fffff800`0187ac9a movdqa xmm9,xmmword ptr [rsp+60h]
fffff800`0187aca1 movdqa xmm10,xmmword ptr [rsp+70h]
fffff800`0187aca8 movdqa xmm11,xmmword ptr [rcx-80h]
fffff800`0187acae movdqa xmm12,xmmword ptr [rcx-70h]
fffff800`0187acb4 movdqa xmm13,xmmword ptr [rcx-60h]
fffff800`0187acba movdqa xmm14,xmmword ptr [rcx-50h]
fffff800`0187acc0 movdqa xmm15,xmmword ptr [rcx-40h]
fffff800`0187acc6 mov rbx,qword ptr [rcx]
fffff800`0187acc9 mov rdi,qword ptr [rcx+8]
fffff800`0187accd mov rsi,qword ptr [rcx+10h]
fffff800`0187acd1 mov r12,qword ptr [rcx+18h]
fffff800`0187acd5 mov r13,qword ptr [rcx+20h]
fffff800`0187acd9 mov r14,qword ptr [rcx+28h]
fffff800`0187acdd mov r15,qword ptr [rcx+30h]
fffff800`0187ace1 add rsp,138h
fffff800`0187ace8 ret
We also see that if there is an attempt to switch from a DPC we get a bugcheck
1: kd> uf nt!SwapContext
nt!SwapContext:
fffff800`0187af50 sub rsp,38h
fffff800`0187af54 mov qword ptr [rsp+30h],rbp
fffff800`0187af59 mov byte ptr [rsp+28h],cl
fffff800`0187af5d cmp byte ptr [rsi+95h],0
fffff800`0187af64 jne nt!SwapContext+0x1cb (fffff800`0187b11b)
[...]
nt!SwapContext+0x1b2:
fffff800`0187b102 xor r9,r9
fffff800`0187b105 mov qword ptr [rsp+20h],r9
fffff800`0187b10a mov r8,rsi
fffff800`0187b10d mov rdx,rdi
fffff800`0187b110 mov ecx,0B8h
fffff800`0187b115 call nt!KeBugCheckEx (fffff800`01878450)
fffff800`0187b11a ret
It happens infrequently: http://www.dumpanalysis.org/blog/index.php/2008/03/12/bug-check-frequencies/
Idle process and threads can have NULL fields (pp. 418 - 419) - on x64 W2K8:
1: kd> !process poi(PsIdleProcess)
PROCESS fffff800019970c0
SessionId: none Cid: 0000 Peb: 00000000 ParentCid: 0000
DirBase: 00124000 ObjectTable: fffff88000000080 HandleCount: 551.
Image: Idle
VadRoot fffffa8003b97c70 Vads 1 Clone 0 Private 1. Modified 0. Locked 0.
DeviceMap 0000000000000000
Token fffff88000003330
ElapsedTime 00:00:00.000
UserTime 00:00:00.000
KernelTime 00:00:00.000
QuotaPoolUsage[PagedPool] 0
QuotaPoolUsage[NonPagedPool] 0
Working Set Sizes (now,min,max) (6, 50, 450) (24KB, 200KB, 1800KB)
PeakWorkingSetSize 6
VirtualSize 0 Mb
PeakVirtualSize 0 Mb
PageFaultCount 1
MemoryPriority BACKGROUND
BasePriority 0
CommitCharge 0
THREAD fffff80001996b80 Cid 0000.0000 Teb: 0000000000000000 Win32Thread: 0000000000000000 RUNNING on processor 0
Not impersonating
DeviceMap fffff88000007310
Owning Process fffff800019970c0 Image: Idle
Attached Process fffffa8003bf1040 Image: System
Wait Start TickCount 16846 Ticks: 1721 (0:00:00:26.847)
Context Switch Count 229608
UserTime 00:00:00.000
KernelTime 00:04:13.532
Win32 Start Address nt!KiIdleLoop (0xfffff8000187c880)
Stack Init fffff80002bdadb0 Current fffff80002bdad40
Base fffff80002bdb000 Limit fffff80002bd5000 Call 0
Priority 16 BasePriority 0 PriorityDecrement 0 IoPriority 0 PagePriority 0
Child-SP RetAddr Call Site
fffff800`02bdad80 fffff800`01a49860 nt!KiIdleLoop+0x11b
fffff800`02bdadb0 00000000`00000000 nt!zzz_AsmCodeRange_End+0x4
THREAD fffffa60005f5d40 Cid 0000.0000 Teb: 0000000000000000 Win32Thread: 0000000000000000 RUNNING on processor 1
Not impersonating
DeviceMap fffff88000007310
Owning Process fffff800019970c0 Image: Idle
Attached Process fffffa8003bf1040 Image: System
Wait Start TickCount 0 Ticks: 18567 (0:00:04:49.647)
Context Switch Count 241262
UserTime 00:00:00.000
KernelTime 00:04:23.501
Win32 Start Address nt!KiIdleLoop (0xfffff8000187c880)
Stack Init fffffa600191bdb0 Current fffffa600191bd40
Base fffffa600191c000 Limit fffffa6001916000 Call 0
Priority 16 BasePriority 0 PriorityDecrement 0 IoPriority 0 PagePriority 0
Child-SP RetAddr Call Site
fffffa60`0191bcd8 fffffa60`00f07685 intelppm!C1Halt+0x2
fffffa60`0191bce0 fffff800`0187cb83 intelppm!C1Idle+0x9
fffffa60`0191bd10 fffff800`0187c8a1 nt!PoIdle+0x183
fffffa60`0191bd80 fffff800`01a49860 nt!KiIdleLoop+0x21
fffffa60`0191bdb0 00000000`fffffa60 nt!zzz_AsmCodeRange_End+0x4
fffffa60`005efd00 00000000`00000000 0xfffffa60
MMCSS (MultiMedia Class Schedular Service) and priority boosts in Vista (p. 420)
Priority boosts never go beyond level 15 (p. 421) - looks like addition of velocities in relativity, where v1 > c/2, v2 > c/2 but v1+v2 < c (where c is the speed of light) :-)
Priority boosts for low prioroty _ERESOURCE owners (pp. 422 - 423)
The clash of titans over the bit of memory.
- Dmitry Vostokov @ DumpAnalysis.org + TraceAnalysis.org -
Let’s now introduce collective pointers or pointer cones. Suppose we have a set of pointers pointing to fields of some memory structure. This set of pointers could be another structure as well or just a collection of pointers that can be logically brought together:

If we make the boundary opaque we can name such set of pointers as Collective Pointer (or Pointer Cone):

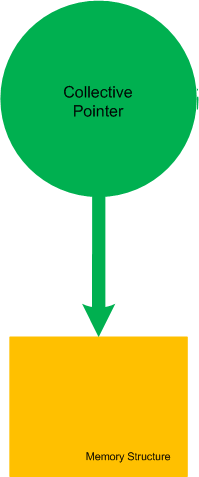
Another example is when we split the perception field of a pointer into disjoint collective pointers (the perception field as a whole is already a trivial collective pointer):

- Dmitry Vostokov @ DumpAnalysis.org + TraceAnalysis.org -
Today we introduce an icon for NULL Pointer (code) pattern:
B/W
![]()
Color
![]()
- Dmitry Vostokov @ DumpAnalysis.org + TraceAnalysis.org -
I originally intended to name this blog post as ”What I’m Reading Now” but then decided to show it as another satisfying example of my Mod N Reading technique. During my 7 years in memory dump analysis captivity I didn’t pay much attention to traditional synthetic software engineering (as opposed to analytical software defect research in computer memory) except occasionally writing some troubleshooting tools, describing DebugWare patterns in UML and devising RADII process. A few weeks ago I decided to brush up my engineering skills and read some books that accumulated in my library during last few years. Here is the list of them (debugging triptych of Windows Internals 5th Edition, Advanced Windows Debugging, and Advanced .NET Debugging are on my office table and I read them almost daily so I’m not including them in the list below).
Illustrated Mod N is actually Mod 7 technique where I cycle through 7 topics with 3 books for each topic. Ideally I aim to dedicate one topic per day every week but this is not always possible due to writing and publishing but I still do it in a Mod 7 way even if I skip some days. it usually takes me an hour or two to read carefully 5-10 pages from each of 3 topical books. Here is the current state of the reading round-robin queue (21 books) under my home computer desk:

Here are the topics and corresponding books (with links if you would like to buy them from Amazon):
Multithreading from Computer Science Perspective
Synchronization Algorithms and Concurrent Programming
The Art of Multiprocessor Programming
Algorithms, Parsing
Flex & Bison: Text Processing Tools
Statistics
Statistics in a Nutshell: A Desktop Quick Reference
Statistics Hacks: Tips & Tools for Measuring the World and Beating the Odds
C++, STL and Boost
Beyond the C++ Standard Library: An Introduction to Boost
Security, Mac OS X
The Rootkit Arsenal: Escape and Evasion in the Dark Corners of the System
Security Engineering: A Guide to Building Dependable Distributed Systems
Code, Games
Programming Language Pragmatics, Third Edition
Code Complete: A Practical Handbook of Software Construction
Embedded and Real-Time Software Engineering
Bebop to the Boolean Boogie, Third Edition: An Unconventional Guide to Electronics
Software Engineering for Real-Time Systems
- Dmitry Vostokov @ DumpAnalysis.org + TraceAnalysis.org -
I already had an experience with The Mystical One and a few weeks ago I finally grasped yet another parallel between The Year of Dump Analysis (0x7DA or 0n2010) and the fact that I started doing computer memory dump analysis 7 years ago! The emphasis here is on “computer“; before that I’d been doing general memory dump analysis for decades.
- Dmitry Vostokov @ DumpAnalysis.org + TraceAnalysis.org -
Today we introduce an icon for Invalid Pointer (general) pattern:
B/W
![]()
Color
![]()
- Dmitry Vostokov @ DumpAnalysis.org + TraceAnalysis.org -
Comments in italics are mine and express my own views, thoughts and opinions
Windows Internals by M. Russinovich, D. Solomon and A. Ionescu:
Deferred ready and standby thread states (p. 400)
Gait waiting (p. 401)
Transition state as state with paged out kernel stack (p. 401) - flattening thread state transition diagram for ready state:
deferred ready -> ready <-> running
Thread state counter in Performance Monitor (pp. 402 - 404)
Per-processor ready queues and O(1) (pp. 404 - 405)
PRCB (p. 404) - rather a huge structure on x64 W2K8:
0: kd> dt nt!_KPRCB
+0x000 MxCsr : Uint4B
+0x004 Number : Uint2B
+0x006 InterruptRequest : UChar
+0x007 IdleHalt : UChar
+0x008 CurrentThread : Ptr64 _KTHREAD
+0x010 NextThread : Ptr64 _KTHREAD
+0x018 IdleThread : Ptr64 _KTHREAD
+0x020 NestingLevel : UChar
+0x021 Group : UChar
+0x022 PrcbPad00 : [6] UChar
+0x028 RspBase : Uint8B
+0x030 PrcbLock : Uint8B
+0x038 SetMember : Uint8B
+0x040 ProcessorState : _KPROCESSOR_STATE
+0x5f0 CpuType : Char
+0x5f1 CpuID : Char
+0x5f2 CpuStep : Uint2B
+0x5f2 CpuStepping : UChar
+0x5f3 CpuModel : UChar
+0x5f4 MHz : Uint4B
+0x5f8 HalReserved : [8] Uint8B
+0x638 MinorVersion : Uint2B
+0x63a MajorVersion : Uint2B
+0x63c BuildType : UChar
+0x63d CpuVendor : UChar
+0x63e CoresPerPhysicalProcessor : UChar
+0x63f LogicalProcessorsPerCore : UChar
+0x640 ApicMask : Uint4B
+0x644 CFlushSize : Uint4B
+0x648 AcpiReserved : Ptr64 Void
+0x650 InitialApicId : Uint4B
+0x654 Stride : Uint4B
+0x658 PrcbPad01 : [3] Uint8B
+0x670 LockQueue : [49] _KSPIN_LOCK_QUEUE
+0x980 PPLookasideList : [16] _PP_LOOKASIDE_LIST
+0xa80 PPNPagedLookasideList : [32] _GENERAL_LOOKASIDE_POOL
+0x1680 PPPagedLookasideList : [32] _GENERAL_LOOKASIDE_POOL
+0x2280 PacketBarrier : Uint8B
+0×2288 DeferredReadyListHead : _SINGLE_LIST_ENTRY
+0×2290 MmPageFaultCount : Int4B
+0×2294 MmCopyOnWriteCount : Int4B
+0×2298 MmTransitionCount : Int4B
+0×229c MmDemandZeroCount : Int4B
+0×22a0 MmPageReadCount : Int4B
+0×22a4 MmPageReadIoCount : Int4B
+0×22a8 MmDirtyPagesWriteCount : Int4B
+0×22ac MmDirtyWriteIoCount : Int4B
+0×22b0 MmMappedPagesWriteCount : Int4B
+0×22b4 MmMappedWriteIoCount : Int4B
+0×22b8 KeSystemCalls : Uint4B
+0×22bc KeContextSwitches : Uint4B
+0×22c0 CcFastReadNoWait : Uint4B
+0×22c4 CcFastReadWait : Uint4B
+0×22c8 CcFastReadNotPossible : Uint4B
+0×22cc CcCopyReadNoWait : Uint4B
+0×22d0 CcCopyReadWait : Uint4B
+0×22d4 CcCopyReadNoWaitMiss : Uint4B
+0×22d8 LookasideIrpFloat : Int4B
+0×22dc IoReadOperationCount : Int4B
+0×22e0 IoWriteOperationCount : Int4B
+0×22e4 IoOtherOperationCount : Int4B
+0×22e8 IoReadTransferCount : _LARGE_INTEGER
+0×22f0 IoWriteTransferCount : _LARGE_INTEGER
+0×22f8 IoOtherTransferCount : _LARGE_INTEGER
+0×2300 TargetSet : Uint8B
+0×2308 IpiFrozen : Uint4B
+0×230c PrcbPad3 : [116] UChar
+0×2380 RequestMailbox : [64] _REQUEST_MAILBOX
+0×3380 SenderSummary : Uint8B
+0×3388 PrcbPad4 : [120] UChar
+0×3400 DpcData : [2] _KDPC_DATA
+0×3440 DpcStack : Ptr64 Void
+0×3448 SparePtr0 : Ptr64 Void
+0×3450 MaximumDpcQueueDepth : Int4B
+0×3454 DpcRequestRate : Uint4B
+0×3458 MinimumDpcRate : Uint4B
+0×345c DpcInterruptRequested : UChar
+0×345d DpcThreadRequested : UChar
+0×345e DpcRoutineActive : UChar
+0×345f DpcThreadActive : UChar
+0×3460 TimerHand : Uint8B
+0×3460 TimerRequest : Uint8B
+0×3468 TickOffset : Int4B
+0×346c MasterOffset : Int4B
+0×3470 DpcLastCount : Uint4B
+0×3474 ThreadDpcEnable : UChar
+0×3475 QuantumEnd : UChar
+0×3476 PrcbPad50 : UChar
+0×3477 IdleSchedule : UChar
+0×3478 DpcSetEventRequest : Int4B
+0×347c KeExceptionDispatchCount : Uint4B
+0×3480 DpcEvent : _KEVENT
+0×3498 PrcbPad51 : Ptr64 Void
+0×34a0 CallDpc : _KDPC
+0×34e0 ClockKeepAlive : Int4B
+0×34e4 ClockCheckSlot : UChar
+0×34e5 ClockPollCycle : UChar
+0×34e6 PrcbPad6 : [2] UChar
+0×34e8 DpcWatchdogPeriod : Int4B
+0×34ec DpcWatchdogCount : Int4B
+0×34f0 PrcbPad70 : [2] Uint8B
+0×3500 WaitListHead : _LIST_ENTRY
+0×3510 WaitLock : Uint8B
+0×3518 ReadySummary : Uint4B
+0×351c QueueIndex : Uint4B
+0×3520 PrcbPad71 : [12] Uint8B
+0×3580 DispatcherReadyListHead : [32] _LIST_ENTRY
+0×3780 InterruptCount : Uint4B
+0×3784 KernelTime : Uint4B
+0×3788 UserTime : Uint4B
+0×378c DpcTime : Uint4B
+0×3790 InterruptTime : Uint4B
+0×3794 AdjustDpcThreshold : Uint4B
+0×3798 SkipTick : UChar
+0×3799 DebuggerSavedIRQL : UChar
+0×379a PollSlot : UChar
+0×379b PrcbPad80 : [5] UChar
+0×37a0 DpcTimeCount : Uint4B
+0×37a4 DpcTimeLimit : Uint4B
+0×37a8 PeriodicCount : Uint4B
+0×37ac PeriodicBias : Uint4B
+0×37b0 PrcbPad81 : [2] Uint8B
+0×37c0 ParentNode : Ptr64 _KNODE
+0×37c8 MultiThreadProcessorSet : Uint8B
+0×37d0 MultiThreadSetMaster : Ptr64 _KPRCB
+0×37d8 StartCycles : Uint8B
+0×37e0 MmSpinLockOrdering : Int4B
+0×37e4 PageColor : Uint4B
+0×37e8 NodeColor : Uint4B
+0×37ec NodeShiftedColor : Uint4B
+0×37f0 SecondaryColorMask : Uint4B
+0×37f4 Sleeping : Int4B
+0×37f8 CycleTime : Uint8B
+0×3800 CcFastMdlReadNoWait : Uint4B
+0×3804 CcFastMdlReadWait : Uint4B
+0×3808 CcFastMdlReadNotPossible : Uint4B
+0×380c CcMapDataNoWait : Uint4B
+0×3810 CcMapDataWait : Uint4B
+0×3814 CcPinMappedDataCount : Uint4B
+0×3818 CcPinReadNoWait : Uint4B
+0×381c CcPinReadWait : Uint4B
+0×3820 CcMdlReadNoWait : Uint4B
+0×3824 CcMdlReadWait : Uint4B
+0×3828 CcLazyWriteHotSpots : Uint4B
+0×382c CcLazyWriteIos : Uint4B
+0×3830 CcLazyWritePages : Uint4B
+0×3834 CcDataFlushes : Uint4B
+0×3838 CcDataPages : Uint4B
+0×383c CcLostDelayedWrites : Uint4B
+0×3840 CcFastReadResourceMiss : Uint4B
+0×3844 CcCopyReadWaitMiss : Uint4B
+0×3848 CcFastMdlReadResourceMiss : Uint4B
+0×384c CcMapDataNoWaitMiss : Uint4B
+0×3850 CcMapDataWaitMiss : Uint4B
+0×3854 CcPinReadNoWaitMiss : Uint4B
+0×3858 CcPinReadWaitMiss : Uint4B
+0×385c CcMdlReadNoWaitMiss : Uint4B
+0×3860 CcMdlReadWaitMiss : Uint4B
+0×3864 CcReadAheadIos : Uint4B
+0×3868 MmCacheTransitionCount : Int4B
+0×386c MmCacheReadCount : Int4B
+0×3870 MmCacheIoCount : Int4B
+0×3874 PrcbPad91 : [3] Uint4B
+0×3880 PowerState : _PROCESSOR_POWER_STATE
+0×3998 KeAlignmentFixupCount : Uint4B
+0×399c VendorString : [13] UChar
+0×39a9 PrcbPad10 : [3] UChar
+0×39ac FeatureBits : Uint4B
+0×39b0 UpdateSignature : _LARGE_INTEGER
+0×39b8 DpcWatchdogDpc : _KDPC
+0×39f8 DpcWatchdogTimer : _KTIMER
+0×3a38 Cache : [5] _CACHE_DESCRIPTOR
+0×3a74 CacheCount : Uint4B
+0×3a78 CachedCommit : Uint4B
+0×3a7c CachedResidentAvailable : Uint4B
+0×3a80 HyperPte : Ptr64 Void
+0×3a88 WheaInfo : Ptr64 Void
+0×3a90 EtwSupport : Ptr64 Void
+0×3aa0 InterruptObjectPool : _SLIST_HEADER
+0×3ab0 HypercallPageList : _SLIST_HEADER
+0×3ac0 HypercallPageVirtual : Ptr64 Void
+0×3ac8 VirtualApicAssist : Ptr64 Void
+0×3ad0 StatisticsPage : Ptr64 Uint8B
+0×3ad8 RateControl : Ptr64 Void
+0×3ae0 CacheProcessorMask : [5] Uint8B
+0×3b08 PackageProcessorSet : Uint8B
+0×3b10 CoreProcessorSet : Uint8B
Changed thread quantum accounting in Vista (now: clock cycles), quantum targets, partial quantum decay (pp. 406 - 407)
The mystery of huge number in KiCyclesPerClockQuantum (p. 408) - here is an output on my PC:
0: kd> dd KiCyclesPerClockQuantum l1
fffff800`01a45170 008e58db
0: kd> !cpuinfo
CP F/M/S Manufacturer MHz PRCB Signature MSR 8B Signature Features
0 6,15,2 GenuineIntel 1794 0000005600000000 20193ffe
1 6,15,2 GenuineIntel 1794 0000005600000000 20193ffe
Cached Update Signature 0000005a00000000
Initial Update Signature 0000005600000000
C:\>C:\DL\Clockres.exe
ClockRes v2.0 - View the system clock resolution
Copyright (C) 2009 Mark Russinovich
SysInternals - www.sysinternals.com
Maximum timer interval: 15.600 ms
Minimum timer interval: 0.500 ms
Current timer interval: 1.000 ms
HKLM\S\CCS\C\PriorityControl\Win32PrioritySeparation vs. PsPrioritySeperation - looks like a misprint that needs fixing in the next version of Windows. Why it was a deliberate misspelling (p. 411) we can only guess…
0: kd> dd PsPrioritySeperation l1
fffff800`01a45228 00000002
Recently, a reader of this blog sent me a minidump file and a debugger log of an application that had about 300 modules loaded in a process address space. What was interesting is the huge amount of ModLoad / Unload module debugger events in the log prior to an access violation exception. Some modules were loaded / unloaded many times, for example (only included lines for just one module but there were many other):
[...]
ModLoad: 16640000 16649000 X:\Client\Bin\ModuleA.dll
[...]
Unload module X:\Client\Bin\ModuleA.dll at 16640000
[...]
ModLoad: 192b0000 192b9000 X:\Client\Bin\ModuleA.dll
[...]
Unload module X:\Client\Bin\ModuleA.dll at 192b0000
[...]
ModLoad: 192b0000 192b9000 X:\Client\Bin\ModuleA.dll
[...]
Unload module X:\Client\Bin\ModuleA.dll at 192b0000
[...]
ModLoad: 161b0000 161b9000 X:\Client\Bin\ModuleA.dll
[...]
Unload module X:\Client\Bin\ModuleA.dll at 161b0000
[...]
ModLoad: 161e0000 161e9000 X:\Client\Bin\ModuleA.dll
[...]
Unload module X:\Client\Bin\ModuleA.dll at 161e0000
[...]
ModLoad: 161f0000 161f9000 X:\Client\Bin\ModuleA.dll
[...]
Unload module X:\Client\Bin\ModuleA.dll at 161f0000
[...]
ModLoad: 161f0000 161f9000 X:\Client\Bin\ModuleA.dll
[...]
Unload module X:\Client\Bin\ModuleA.dll at 161f0000
[...]
ModLoad: 161f0000 161f9000 X:\Client\Bin\ModuleA.dll
[...]
Unload module X:\Client\Bin\ModuleA.dll at 161f0000
[...]
ModLoad: 161f0000 161f9000 X:\Client\Bin\ModuleA.dll
[...]
Unload module X:\Client\Bin\ModuleA.dll at 161f0000
[...]
ModLoad: 161f0000 161f9000 X:\Client\Bin\ModuleA.dll
[...]
Unload module X:\Client\Bin\ModuleA.dll at 161f0000
[...]
ModLoad: 161f0000 161f9000 X:\Client\Bin\ModuleA.dll
[...]
Unload module X:\Client\Bin\ModuleA.dll at 161f0000
[...]
ModLoad: 161f0000 161f9000 X:\Client\Bin\ModuleA.dll
[...]
Unload module X:\Client\Bin\ModuleA.dll at 161f0000
[...]
ModLoad: 171b0000 171b9000 X:\Client\Bin\ModuleA.dll
[...]
Unload module X:\Client\Bin\ModuleA.dll at 171b0000
[...]
ModLoad: 25180000 25189000 X:\Client\Bin\ModuleA.dll
[...]
Unload module X:\Client\Bin\ModuleA.dll at 25180000
[...]
ModLoad: 171b0000 171b9000 X:\Client\Bin\ModuleA.dll
[...]
Unload module X:\Client\Bin\ModuleA.dll at 171b0000
[...]
ModLoad: 171b0000 171b9000 X:\Client\Bin\ModuleA.dll
[...]
Unload module X:\Client\Bin\ModuleA.dll at 171b0000
[...]
[...]
[...]
ModLoad: 0df60000 0df69000 X:\Client\Bin\ModuleA.dll
[...]
Unload module X:\Client\Bin\ModuleA.dll at 0df60000
[...]
(f38.560): Access violation - code c0000005 (first chance)
---
--- 1st chance AccessViolation exception ----
[...]
We see the component ModuleA was loaded at different addresses and this looks similar to a singleton object factory with Create / Destroy operations that resembles heap operations Alloc and Free where every allocation can place the same object at a different address. This is why I call all this a component or module heap. The application was COM-based and every domain-specific object was implemented in a separate in-proc COM DLL. There were thousands of such objects.
PS. This story reminds me that when I learnt about COM in 90s I wanted to redesign my word processor written in C to have every paragraph, line and even word to be implemented as a COM object.
- Dmitry Vostokov @ DumpAnalysis.org + TraceAnalysis.org -
Thinking again about prescriptive value-added debugging and the sin of requesting yet another memory dump from a customer for the sake of curiosity (the so called “further analysis”):
Dump analysis matters, but business results matter more.
Aaron Erickson, The Nomadic Developer
- Dmitry Vostokov @ DumpAnalysis.org + TraceAnalysis.org -
Today we introduce an icon for Optimized Code pattern:
B/W
![]()
Color
![]()
- Dmitry Vostokov @ DumpAnalysis.org + TraceAnalysis.org -
I recently got a crying request from a reader of my blog to analyze the source of frequent bugchecks on a newly bought computer running Windows 7. I got 8 kernel minidumps with 5 different bugchecks. However, inspection of the default analysis revealed common Fault Context pattern of high resource consumption flight simulator processes in 6 minidumps. Most fault IPs were showing signs of Wild Code pattern and that most probably implicated Hardware Error (Looks like WinDbg suggests that MISALIGNED_IP implicates hardware). Here is the listing of relevant output fragments with attempts to disassemble code around IP (Instruction Pointer) to see if code make any sense (magenta color means the valid that should have been instead of misaligned code highlighted in red):
Windows 7 Kernel Version 7600 MP (4 procs) Free x86 compatible
Debug session time: Fri Jan 8 20:31:15.121 2010 (GMT+0)
System Uptime: 0 days 2:54:44.916
1: kd> !analyze -v
DRIVER_IRQL_NOT_LESS_OR_EQUAL (d1)
PROCESS_NAME: FlightSimulatorA.exe
CURRENT_IRQL: 2
TRAP_FRAME: 807e6ea4 -- (.trap 0xffffffff807e6ea4)
ErrCode = 00000002
eax=872082a7 ebx=80028d5f ecx=b3348635 edx=87208638 esi=80280001 edi=000082a7
eip=8d613485 esp=807e6f18 ebp=6f248635 iopl=0 nv up ei ng nz na po nc
cs=0008 ss=0010 ds=0023 es=0023 fs=0030 gs=0000 efl=00010282
USBPORT!USBPORT_Xdpc_End+0xa6:
8d613485 897904 mov dword ptr [ecx+4],edi ds:0023:b3348639=????????
Resetting default scope
STACK_TEXT:
807e6ea4 8d613485 badb0d00 87208638 82a7b334 nt!KiTrap0E+0x2cf
807e6f24 8d613d18 00000000 86358720 86358002 USBPORT!USBPORT_Xdpc_End+0xa6
807e6f48 82aa33b5 8635872c 86358002 00000000 USBPORT!USBPORT_Xdpc_Worker+0x173
807e6fa4 82aa3218 807c6120 87e7e950 00000000 nt!KiExecuteAllDpcs+0xf9
807e6ff4 82aa29dc 9f7e1ce4 00000000 00000000 nt!KiRetireDpcList+0xd5
807e6ff8 9f7e1ce4 00000000 00000000 00000000 nt!KiDispatchInterrupt+0x2c
WARNING: Frame IP not in any known module. Following frames may be wrong.
82aa29dc 00000000 0000001a 00d6850f bb830000 0x9f7e1ce4
Debug session time: Fri Jan 8 20:42:16.395 2010 (GMT+0)
System Uptime: 0 days 0:10:22.815
2: kd> !analyze -v
DRIVER_IRQL_NOT_LESS_OR_EQUAL (d1)
CURRENT_IRQL: 2
TRAP_FRAME: 8d91cbc4 -- (.trap 0xffffffff8d91cbc4)
ErrCode = 00000002
eax=00000000 ebx=8d901a00 ecx=86570108 edx=86570108 esi=8d905884 edi=86573920
eip=911e5f5d esp=8d91cc38 ebp=8d91cc78 iopl=0 nv up ei pl nz na po nc
cs=0008 ss=0010 ds=0023 es=0023 fs=0030 gs=0000 efl=00010202
HDAudBus!HdaController::NotificationDpc+0×14d:
911e5f5d ff ???
Resetting default scope
IMAGE_NAME: hardware
2: kd> u HDAudBus!HdaController::NotificationDpc+14d
HDAudBus!HdaController::NotificationDpc+0×14d:
911e5f5d ff ???
911e5f5e ff ???
911e5f5f ff6a00 jmp fword ptr [edx]
911e5f62 6a00 push 0
911e5f64 6a00 push 0
911e5f66 68ff000000 push 0FFh
911e5f6b 6a03 push 3
911e5f6d 6a04 push 4
2: kd> uf HDAudBus!HdaController::NotificationDpc
[...]
HDAudBus!HdaController::NotificationDpc+0x135:
911e5f45 8b45d8 mov eax,dword ptr [ebp-28h]
911e5f48 c6405400 mov byte ptr [eax+54h],0
911e5f4c 8b4dd8 mov ecx,dword ptr [ebp-28h]
911e5f4f 83c148 add ecx,48h
911e5f52 8a55e7 mov dl,byte ptr [ebp-19h]
911e5f55 ff1510a01e91 call dword ptr [HDAudBus!_imp_KfReleaseSpinLock (911ea010)]
HDAudBus!HdaController::NotificationDpc+0x14b:
911e5f5b e909ffffff jmp HDAudBus!HdaController::NotificationDpc+0x59 (911e5e69)
HDAudBus!HdaController::NotificationDpc+0x150:
911e5f60 6a00 push 0
911e5f62 6a00 push 0
911e5f64 6a00 push 0
911e5f66 68ff000000 push 0FFh
911e5f6b 6a03 push 3
911e5f6d 6a04 push 4
911e5f6f 6a08 push 8
911e5f71 6a02 push 2
911e5f73 e818180000 call HDAudBus!HDABusWmiLogETW (911e7790)
911e5f78 8b4df0 mov ecx,dword ptr [ebp-10h]
911e5f7b 64890d00000000 mov dword ptr fs:[0],ecx
911e5f82 59 pop ecx
911e5f83 5f pop edi
911e5f84 5e pop esi
911e5f85 5b pop ebx
911e5f86 8be5 mov esp,ebp
911e5f88 5d pop ebp
911e5f89 c21000 ret 10h
Debug session time: Fri Jan 8 21:32:04.096 2010 (GMT+0)
System Uptime: 0 days 0:49:10.517
1: kd> !analyze -v
KERNEL_MODE_EXCEPTION_NOT_HANDLED_M (1000008e)
Arg1: c000001d, The exception code that was not handled
EXCEPTION_CODE: (NTSTATUS) 0xc000001d - {EXCEPTION} Illegal Instruction An attempt was made to execute an illegal instruction.
TRAP_FRAME: a99e3644 -- (.trap 0xffffffffa99e3644)
ErrCode = 00000000
eax=000000fe ebx=8556a2b0 ecx=754764cd edx=00000001 esi=858ad008 edi=858ad048
eip=82ada4c2 esp=a99e36b8 ebp=a99e3704 iopl=0 nv up ei ng nz na po nc
cs=0008 ss=0010 ds=0023 es=0023 fs=0030 gs=0000 efl=00010282
nt!IopCompleteRequest+0×3ac:
82ada4c2 02cd add cl,ch
PROCESS_NAME: FlightSimulatorA.exe
CURRENT_IRQL: 1
MISALIGNED_IP:
nt!IopCompleteRequest+3ac
82ada4c2 02cd add cl,ch
IMAGE_NAME: hardware
1: kd> uf nt!IopCompleteRequest+3ac
nt!IopCompleteRequest+0×3a9:
82ada4bf 82680002 sub byte ptr [eax],2
82ada4c3 cd82 int 82h
82ada4c5 50 push eax
82ada4c6 ff75e0 push dword ptr [ebp-20h]
82ada4c9 57 push edi
82ada4ca e881830100 call nt!KeInitializeApc (82af2850)
82ada4cf 6a02 push 2
82ada4d1 6a00 push 0
82ada4d3 ff7628 push dword ptr [esi+28h]
82ada4d6 57 push edi
82ada4d7 e8d2830100 call nt!KeInsertQueueApc (82af28ae)
82ada4dc 33ff xor edi,edi
82ada4de eb5f jmp nt!IopCompleteRequest+0×429 (82ada53f)
1: kd> ub nt!IopCompleteRequest+3ac
^ Unable to find valid previous instruction for 'ub nt!IopCompleteRequest+3ac'
Debug session time: Sat Jan 9 07:45:24.155 2010 (GMT+0)
System Uptime: 0 days 2:09:39.576
0: kd> !analyze -v
UNEXPECTED_KERNEL_MODE_TRAP (7f)
Arg1: 0000000d, EXCEPTION_GP_FAULT
PROCESS_NAME: FlightSimulatorA.exe
CURRENT_IRQL: 6
STACK_TEXT:
a24b3bd8 90f9e956 badb0d00 00000000 ddf1ba50 nt!KiSystemFatalException+0xf
a24b3cc4 90f93f2b 00000001 00000004 00000004 HDAudBus!HDABusWmiLogETW+0x1c6
a24b3d08 82a817ad 864a6280 86541000 a24b3d34 HDAudBus!HdaController::Isr+0x2b
a24b3d08 20c40d61 864a6280 86541000 a24b3d34 nt!KiInterruptDispatch+0x6d
WARNING: Frame IP not in any known module. Following frames may be wrong.
1343f8ea 00000000 00000000 00000000 00000000 0x20c40d61
Debug session time: Sat Jan 9 08:52:03.454 2010 (GMT+0)
System Uptime: 0 days 1:05:54.249
0: kd> !analyze -v
IRQL_NOT_LESS_OR_EQUAL (a)
CURRENT_IRQL: 2
PROCESS_NAME: FlightSimulatorA.exe
TRAP_FRAME: 8078adf0 -- (.trap 0xffffffff8078adf0)
ErrCode = 00000002
eax=8632e2a6 ebx=00000000 ecx=880fb200 edx=00000118 esi=00000007 edi=8632e27c
eip=82a0c967 esp=8078ae64 ebp=c1e2baa0 iopl=0 nv up ei ng nz na pe nc
cs=0008 ss=0010 ds=0023 es=0023 fs=0030 gs=0000 efl=00010286
hal!HalBuildScatterGatherList+0xf3:
82a0c967 8901 mov dword ptr [ecx],eax ds:0023:880fb200=????????
Resetting default scope
STACK_TEXT:
8078adf0 82a0c967 badb0d00 00000118 82b5f466 nt!KiTrap0E+0x2cf
8078ae78 82a0cc16 880fb218 86379028 8632e260 hal!HalBuildScatterGatherList+0xf3
8078aea8 909b3e70 8651c6b0 86379028 8632e260 hal!HalGetScatterGatherList+0x26
8078aef4 909b3807 86379028 86379970 00000007 USBPORT!USBPORT_Core_iMapTransfer+0x21e
8078af24 909add18 86379028 86379970 86379002 USBPORT!USBPORT_Core_UsbMapDpc_Worker+0x1e3
8078af48 82aa73b5 8637997c 86379002 00000000 USBPORT!USBPORT_Xdpc_Worker+0x173
8078afa4 82aa7218 82b68d20 88139a98 00000000 nt!KiExecuteAllDpcs+0xf9
8078aff4 82aa69dc 9fd8cce4 00000000 00000000 nt!KiRetireDpcList+0xd5
8078aff8 9fd8cce4 00000000 00000000 00000000 nt!KiDispatchInterrupt+0x2c
WARNING: Frame IP not in any known module. Following frames may be wrong.
82aa69dc 00000000 0000001a 00d6850f bb830000 0x9fd8cce4
Debug session time: Sat Jan 9 16:34:48.134 2010 (GMT+0)
System Uptime: 0 days 1:53:05.929
1: kd> !analyze -v
DRIVER_IRQL_NOT_LESS_OR_EQUAL (d1)
CURRENT_IRQL: 2
PROCESS_NAME: firefox.exe
TRAP_FRAME: bb92449c -- (.trap 0xffffffffbb92449c)
ErrCode = 00000000
eax=000005b4 ebx=0db19ba0 ecx=80000000 edx=00000001 esi=85fdff29 edi=bb924530
eip=8bc7e2c7 esp=bb924510 ebp=bb924638 iopl=0 nv up ei ng nz na po nc
cs=0008 ss=0010 ds=0023 es=0023 fs=0030 gs=0000 efl=00010282
tcpip!TcpBeginTcbSend+0xa83:
8bc7e2c7 eb06 jmp tcpip!TcpBeginTcbSend+0xa8b (8bc7e2cf)
Resetting default scope
STACK_TEXT:
bb92449c 8bc7e2c7 badb0d00 00000001 00000000 nt!KiTrap0E+0x2cf
bb924638 8bc7d2bf 87b39c78 00000000 00000001 tcpip!TcpBeginTcbSend+0xa83
bb92479c 8bc814b5 87b39c78 00000000 00000001 tcpip!TcpTcbSend+0x426
bb9247bc 8bc7f349 87b39c78 87fa6c38 00000000 tcpip!TcpEnqueueTcbSendOlmNotifySendComplete+0x157
bb92481c 8bc81846 87b39c78 bb92491c 00000000 tcpip!TcpEnqueueTcbSend+0x3ca
bb924838 82a95f8a bb9248c8 96d9c9d2 00000000 tcpip!TcpTlConnectionSendCalloutRoutine+0x17
bb9248a0 8bc80a0b 8bc8182f bb9248c8 00000000 nt!KeExpandKernelStackAndCalloutEx+0x132
bb9248d8 908b5d27 87b39c01 bb924900 85572e18 tcpip!TcpTlConnectionSend+0x73
bb92493c 908bb2e3 00d4f1e0 85572e18 85572eac tdx!TdxSendConnection+0x1d7
bb924958 82a424bc 86236b80 85572e18 862389c0 tdx!TdxTdiDispatchInternalDeviceControl+0x115
bb924970 908d65ca 86d0e0c8 00000000 86238990 nt!IofCallDriver+0x63
WARNING: Stack unwind information not available. Following frames may be wrong.
bb9249c8 908d17f8 86238990 85572e18 85572ed0 aswTdi+0x55ca
bb924a28 82a424bc 862388d8 85572e18 8623f0e8 aswTdi+0x7f8
bb924a40 90935310 8623f030 82a424bc 8623f030 nt!IofCallDriver+0x63
bb924a60 90900a0e 2b1c89ba bb924b20 00000001 aswRdr+0x310
bb924ab0 908ed542 00000000 908ed542 87a5c530 afd!AfdFastConnectionSend+0x2a6
bb924c28 82c608f7 87ec6701 00000001 02b5f8cc afd!AfdFastIoDeviceControl+0x53d
bb924cd0 82c634ac 85a89c10 0000024c 00000000 nt!IopXxxControlFile+0x2d0
bb924d04 82a4942a 00000240 0000024c 00000000 nt!NtDeviceIoControlFile+0x2a
bb924d04 774464f4 00000240 0000024c 00000000 nt!KiFastCallEntry+0x12a
02b5f920 00000000 00000000 00000000 00000000 0x774464f4
1: kd> u 8bc7e2cf
tcpip!TcpBeginTcbSend+0xa8b:
8bc7e2cf 83bd18ffffff00 cmp dword ptr [ebp-0E8h],0
8bc7e2d6 0f84d1000000 je tcpip!TcpBeginTcbSend+0xb68 (8bc7e3ad)
8bc7e2dc 8d85f8feffff lea eax,[ebp-108h]
8bc7e2e2 3bf8 cmp edi,eax
8bc7e2e4 0f85c3000000 jne tcpip!TcpBeginTcbSend+0xb68 (8bc7e3ad)
8bc7e2ea 83bd54ffffff00 cmp dword ptr [ebp-0ACh],0
8bc7e2f1 0f84b6000000 je tcpip!TcpBeginTcbSend+0xb68 (8bc7e3ad)
8bc7e2f7 f7433c00002000 test dword ptr [ebx+3Ch],200000h
Debug session time: Sat Jan 9 19:42:50.817 2010 (GMT+0)
System Uptime: 0 days 3:07:23.612
3: kd> !analyze -v
BUGCODE_USB_DRIVER (fe)
USB Driver bugcheck, first parameter is USB bugcheck code.
Arguments:
Arg1: 00000006, USBBUGCODE_BAD_SIGNATURE An Internal data structure (object)
has been corrupted.
Arg2: 864b20e0, Object address
Arg3: 4f444648, Signature that was expected
Arg4: 00000000
PROCESS_NAME: System
CURRENT_IRQL: 2
STACK_TEXT:
8d952b8c 90fa1025 000000fe 00000006 864b20e0 nt!KeBugCheckEx+0x1e
8d952ba8 90fa6672 864b20e0 4f444668 4f444648 USBPORT!USBPORT_AssertSig+0x20
8d952bc8 90fa4553 864b2028 85c57d10 82a8b334 USBPORT!USBPORT_FlushAdapterDBs+0x1b
8d952c00 90fa5178 00000001 856e3ab8 87fb98c0 USBPORT!USBPORT_Core_iCompleteDoneTransfer+0x3cb
8d952c2c 90fa89af 864b2028 864b20f0 864b2a98 USBPORT!USBPORT_Core_iIrpCsqCompleteDoneTransfer+0x33b
8d952c54 90fa2d18 864b2028 864b2a98 864b2002 USBPORT!USBPORT_Core_UsbIocDpc_Worker+0xbc
8d952c78 82ab33b5 864b2aa4 864b2002 00000000 USBPORT!USBPORT_Xdpc_Worker+0x173
8d952cd4 82ab3218 8d936120 8d93b800 00000000 nt!KiExecuteAllDpcs+0xf9
8d952d20 82ab3038 00000000 0000000e 00000000 nt!KiRetireDpcList+0xd5
8d952d24 00000000 0000000e 00000000 00000000 nt!KiIdleLoop+0x38
Debug session time: Sun Jan 10 04:06:19.856 2010 (GMT+0)
System Uptime: 0 days 0:23:05.651
1: kd> !analyze -v
PAGE_FAULT_IN_NONPAGED_AREA (50)
PROCESS_NAME: FlightSimulatorB.exe
CURRENT_IRQL: 0
TRAP_FRAME: a127fa30 -- (.trap 0xffffffffa127fa30)
ErrCode = 00000000
eax=a127fec8 ebx=00000000 ecx=00000011 edx=86488ba0 esi=86488b78 edi=00000000
eip=8b83b87d esp=a127faa4 ebp=a127fab8 iopl=0 nv up ei ng nz na po nc
cs=0008 ss=0010 ds=0023 es=0023 fs=0030 gs=0000 efl=00010282
fltmgr!TreeFindNodeOrParent+0×9:
8b83b87d 0885c974498b or byte ptr mcupdate_GenuineIntel!_NULL_IMPORT_DESCRIPTOR <PERF> (mcupdate_GenuineIntel+0×764c9) (8b4974c9)[ebp],al ss:0010:2c716f81=??
Resetting default scope
MISALIGNED_IP:
fltmgr!TreeFindNodeOrParent+9
8b83b87d 0885c974498b or byte ptr mcupdate_GenuineIntel!_NULL_IMPORT_DESCRIPTOR <PERF> (mcupdate_GenuineIntel+0x764c9) (8b4974c9)[ebp],al
STACK_TEXT:
a127fa18 82a8d5f8 00000000 8b497414 00000000 nt!MmAccessFault+0x106
a127fa18 8b83b87d 00000000 8b497414 00000000 nt!KiTrap0E+0xdc
a127fab8 8b834340 86488ba4 86e5e458 00000000 fltmgr!TreeFindNodeOrParent+0x9
a127faf8 8b83440a 86488b78 86e5e458 00000000 fltmgr!GetContextFromStreamList+0x50
a127fb14 8b86c6da 86e5e458 86488b78 a127fb40 fltmgr!FltGetStreamContext+0x34
a127fb44 8b866b35 87f30718 a127fb98 a127fba8 fileinfo!FIStreamGet+0x36
a127fbac 8b833aeb 87f30718 a127fbcc a127fbf8 fileinfo!FIPreReadWriteCallback+0xf1
a127fc18 8b83617b a127fc54 85cfd738 a127fcac fltmgr!FltpPerformPreCallbacks+0x34d
a127fc30 8b848c37 0027fc54 8b848ad4 00000000 fltmgr!FltpPassThroughFastIo+0x3d
a127fc74 82c96b32 85cfd738 a127fcb4 00001000 fltmgr!FltpFastIoRead+0x163
a127fd08 82a8a42a 86e484c0 00000000 00000000 nt!NtReadFile+0x2d5
a127fd08 775864f4 86e484c0 00000000 00000000 nt!KiFastCallEntry+0x12a
WARNING: Frame IP not in any known module. Following frames may be wrong.
0202fc8c 00000000 00000000 00000000 00000000 0x775864f4
IMAGE_NAME: hardware
1: kd> u fltmgr!TreeFindNodeOrParent
fltmgr!TreeFindNodeOrParent:
8b83b874 8bff mov edi,edi
8b83b876 55 push ebp
8b83b877 8bec mov ebp,esp
8b83b879 8b4508 mov eax,dword ptr [ebp+8]
8b83b87c 8b08 mov ecx,dword ptr [eax]
8b83b87e 85c9 test ecx,ecx
8b83b880 7449 je fltmgr!TreeFindNodeOrParent+0×57 (8b83b8cb)
8b83b882 8b5510 mov edx,dword ptr [ebp+10h]
1: kd> ub 8b834340
fltmgr!GetContextFromStreamList+0x37:
8b834327 8bcb mov ecx,ebx
8b834329 ff15a4d0838b call dword ptr [fltmgr!_imp_ExfAcquirePushLockShared (8b83d0a4)]
8b83432f 33db xor ebx,ebx
8b834331 895dfc mov dword ptr [ebp-4],ebx
8b834334 ff7510 push dword ptr [ebp+10h]
8b834337 ff750c push dword ptr [ebp+0Ch]
8b83433a 57 push edi
8b83433b e896750000 call fltmgr!TreeLookup (8b83b8d6)
1: kd> uf 8b83b8d6
fltmgr!TreeLookup:
8b83b8d6 8bff mov edi,edi
8b83b8d8 55 push ebp
8b83b8d9 8bec mov ebp,esp
8b83b8db 8d4510 lea eax,[ebp+10h]
8b83b8de 50 push eax
8b83b8df ff7510 push dword ptr [ebp+10h]
8b83b8e2 ff750c push dword ptr [ebp+0Ch]
8b83b8e5 ff7508 push dword ptr [ebp+8]
8b83b8e8 e887ffffff call fltmgr!TreeFindNodeOrParent (8b83b874)
8b83b8ed 48 dec eax
8b83b8ee f7d8 neg eax
8b83b8f0 1bc0 sbb eax,eax
8b83b8f2 f7d0 not eax
8b83b8f4 234510 and eax,dword ptr [ebp+10h]
8b83b8f7 5d pop ebp
8b83b8f8 c20c00 ret 0Ch
- Dmitry Vostokov @ DumpAnalysis.org + TraceAnalysis.org -
In the case of multiple different faults like bugchecks and/or different crash points, stack traces and modules we can look at what is common among them. It could be their process context, which can easily be seen from the default analysis:
1: kd> !analyze -v
[...]
PROCESS_NAME: Application.exe
We give this pattern a name Fault Context. Then we can look whether an application is resource consumption intensive (could implicate hardware faults) like games and simulators or uses its own drivers (implicates latent corruption). In a production environment it can also be removed if it is functionally non-critical and can be avoided or replaced. See also a forthcoming case study.
- Dmitry Vostokov @ DumpAnalysis.org + TraceAnalysis.org -
Comments in italics are mine and express my own views, thoughts and opinions
Windows Internals by M. Russinovich, D. Solomon and A. Ionescu:
Limiting high-priority ready threads by a processor affinity (p. 391)
Thread dispatch reasons: ready, leaves running state, priority change, processor affinity change (p. 392)
Thread vs. process scheduling granularity (pp. 392 - 393)
Thread priority level 0 is reserved for zero page thread (p. 393)
2 pespectives on thread priority levels (pp. 393 - 394)
Changing CPU-intensive process base priority instead of priority of individual threads (p. 395)
Increased based priority for special processes (p. 395) - here is a comparison of base priorities between lsm.exe and smss.exe from x64 W2K8:
0: kd> !process fffffa80047ffc10
PROCESS fffffa80047ffc10
SessionId: 0 Cid: 0294 Peb: 7fffffd6000 ParentCid: 0238
DirBase: b1c4e000 ObjectTable: fffff88007f05cd0 HandleCount: 173.
Image: lsm.exe
VadRoot fffffa80046dd720 Vads 68 Clone 0 Private 462. Modified 0. Locked 0.
DeviceMap fffff88000007310
Token fffff88007f376f0
ElapsedTime 00:04:17.552
UserTime 00:00:00.015
KernelTime 00:00:00.000
QuotaPoolUsage[PagedPool] 69000
QuotaPoolUsage[NonPagedPool] 7072
Working Set Sizes (now,min,max) (1314, 50, 345) (5256KB, 200KB, 1380KB)
PeakWorkingSetSize 1318
VirtualSize 36 Mb
PeakVirtualSize 38 Mb
PageFaultCount 1375
MemoryPriority BACKGROUND
BasePriority 8
CommitCharge 756
0: kd> !process fffffa80046d9040
PROCESS fffffa80046d9040
SessionId: none Cid: 019c Peb: 7fffffdf000 ParentCid: 0004
DirBase: bccd5000 ObjectTable: fffff880005f45b0 HandleCount: 33.
Image: smss.exe
VadRoot fffffa80046d97e0 Vads 19 Clone 0 Private 96. Modified 24. Locked 0.
DeviceMap fffff88000007310
Token fffff88000964af0
ElapsedTime 00:04:40.343
UserTime 00:00:00.000
KernelTime 00:00:00.000
QuotaPoolUsage[PagedPool] 10392
QuotaPoolUsage[NonPagedPool] 1728
Working Set Sizes (now,min,max) (254, 50, 345) (1016KB, 200KB, 1380KB)
PeakWorkingSetSize 254
VirtualSize 6 Mb
PeakVirtualSize 16 Mb
PageFaultCount 458
MemoryPriority BACKGROUND
BasePriority 11
CommitCharge 127
Sleep(0) to relinquish the rest of quantum (p. 396)
Realtime Notepad (pp. 397 - 398) - I’m often asked why it doesn’t affect performance? This is because most threads in a system are waiting and notepad is waiting for window messages to process like keyboard and mouse. It is more noticeable when a realtime thread starts looping - it becomes scheduled every time
WSRM (Windows System Resource Manager) (pp. 398 - 399) - Looks good to prevent CPU spikes and memory leaks to come out of control
Thread priorities and IRQL (pp. 399 - 400) - in another words these concepts are orthogonal (independent from each other)
On The Same Page - coming to the same conclusion as another engineer when looking at a memory dump or a software trace. Literally means the same page of memory where an exception occurred or a stack trace is reconstructed or the same “page” when browsing a software trace output using a viewer.
Examples: Aha, we are on the same page!
- Dmitry Vostokov @ DumpAnalysis.org + TraceAnalysis.org -
Today we introduce an icon for Lateral Damage pattern:
B/W
![]()
Color
![]()
- Dmitry Vostokov @ DumpAnalysis.org + TraceAnalysis.org -