Comments in italics are mine and express my own views, thoughts and opinions
Windows Internals by M. Russinovich, D. Solomon and A. Ionescu:
Hard CPU limits per-session, -user and -system (pp. 444-445)
Security and user-interface limits on jobs (p. 447)
job objects (pp. 447 - 450) - we can dump all processes via !process 0 1 command and look for “Job ” in the output as on my x64 W2K8 system:
1: kd> !process 0 1
PROCESS fffffa8004e28c10

SessionId: 1  Cid: 0a70    Peb: 7fffffd8000  ParentCid: 09ec

DirBase: 93cfb000  ObjectTable: fffff88008ec2a20  HandleCount: 405.

Image: MSASCui.exe

VadRoot fffffa8004de0390 Vads 106 Clone 0 Private 1932. Modified 352. Locked 0.

DeviceMap fffff88008479c90

Token                             fffff88008edb060

ElapsedTime                       00:03:15.554

UserTime                          00:00:00.000

KernelTime                        00:00:00.000

QuotaPoolUsage[PagedPool]         197440

QuotaPoolUsage[NonPagedPool]      21728

Working Set Sizes (now,min,max)  (3259, 50, 345) (13036KB, 200KB, 1380KB)

PeakWorkingSetSize                3259

VirtualSize                       96 Mb

PeakVirtualSize                   96 Mb

PageFaultCount                    5245

MemoryPriority                    BACKGROUND

BasePriority                      8

CommitCharge                      2214

    Job                               fffffa80050f8860
PROCESS fffffa800511b260

SessionId: 1  Cid: 0a78    Peb: 7fffffd3000  ParentCid: 09ec

DirBase: 93dcb000  ObjectTable: fffff880089d4ae0  HandleCount: 128.

Image: wmdSync.exe

VadRoot fffffa800511aba0 Vads 77 Clone 0 Private 436. Modified 0. Locked 0.

DeviceMap fffff88008479c90

Token                             fffff88008ee1060

ElapsedTime                       00:03:15.429

UserTime                          00:00:00.000

KernelTime                        00:00:00.000

QuotaPoolUsage[PagedPool]         150088

QuotaPoolUsage[NonPagedPool]      7296

Working Set Sizes (now,min,max)  (1554, 50, 345) (6216KB, 200KB, 1380KB)

PeakWorkingSetSize                1558

VirtualSize                       75 Mb

PeakVirtualSize                   76 Mb

PageFaultCount                    1643

MemoryPriority                    BACKGROUND

BasePriority                      8

CommitCharge                      584

    Job                               fffffa80050f8860
PROCESS fffffa8005120a30

SessionId: 1  Cid: 0a88    Peb: 7efdf000  ParentCid: 09ec

DirBase: 923cd000  ObjectTable: fffff88008e29560  HandleCount:  99.

Image: daemon.exe

VadRoot fffffa8004a8cba0 Vads 96 Clone 0 Private 843. Modified 0. Locked 0.

DeviceMap fffff88008479c90

Token                             fffff88008eed730

ElapsedTime                       00:03:14.976

UserTime                          00:00:00.000

KernelTime                        00:00:00.000

QuotaPoolUsage[PagedPool]         175272

QuotaPoolUsage[NonPagedPool]      9024

Working Set Sizes (now,min,max)  (2608, 50, 345) (10432KB, 200KB, 1380KB)

PeakWorkingSetSize                2615

VirtualSize                       92 Mb

PeakVirtualSize                   94 Mb

PageFaultCount                    3463

MemoryPriority                    BACKGROUND

BasePriority                      8

CommitCharge                      1397

    Job                               fffffa80050f8860
PROCESS fffffa80051b5640

SessionId: 1  Cid: 0b98    Peb: 7efdf000  ParentCid: 09ec

DirBase: 8e371000  ObjectTable: fffff8800910ced0  HandleCount:  59.

Image: WZQKPICK.EXE

VadRoot fffffa80051c1630 Vads 58 Clone 0 Private 215. Modified 0. Locked 0.

DeviceMap fffff88008479c90

Token                             fffff8800910c860

ElapsedTime                       00:03:00.903

UserTime                          00:00:00.000

KernelTime                        00:00:00.000

QuotaPoolUsage[PagedPool]         123744

QuotaPoolUsage[NonPagedPool]      5376

Working Set Sizes (now,min,max)  (1274, 50, 345) (5096KB, 200KB, 1380KB)

PeakWorkingSetSize                1274

VirtualSize                       62 Mb

PeakVirtualSize                   63 Mb

PageFaultCount                    1304

MemoryPriority                    BACKGROUND

BasePriority                      8

CommitCharge                      331

    Job                               fffffa80050f8860
PROCESS fffffa800530e040

SessionId: 0  Cid: 0bcc    Peb: 7fffffd6000  ParentCid: 0328

DirBase: 12c7cc000  ObjectTable: fffff880097c19e0  HandleCount: 193.

Image: WmiPrvSE.exe

VadRoot fffffa80053864c0 Vads 107 Clone 0 Private 766. Modified 0. Locked 0.

DeviceMap fffff88007fe7530

Token                             fffff8800995f060

ElapsedTime                       00:00:27.349

UserTime                          00:00:00.000

KernelTime                        00:00:00.000

QuotaPoolUsage[PagedPool]         102888

QuotaPoolUsage[NonPagedPool]      10176

Working Set Sizes (now,min,max)  (2338, 50, 345) (9352KB, 200KB, 1380KB)

PeakWorkingSetSize                2338

VirtualSize                       56 Mb

PeakVirtualSize                   56 Mb

PageFaultCount                    2724

MemoryPriority                    BACKGROUND

BasePriority                      8

CommitCharge                      1359

    Job                               fffffa8004d71560
1: kd> !job fffffa8004d71560

Job at fffffa8004d71560

TotalPageFaultCount      0

TotalProcesses           1

ActiveProcesses          1

TotalTerminatedProcesses 0

LimitFlags               2b08

MinimumWorkingSetSize    0

MaximumWorkingSetSize    0

ActiveProcessLimit       20

PriorityClass            0

UIRestrictionsClass      0

SecurityLimitFlags       0

Token                    0000000000000000
1: kd> !job fffffa80050f8860

Job at fffffa80050f8860

TotalPageFaultCount      0

TotalProcesses           4

ActiveProcesses          4

TotalTerminatedProcesses 0

LimitFlags               1000

MinimumWorkingSetSize    0

MaximumWorkingSetSize    0

ActiveProcessLimit       0

PriorityClass            0

UIRestrictionsClass      0

SecurityLimitFlags       0

Token                    0000000000000000
1: kd> dt _EJOB fffffa80050f8860

nt!_EJOB

+0x000 Event            : _KEVENT

+0x018 JobLinks         : _LIST_ENTRY [ 0xfffff800`019c2450 - 0xfffffa80`04d71578 ]

+0x028 ProcessListHead  : _LIST_ENTRY [ 0xfffffa80`04e28e58 - 0xfffffa80`051b5888 ]

+0x038 JobLock          : _ERESOURCE

+0x0a0 TotalUserTime    : _LARGE_INTEGER 0x0

+0x0a8 TotalKernelTime  : _LARGE_INTEGER 0x0

+0x0b0 ThisPeriodTotalUserTime : _LARGE_INTEGER 0x0

+0x0b8 ThisPeriodTotalKernelTime : _LARGE_INTEGER 0x0

+0x0c0 TotalPageFaultCount : 0

+0x0c4 TotalProcesses   : 4

+0x0c8 ActiveProcesses  : 4

+0x0cc TotalTerminatedProcesses : 0

+0x0d0 PerProcessUserTimeLimit : _LARGE_INTEGER 0x0

+0x0d8 PerJobUserTimeLimit : _LARGE_INTEGER 0x0

+0x0e0 LimitFlags       : 0x1000

+0x0e8 MinimumWorkingSetSize : 0

+0x0f0 MaximumWorkingSetSize : 0

+0x0f8 ActiveProcessLimit : 0

+0x100 Affinity         : 0

+0x108 PriorityClass    : 0 ''

+0x110 AccessState      : (null)

+0x118 UIRestrictionsClass : 0

+0x11c EndOfJobTimeAction : 0

+0x120 CompletionPort   : (null)

+0x128 CompletionKey    : (null)

+0x130 SessionId        : 1

+0x134 SchedulingClass  : 5

+0x138 ReadOperationCount : 0

+0x140 WriteOperationCount : 0

+0x148 OtherOperationCount : 0

+0x150 ReadTransferCount : 0

+0x158 WriteTransferCount : 0

+0x160 OtherTransferCount : 0

+0x168 ProcessMemoryLimit : 0

+0x170 JobMemoryLimit   : 0

+0x178 PeakProcessMemoryUsed : 0x912

+0x180 PeakJobMemoryUsed : 0x11b3

+0x188 CurrentJobMemoryUsed : 0x11ae

+0x190 MemoryLimitsLock : _EX_PUSH_LOCK

+0x198 JobSetLinks      : _LIST_ENTRY [ 0xfffffa80`050f89f8 - 0xfffffa80`050f89f8 ]

+0x1a8 MemberLevel      : 0

+0x1ac JobFlags         : 1
C2 reqs: SLF - DAC - SAC - ORP (p. 452) - mnemonic to remember perhaps for security exams like CISSP
B reqs: TPF - TFM (p. 453)
Security targets and protection profiles (p. 453)
Advanced .NET Debugging by M. Hewardt:
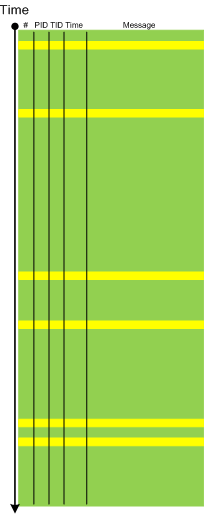
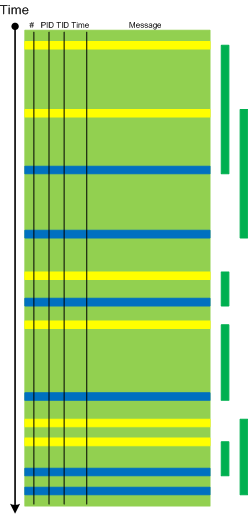
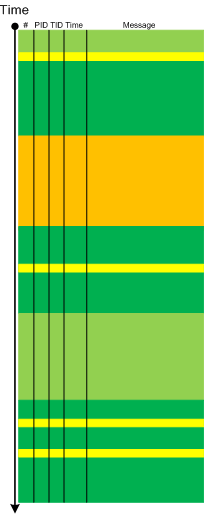
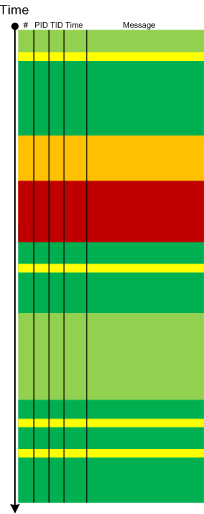
type handle as a pointer to method table (p. 53) - I liked managed heap - execution engine boundary and propose this colored space diagram (will add this to Dictionary of Debugging soon as a tripartite “virtual” memory division):
!DumpModule command (p. 57)
!U command (pp. 58 - 59)
!DumpMT command (p. 59)
!DumpMT -md to dump type method descriptors (p. 60)
!DumpMD command (p. 60)
m_CodeOrIL: 00920070 (p. 61) - the address looks like as UNICODE string but I belive this is just a coincidence, the false positive of Wild Pointer pattern: http://www.dumpanalysis.org/blog/index.php/2008/03/11/crash-dump-analysis-patterns-part-55/