Microsoft gives sneak preview of Debugging Studio
April 1st, 2008This looks really cool:
http://www.microsoft.com/whdc/devstudio/default.mspx
- Dmitry Vostokov @ DumpAnalysis.org -
This looks really cool:
http://www.microsoft.com/whdc/devstudio/default.mspx
- Dmitry Vostokov @ DumpAnalysis.org -
Citrix CDF traces are based on ETW (Event Tracing for Windows) and therefore Citrix customers, their support personnel and developers can use MS TraceView tool for troubleshooting Citrix terminal service environments:
Viewing Common Diagnostics Facility (CDF) Traces Using TraceView
In cases with slow logon or slow process startup we can analyze process launch sequence to determine delays. In the output trace we can filter tzhook module messages which also contain session id (this is quite handy to differentiate between different sessions), for example:
PID      TID      TIME          MESSAGE

21864    21912    06:34:53.598  tzhook: Attach on process - cmd.exe session=51

21620    20372    06:34:59.754  tzhook: Attach on process - acregl.exe session=51

18668    21240    06:35:02.704  tzhook: Attach on process - cmstart.exe session=51

18560    18832    06:35:02.735  tzhook: Attach on process - wfshell.exe session=51

18204    20060    06:35:06.575  tzhook: Attach on process - icast.exe session=51

20640    21104    06:35:07.717  tzhook: Attach on process - LOGON.EXE session=51

21188    21032    06:35:07.938  tzhook: Attach on process - cscript.exe session=51

21888    19592    06:35:11.157  tzhook: Attach on process - WScript.exe session=51

20600    20732    06:35:11.780  tzhook: Attach on process - admin.exe session=51

17976    20456    06:35:18.752  tzhook: Attach on process - winlogon.exe session=53

21332    13156    06:35:51.625  tzhook: Attach on process - mpnotify.exe session=53

10988    10732    06:35:57.043  tzhook: Attach on process - rundll32.exe session=53
Here is another process launch sequence for published Notepad application:
PID     TID     TIME            MESSAGE

15828   18720   15:34:02.637    tzhook: Attach on process - winlogon.exe session=2

5300    18508   15:34:03.043    tzhook: Attach on process - mpnotify.exe session=2

17948   19300   15:34:03.356    tzhook: Attach on process - userinit.exe session=2

17956   19316   15:34:03.415    tzhook: Attach on process - cmd.exe session=2

5384    5324    15:34:03.443    tzhook: Attach on process - cmd.exe session=2

19432   19264   15:34:03.461    tzhook: Attach on process - SSONSVR.EXE session=2

12480   7472    15:34:03.466    tzhook: Attach on process - cmd.exe session=2

19448   19364   15:34:03.474    tzhook: Attach on process - net.exe session=2

19416   19656   15:34:03.489    tzhook: Attach on process - acregl.exe session=2

19480   19596   15:34:03.544    tzhook: Attach on process - cmstart.exe session=2

664     19512   15:34:03.559    tzhook: Attach on process - wfshell.exe session=2

19904   13140   15:34:03.610    tzhook: Attach on process - net.exe session=2

6864    20036   15:34:03.746    tzhook: Attach on process - icast.exe session=2

19540   20016   15:34:03.749    tzhook: Attach on process - ctfmon.exe session=2

19944   19032   15:34:03.757    tzhook: Attach on process - net.exe session=2

10232   18356   15:34:03.787    tzhook: Attach on process - notepad.exe session=2
Such sequences are also useful to determine a process upon which the session initialization or startup sequence hangs. In this case a user dump of that process might be useful.
Of course we can do all this with Process Monitor and other similar tools but here we get other Citrix related trace messages as well. All in one.
- Dmitry Vostokov @ DumpAnalysis.org -
I was very busy this month with the forthcoming Memory Dump Analysis Anthology Volume 1 plus I had a business trip to Redmond and therefore I really didn’t have enough time to contribute well to other my blogs. Nevertheless I finished reading Incompleteness book during my transatlantic flights, started reading two others and here is the small update:
LiterateScientist Blog:
Incompleteness: The Proof and Paradox of Kurt Godel
ManagementBits Blog:
The Science of Career Promotions
- Dmitry Vostokov @ DumpAnalysis.org -
This is an attempt to revive the forum closed a year ago due to the lack of interest during that time. Now the number of visitors has increased by an order of magnitude and I get more and more requests to help with crash dump analysis but I cannot guarantee immediate response. Therefore I upgraded and reopened Crash Dump Analysis and Debugging Forum and encourage using it. In order to prevent spammers gaining access any new registration has to be approved by me (usually in less than 24 hours).
- Dmitry Vostokov @ DumpAnalysis.org -
Just noticed that this month Addison-Wesley Professional reprints in paperback its out of stock hardcover book originally published in 1999:
Developing Windows NT Device Drivers: A Programmer’s Handbook (paperback)

Highly recommended. Almost all book material is still relevant today even in the light of new WDF model. Please also see my post Moving to kernel space (updated references).
- Dmitry Vostokov @ DumpAnalysis.org -
Just a short note. Suppose we have a complete memory dump and we want to check critical sections to see any anomalies. We can do this by using !for_each_process extension command:
0: kd> !for_each_process ".process /r /p @#Process; !ntsdexts.locks"

Implicit process is now a59a4648

Loading User Symbols
NTSDEXTS: Unable to resolve ntdll!RtlCriticalSectionList

NTSDEXTS: Please check your symbols

Implicit process is now a553cd88

Loading User Symbols

....
Scanned 11 critical sections

Implicit process is now a518b1b0

Loading User Symbols

....
Scanned 105 critical sections

Implicit process is now a513a348

Loading User Symbols

....
Scanned 977 critical sections

Implicit process is now a5659d88

Loading User Symbols

....
Scanned 438 critical sections

Implicit process is now a551abb8

Loading User Symbols

....

...

...

...

...
Here the first NTSDEXTS warning is normal because we don’t have user space for System process.
- Dmitry Vostokov @ DumpAnalysis.org -
Sometimes we have processes that actively monitor debugger attachments to prevent reverse engineering and terminate themselves if such attempts are detected. Some of them use very simple methods to achieve this like creating a thread that periodically calls IsDebuggerPresent API or waits for debugger events. In such cases attempts of any application to actively attach to these processes result in their termination.
Consider the following stack trace from the postmortem crash dump saved by NTSD on Windows Server 2003:
0:000> kL

ChildEBP RetAddr

00fefbcc 098b84a1 kernel32!RaiseException+0x53

...

...

...

00fefd28 0116a86a component!_CRT_INIT+0x187

00fefd6c 0116a8e6 component!__DllMainCRTStartup+0xb7

00fefd74 7c81a352 component!_DllMainCRTStartup+0x1d

00fefd94 7c830e70 ntdll!LdrpCallInitRoutine+0x14

00fefe4c 77e668a3 ntdll!LdrShutdownProcess+0x182

00feff38 77e66905 kernel32!_ExitProcess+0x43

00feff4c 00561ab9 kernel32!ExitProcess+0x14

00feffb8 77e64829 application!foo+0x41

00feffec 00000000 kernel32!BaseThreadStart+0x34
Disassembling application!foo shows the call to WaitForDebugEvent API:
0:000> u application!foo

application!foo:

00561a78 push    ebp

00561a79 mov     ebp,esp

00561a7b sub     esp,60h

00561a7e push    0FFFFFFFFh

00561a80 lea     eax,[ebp-60h]

00561a83 push    eax

00561a84 call    dword ptr [application!_imp__WaitForDebugEvent (00655224)]

00561a8a mov     eax,dword ptr [ebp+8]
We also see it on the raw stack which might also help in more complex cases:
0:000> !teb

TEB at 7ffdd000

    ExceptionList:        00fefbf8

    StackBase:            00ff0000

    StackLimit:           00fef000

    SubSystemTib:         00000000

    FiberData:            00001e00

    ArbitraryUserPointer: 00000000

    Self:                 7ffdd000

    EnvironmentPointer:   00000000

    ClientId:             000063fc . 00003270

    RpcHandle:            00000000

    Tls Storage:          00000000

    PEB Address:          7ffdb000

    LastErrorValue:       0

    LastStatusValue:      c0000034

    Count Owned Locks:    0

    HardErrorMode:        0
0:000> dds 00fef000 00ff0000

...

...

...

00fefecc  00000000

00fefed0  00feff48

00fefed4  77e9c4d7 kernel32!WaitForDebugEvent+0×66

00fefed8  c0000008

00fefedc  00000000

00fefee0  77e41ef3 kernel32!SleepEx+0×91

00fefee4  00000000

00fefee8  00000000

…

…

…
How would we find what process was trying to attach to our application? Let’s go with pure crash dump analysis approach. We can take the advantage of RaiseException call and get a kernel or a complete memory dump to examine all running processes and their threads. In order to model this I created a small program that simulates the behavior shown above:
// IsDebuggerPresent64
#include "stdafx.h"

#include "windows.h"
int _tmain(int argc, _TCHAR* argv[])

{

    while (1)

    {

        IsDebuggerPresent()

            ? puts ("Yes"),

                RaiseException(0x12345678,

                    0, 0, NULL)

            : puts ("No");

        Sleep(5000);

    }
    return 0;

}
Then I configured Process Monitoring Rules in Userdump Process Dumper Control Panel applet to bugcheck the system after dumping:
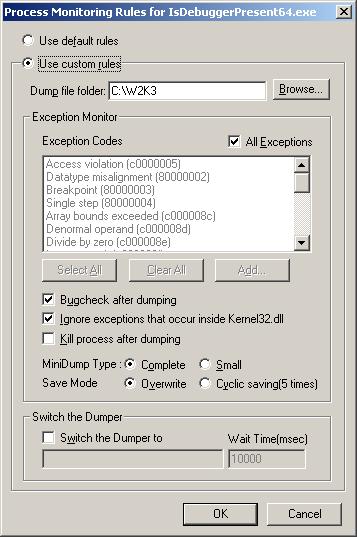
Then I asked one of my friends to debug the running instance of that application and let me know if there was any sudden BSOD. Indeed there was one and I got my complete memory dump (although kernel dump would suffice here). Let’s look at it.
We see that our process has an open debug port and its main thread is suspended:
kd> !process /r /p fffffadfe73f9c20

PROCESS fffffadfe73f9c20

    SessionId: 0  Cid: 0e4c    Peb: 7fffffd4000  ParentCid: 0e54

    DirBase: 2c472000  ObjectTable: fffffa80006f1690  HandleCount:  12.

    Image: IsDebuggerPresent64.exe

    VadRoot fffffadfe6ef3e30 Vads 26 Clone 0 Private 97. Modified 0. Locked 0.

    DeviceMap fffffa8000930540

    Token                             fffffa80030e7910

    ElapsedTime                       00:00:03.062

    UserTime                          00:00:00.000

    KernelTime                        00:00:00.000

    QuotaPoolUsage[PagedPool]         16288

    QuotaPoolUsage[NonPagedPool]      3488

    Working Set Sizes (now,min,max)  (1322, 50, 345) (5288KB, 200KB, 1380KB)

    PeakWorkingSetSize                1322

    VirtualSize                       7 Mb

    PeakVirtualSize                   7 Mb

    PageFaultCount                    1314

    MemoryPriority                    BACKGROUND

    BasePriority                      8

    CommitCharge                      107

    DebugPort                         fffffadfe6ec9040
THREAD fffffadfe69a2bf0  Cid 0e4c.0e74  Teb: 000007fffffde000 Win32Thread: 0000000000000000 WAIT: (Unknown) KernelMode Non-Alertable

SuspendCount 1

    fffffadfe69a2e90  Semaphore Limit 0×2

Not impersonating

DeviceMap                 fffffa8000930540

Owning Process            fffffadfe73f9c20       Image:         IsDebuggerPresent64.exe

Wait Start TickCount      37247          Ticks: 49 (0:00:00:00.765)

Context Switch Count      45

UserTime                  00:00:00.000

KernelTime                00:00:00.000

Win32 Start Address IsDebuggerPresent64 (0×00000001400013b0)

Start Address kernel32!BaseProcessStart (0×0000000077d59620)

Stack Init fffffadfdf7b5e00 Current fffffadfdf7b54f0

Base fffffadfdf7b6000 Limit fffffadfdf7b0000 Call 0
Priority 12 BasePriority 8 PriorityDecrement 2

Child-SP          RetAddr           Call Site

fffffadf`df7b5530 fffff800`0103b063 nt!KiSwapContext+0x85

fffffadf`df7b56b0 fffff800`0103c403 nt!KiSwapThread+0xc3

fffffadf`df7b56f0 fffff800`0105dc7c nt!KeWaitForSingleObject+0x528

fffffadf`df7b5780 fffff800`0105db2b nt!KiSuspendThread+0x2c

fffffadf`df7b57c0 fffff800`01058e71 nt!KiDeliverApc+0x20a

fffffadf`df7b5840 fffff800`0103c403 nt!KiSwapThread+0xde

fffffadf`df7b5880 fffffadf`dfd4a20c nt!KeWaitForSingleObject+0x528

fffffadf`df7b5910 fffffadf`dfd4a3be userdump!UdpCompleteExceptionForwarding+0x11c

fffffadf`df7b5990 fffffadf`dfd49dd8 userdump!UdpForwardException+0x13e

fffffadf`df7b59c0 fffff800`012ce9cf userdump!UdIoctl+0x618

fffffadf`df7b5a70 fffff800`012df026 nt!IopXxxControlFile+0xa5a

fffffadf`df7b5b90 fffff800`010410fd nt!NtDeviceIoControlFile+0x56

fffffadf`df7b5c00 00000000`77ef0a5a nt!KiSystemServiceCopyEnd+0x3 (TrapFrame @ fffffadf`df7b5c70)
If we search for a process that has NtWaitForDebugEvent function present on one of its stack traces we would find the debugger:
kd> !stacks 2 nt!NtWaitForDebugEvent

...

...

...

                [fffffadfe63da3b0 ntsd.exe]

 e54.000e50  fffffadfe6afbbf0 ffff6e8a Blocked    nt!KiSwapContext+0×85

                nt!KiSwapThread+0xc3

                nt!KeWaitForSingleObject+0×528

                nt!NtWaitForDebugEvent+0×342

                nt!KiSystemServiceCopyEnd+0×3

                ntdll!ZwWaitForDebugEvent+0xa

                dbgeng!LiveUserDebugServices::WaitForEvent+0xee

                dbgeng!LiveUserTargetInfo::WaitForEvent+0×488

                dbgeng!RawWaitForEvent+0×23c

                dbgeng!DebugClient::WaitForEvent+0×96

                ntsd!MainLoop+0xb7

                ntsd!main+0×18e

                ntsd!mainCRTStartup+0×171

                kernel32!BaseProcessStart+0×29
We see that it is NTSD.
- Dmitry Vostokov @ DumpAnalysis.org -
Ceteris Paribus means “with other things [being] the same” (Latin) and when applied to software troubleshooting and debugging means equal environment and configuration. My favorite example is troubleshooting an issue using two Citrix CDF traces (ETW based): one is for the problem and another for the expected behavior. Say we have a terminal services connectivity problem where a published application doesn’t start on the one particular server in Citrix farm. Here Ceteris Paribus means that the application, connection method, configuration, user name, and so on, are all the same for both traces.
Looks like I have used Latin to obfuscate something obvious but surely many engineers forget it when facing complex issues. This equally applies to debugging as well.
- Dmitry Vostokov @ DumpAnalysis.org -
The case when a function pointer or a return address becomes a Wild Pointer and EIP or RIP value lies in a valid region of memory the execution path may continue through a region called Wild Code. This might loop on itself or eventually reach non-executable or invalid pages and produce an exception. Local Buffer Overflow might lead to this behavior and also data corruption that overwrites function pointers with valid memory addresses.
My favorite example is when a function pointer points to zeroed pages with EXECUTE page attribute. What will happen next when we dereference it? All zeroes are perfect x86/x64 code:
0:001> dd 0000000`771afdf0

00000000`771afdf0  00000000 00000000 00000000 00000000

00000000`771afe00  00000000 00000000 00000000 00000000

00000000`771afe10  00000000 00000000 00000000 00000000

00000000`771afe20  00000000 00000000 00000000 00000000

00000000`771afe30  00000000 00000000 00000000 00000000

00000000`771afe40  00000000 00000000 00000000 00000000

00000000`771afe50  00000000 00000000 00000000 00000000

00000000`771afe60  00000000 00000000 00000000 00000000
0:001> u

ntdll!DbgUserBreakPoint:

00000000`771afe00 0000    add     byte ptr [rax],al

00000000`771afe02 0000    add     byte ptr [rax],al

00000000`771afe04 0000    add     byte ptr [rax],al

00000000`771afe06 0000    add     byte ptr [rax],al

00000000`771afe08 0000    add     byte ptr [rax],al

00000000`771afe0a 0000    add     byte ptr [rax],al

00000000`771afe0c 0000    add     byte ptr [rax],al

00000000`771afe0e 0000    add     byte ptr [rax],al
Now if RAX points to a valid memory page with WRITE attribute the code will modify the first byte at that address:
0:001> dq @rax

000007ff`fffdc000 00000000`00000000 00000000`035a0000

000007ff`fffdc010 00000000`0359c000 00000000`00000000

000007ff`fffdc020 00000000`00001e00 00000000`00000000

000007ff`fffdc030 000007ff`fffdc000 00000000`00000000

000007ff`fffdc040 00000000`0000142c 00000000`00001504

000007ff`fffdc050 00000000`00000000 00000000`00000000

000007ff`fffdc060 000007ff`fffd8000 00000000`00000000

000007ff`fffdc070 00000000`00000000 00000000`00000000
Therefore the code will be perfectly executed:
0:001> t

ntdll!DbgBreakPoint+0x2:

00000000`771afdf2 0000    add     byte ptr [rax],al ds:000007ff`fffdc000=00
0:001> t

ntdll!DbgBreakPoint+0x4:

00000000`771afdf4 0000    add     byte ptr [rax],al ds:000007ff`fffdc000=00
0:001> t

ntdll!DbgBreakPoint+0x6:

00000000`771afdf6 0000    add     byte ptr [rax],al ds:000007ff`fffdc000=00
0:001> t

ntdll!DbgBreakPoint+0x8:

00000000`771afdf8 0000    add     byte ptr [rax],al ds:000007ff`fffdc000=00
0:001> t

ntdll!DbgBreakPoint+0xa:

00000000`771afdfa 0000    add     byte ptr [rax],al ds:000007ff`fffdc000=00
- Dmitry Vostokov @ DumpAnalysis.org -
Symbolless Analysis is another anti-pattern when an engineer either in a hurry or due to laziness doesn’t apply proper symbols and relies only on timestamps and module/offsets or trusts what WinDbg says and ignores symbol warnings. I usually apply symbols even in obvious cases and in hard ones strive to apply them until all possibilities are exhausted including search using PDBFinder.
Another weak variant is called Imageless Analysis when an engineer doesn’t specify proper Executable Image Search Path when it is necessary perhaps due to ignorance or just plain laziness again. Please see Minidump Analysis example for proper minidump analysis.
- Dmitry Vostokov @ DumpAnalysis.org -
When we have a crash dump WinDbg tells us the time of the crash:
1: kd> vertarget

Windows Vista Kernel Version 6000 MP (2 procs) Free x64

Product: WinNt, suite: TerminalServer SingleUserTS

Built by: 6000.16575.amd64fre.vista_gdr.071009-1548

Kernel base = 0xfffff800`01c00000 PsLoadedModuleList = 0xfffff800`01d9af70

Debug session time: Tue Jan 29 11:03:52.572 2008 (GMT+0)

System Uptime: 0 days 0:12:06.648
However I couldn’t find the similar command in GDB documentation.
One option is to check core file timestamp. For kernel core files perhaps there is some kernel variable we can examine too (I’m interested in FreeBSD here).
If anyone knows about GDB command that shows the time of a crash or any other method please let me know. Any hints are greatly appreciated!
- Dmitry Vostokov @ DumpAnalysis.org -
It may appear that I have announced too many titles but they all fall into the well-defined publishing roadmap (excluding a couple of publishing digressions like Debugware book):
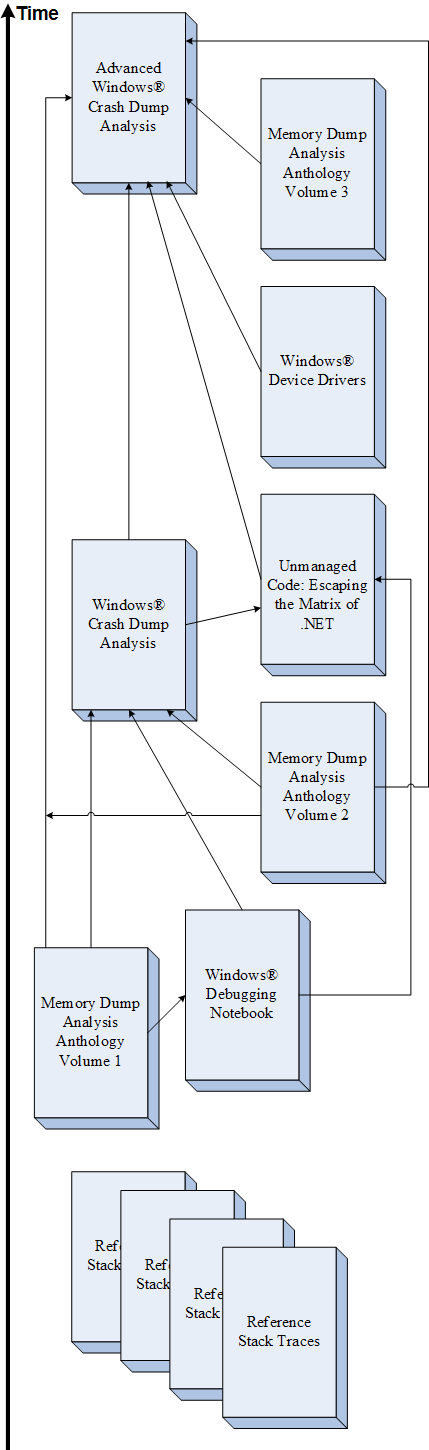
This is a high level illustration of global incremental and iterative parts of IIPP (Iterative and Incremental Publishing Process) that I coined some months earlier. More about local iterative and incremental parts in one of my next posts.
- Dmitry Vostokov @ DumpAnalysis.org -
This is planned for publication after Windows® Crash Dump Analysis book. Preliminary information is:
(*) subject to change
- Dmitry Vostokov @ DumpAnalysis.org -
Microsoft is looking for 5 Windows Internals SME to help them with their special project. Details can be found on CPR Team blog:
Wanted: Windows Internals subject matter experts
- Dmitry Vostokov @ DumpAnalysis.org -
Although the first volume has not been published yet (scheduled for 15th of April, 2008) the planning for the second volume has already begun. Preliminary information is:
Hardcover version is also planned. PDF version will be available for download too.
(*) subject to change
- Dmitry Vostokov @ DumpAnalysis.org -
There is a good Microsoft white paper about !ndiskd commands to interrogate kernel dumps:
Applying !ndiskd.protocols command we can see that there are more protocols added to Vista:
Windows Server 2003 SP2:
kd> !ndiskd.protocols

 Protocol 862db330: NDISUIO

    Open 86420650 - Miniport: 862e2ab0 AMD PCNET Family PCI Ethernet Adapter
 Protocol 86324780: TCPIP_WANARP

    Open 86324008 - Miniport: 863a2130 WAN Miniport (IP)
 Protocol 86318790: TCPIP

    Open 8637c008 - Miniport: 862e2ab0 AMD PCNET Family PCI Ethernet Adapter
 Protocol 863e3c28: NDPROXY

    Open 8639e0d0 - Miniport: 86361530 Direct Parallel

    Open 8639bb48 - Miniport: 86361530 Direct Parallel

    Open 863e48b0 - Miniport: 863e3130 WAN Miniport (L2TP)

    Open 86404008 - Miniport: 863e3130 WAN Miniport (L2TP)
Protocol 863a9d80: RASPPPOE
 Protocol 863a9008: NDISWAN

    Open 863e3ab0 - Miniport: 86361530 Direct Parallel

    Open 86398c30 - Miniport: 862c4530 WAN Miniport (PPTP)

    Open 864618f8 - Miniport: 8637a870 WAN Miniport (PPPOE)

    Open 86468a28 - Miniport: 863e3130 WAN Miniport (L2TP)
Vista:
1: kd> !ndiskd.protocols

 Protocol fffffa8004569580: RSPNDR

    Open fffffa8004566a20 - Miniport: fffffa80039711a0 Broadcom NetXtreme 57xx Gigabit Controller
 Protocol fffffa80043a4900: LLTDIO

    Open fffffa800428a1d0 - Miniport: fffffa80039711a0 Broadcom NetXtreme 57xx Gigabit Controller
 Protocol fffffa8003f6c820: WANARPV6

    Open fffffa8003f1c010 - Miniport: fffffa800399f1a0 WAN Miniport (IPv6)
 Protocol fffffa8003f6cd20: WANARP

    Open fffffa8003f1c670 - Miniport: fffffa80039d61a0 WAN Miniport (IP)
 Protocol fffffa8003eedb10: TCPIP6TUNNEL

    Open fffffa8003f33010 - Miniport: fffffa800396c1a0 isatap.company.com

    Open fffffa8003f0f010 - Miniport: fffffa80038f21a0 Teredo Tunneling Pseudo-Interface
Protocol fffffa8003eeb580: TCPIPTUNNEL
 Protocol fffffa8003eeb010: TCPIP6

    Open fffffa8003f452e0 - Miniport: fffffa80039711a0 Broadcom NetXtreme 57xx Gigabit Controller
 Protocol fffffa8003ee90d0: TCPIP

    Open fffffa8003ffc480 - Miniport: fffffa80039711a0 Broadcom NetXtreme 57xx Gigabit Controller
 Protocol fffffa8003c56010: NDPROXY

    Open fffffa8003d41450 - Miniport: fffffa800399d1a0 WAN Miniport (L2TP)

    Open fffffa8003d41a30 - Miniport: fffffa800399d1a0 WAN Miniport (L2TP)
Protocol fffffa80039ad790: RASPPPOE
 Protocol fffffa80039af4e0: NDISWAN

    Open fffffa8004737a10 - Miniport: fffffa8004a321a0 RAS Async Adapter

    Open fffffa8003bf8ac0 - Miniport: fffffa80039c21a0 WAN Miniport (PPTP)

    Open fffffa8003c5cac0 - Miniport: fffffa80039c01a0 WAN Miniport (PPPOE)

    Open fffffa8003c565a0 - Miniport: fffffa800399d1a0 WAN Miniport (L2TP)
I noticed this extension when I got a bugcheck from the 3rd-party custom protocol driver:
SYSTEM_PTE_MISUSE (da)

The stack trace identifies the guilty driver.

Arguments:

Arg1: 00000400, Type of error.

Arg2: f7a9a413

Arg3: 00000001

Arg4: 00000000
0: kd> kL

ChildEBP RetAddr

f5c68a68 8083b6e1 nt!KeBugCheckEx+0x1b

f5c68a90 8083d478 nt!MiRemoveIoSpaceMap+0x5d

f5c68b38 f5b6ebea nt!MmUnmapIoSpace+0x10c

WARNING: Stack unwind information not available. Following frames may be wrong.

f5c68b90 f5b69abe protocol!foo2+0x28ac

f5c68bf4 f70fd4be protocol!foo+0x1aa0

f5c68c90 f70fd2fc NDIS!ndisInitializeBinding+0x189

f5c68d18 f70fce48 NDIS!ndisCheckAdapterBindings+0xd9

f5c68d98 f70fca66 NDIS!ndisCheckProtocolBindings+0xd2

f5c68dac 80949b7c NDIS!ndisWorkerThread+0x74

f5c68ddc 8088e062 nt!PspSystemThreadStartup+0x2e

00000000 00000000 nt!KiThreadStartup+0x16
Arg1 0×400 one tells us this (from WinDbg help):
| 0×400 | The base address of the I/O space mapping | The number of pages to be freed | 0 | (Windows XP and later only) The caller is trying to free an I/O space mapping that the system is unaware of. |
PTE looks unknown indeed:
0: kd> !pte f7a9a413

VA f7a9a413

PDE at 00000000C0603DE8 PTE at 00000000C07BD4D0

contains 0000000000A87863 contains 0000000000000000

pfn a87 —DA–KWEV
We can see this protocol in the list:
0: kd> !ndiskd.protocols

 Protocol 89df10a0: CustomProtocol

    Open 89b4e6d8 - Miniport: 8a59d290 Broadcom BCM5708S NetXtreme II GigE (NDIS VBD Client)
Protocol 8918f248: NDISUIO
 Protocol 89dd8008: TCPIP_WANARP

    Open 8a4da6f0 - Miniport: 8a50a9e8 WAN Miniport (IP)
Protocol 89b4ec88: TCPIP
 Protocol 8a4cd5a0: NDPROXY

    Open 8a59b128 - Miniport: 8a58eab0 Direct Parallel

    Open 8a59b328 - Miniport: 8a58eab0 Direct Parallel

    Open 8a4f1580 - Miniport: 8a58a328 WAN Miniport (L2TP)

    Open 8a507008 - Miniport: 8a58a328 WAN Miniport (L2TP)
Protocol 8a4e7008: RASPPPOE
 Protocol 8a5cb490: NDISWAN

    Open 8a59b988 - Miniport: 8a58eab0 Direct Parallel

    Open 8a5976c0 - Miniport: 8a591628 WAN Miniport (PPTP)

    Open 8a594468 - Miniport: 8a4e93f0 WAN Miniport (PPPOE)

    Open 8a4d3580 - Miniport: 8a58a328 WAN Miniport (L2TP)
- Dmitry Vostokov @ DumpAnalysis.org -
This morning I got the following bugcheck on my home Apple MacMini running Windows Vista:
IRQL_NOT_LESS_OR_EQUAL (a)

An attempt was made to access a pageable (or completely invalid) address at an interrupt request level (IRQL) that is too high.  This is usually caused by drivers using improper addresses.

If a kernel debugger is available get the stack backtrace.

Arguments:

Arg1: a112883e, memory referenced

Arg2: 0000001b, IRQL

Arg3: 00000000, bitfield :

 bit 0 : value 0 = read operation, 1 = write operation

 bit 3 : value 0 = not an execute operation, 1 = execute operation (only on chips which support this level of status)

Arg4: 81c28750, address which referenced memory
READ_ADDRESS: a112883e Paged pool
The address belongs to paged pool indeed:
0: kd> !pool a112883e

Pool page a112883e region is Paged pool

 a1128000 size:  6d0 previous size:    0  (Allocated)  Toke (Protected)

 a11286d0 size:    8 previous size:  6d0  (Free)       SeSd

 a11286d8 size:   a8 previous size:    8  (Allocated)  SpSy

 a1128780 size:   10 previous size:   a8  (Free)       AlEB

*a1128790 size:  1a0 previous size:   10  (Allocated) *KFlt

  Owning component : Unknown (update pooltag.txt)

 a1128930 size:  6d0 previous size:  1a0  (Allocated)  Toke (Protected)
Search for KFlt tag points to KeyMagic.sys:
C:\Windows\system32>findstr /S /m /l hKFlt *.sys

drivers\KeyMagic.sys

DriverStore\FileRepository\keymagic.inf_c8736569\KeyMagic.sys
When we look at the trap address we notice that it seems to be valid:
TRAP_FRAME:  85bdf8e8 -- (.trap 0xffffffff85bdf8e8)

ErrCode = 00000000

eax=a1128828 ebx=00000001 ecx=81d323c0 edx=00000000 esi=84ca6f38 edi=84ca6f40

eip=81c28750 esp=85bdf95c ebp=85bdf970 iopl=0 nv up ei pl zr na pe nc

cs=0008 ss=0010 ds=0023 es=0023 fs=0030 gs=0000  efl=00010246

nt!KeSetEvent+0x4d:

81c28750 385816          cmp     byte ptr [eax+16h],bl      ds:0023:a112883e=01
However as explained in Another look at page faults post we have a page in transition and this violates IRQL contract:
0: kd> !pte a112883e

               VA a112883e

PDE at 00000000C0602840    PTE at 00000000C0508940

contains 000000001CEC5863  contains 000000001AFB48C2

pfn 1cec5 ---DA--KWEV                           not valid

                       Transition: 1afb4

                       Protect: 6 - ReadWriteExecute
When we look at stack trace parameters we notice that the first parameter passed to KeSetEvent function belongs to nonpaged pool:
STACK_TEXT:

85bdf8e8 81c28750 badb0d00 00000000 00000000 nt!KiTrap0E+0x2ac

85bdf970 876394df 84ca6f0000000000 00000000 nt!KeSetEvent+0×4d

WARNING: Stack unwind information not available. Following frames may be wrong.

85bdf98c 8763a145 84ca68a0 8399e3b8 85bdf9ac KeyMagic+0×14df

85bdf99c 806f57a0 7b359920 7c98c800 85bdf9d4 KeyMagic+0×2145

85bdf9ac 806f514e 8399e3b8 8070e2a0 8399e3b8 Wdf01000!FxPkgPnp::PnpEventFailedOwnHardware+0×3b
0: kd> !pool 84ca6f00

Pool page 84ca6f00 region is Nonpaged pool

 84ca6000 size:  2b8 previous size:    0  (Allocated)  Thre (Protected)

 84ca62b8 size:   10 previous size:  2b8  (Free)       ....

 84ca62c8 size:   48 previous size:   10  (Allocated)  Vadl

 84ca6310 size:   30 previous size:   48  (Allocated)  Ntfn

 84ca6340 size:   38 previous size:   30  (Allocated)  usbp

 84ca6378 size:   98 previous size:   38  (Allocated)  NDam

 84ca6410 size:  188 previous size:   98  (Allocated)  NDoa

 84ca6598 size:    8 previous size:  188  (Free)       FOCX

 84ca65a0 size:   30 previous size:    8  (Allocated)  UHUB

 84ca65d0 size:   20 previous size:   30  (Allocated)  Wnln

 84ca65f0 size:   28 previous size:   20  (Allocated)  Io

 84ca6618 size:   18 previous size:   28  (Allocated)  Ala6

 84ca6630 size:   98 previous size:   18  (Allocated)  NDam

*84ca66c8 size:  938 previous size:   98  (Allocated) *KeyM

  Owning component : Unknown (update pooltag.txt)
However it is not a pointer to a valid _KEVENT structure:
0: kd> dt -r _KEVENT 84ca6f00

Wdf01000!_KEVENT

   +0x000 Header           : _DISPATCHER_HEADER

      +0x000 Type             : 0xc8 ''

      +0x001 Abandoned        : 0x87 ''

      +0x001 Absolute         : 0x87 ''

      +0x001 NpxIrql          : 0x87 ''

      +0x001 Signalling       : 0x87 ''

      +0x002 Size             : 0x12 ''

      +0x002 Hand             : 0x12 ''

      +0x003 Inserted         : 0xa1 ''

      +0x003 DebugActive      : 0xa1 ''

      +0x003 DpcActive        : 0xa1 ''

      +0x000 Lock             : -1592621112

      +0x004 SignalState      : -1592621112

      +0x008 WaitListHead     : _LIST_ENTRY [ 0x40000 - 0x0 ]

         +0x000 Flink            : 0x00040000 _LIST_ENTRY

         +0x004 Blink            : (null)
Moreover we see from disassembly and nonpaged pool entry contents that KeSetEvent function tried to dereference wrong WaitListHead that points to paged pool (the same pool entry that caused the bugcheck):
0: kd> uf nt!KeSetEvent

nt!KeSetEvent:

81c28703 mov     edi,edi

81c28705 push    ebp

81c28706 mov     ebp,esp

81c28708 push    ecx

81c28709 push    ecx

81c2870a push    ebx

81c2870b push    esi

81c2870c mov     esi,dword ptr [ebp+8]

81c2870f xor     ebx,ebx

81c28711 inc     ebx

81c28712 cmp     byte ptr [esi],0

81c28715 push    edi

81c28716 jne     nt!KeSetEvent+0x27 (81c2872a)
nt!KeSetEvent+0x15:

81c28718 cmp     dword ptr [esi+4],ebx

81c2871b jne     nt!KeSetEvent+0x27 (81c2872a)
nt!KeSetEvent+0x1a:

81c2871d cmp     byte ptr [ebp+10h],0

81c28721 jne     nt!KeSetEvent+0x27 (81c2872a)
nt!KeSetEvent+0x20:

81c28723 mov     eax,ebx

81c28725 jmp     nt!KeSetEvent+0xcf (81c287d6)
nt!KeSetEvent+0x27:

81c2872a xor     ecx,ecx

81c2872c call    dword ptr [nt!_imp_KeAcquireQueuedSpinLockRaiseToSynch (81c010a4)]

81c28732 mov     byte ptr [ebp+8],al ; clears the first byte of 84ca6f00 so PKEVENT could have been any 84ca6fXX

81c28735 mov     eax,dword ptr [esi+4]

81c28738 test    eax,eax

81c2873a mov     dword ptr [ebp-4],eax

81c2873d mov     dword ptr [esi+4],ebx

81c28740 jne     nt!KeSetEvent+0×9a (81c287a1)
nt!KeSetEvent+0x3f:

81c28742 lea     edi,[esi+8]

81c28745 cmp     dword ptr [edi],edi

81c28747 je      nt!KeSetEvent+0x9a (81c287a1)
nt!KeSetEvent+0x46:

81c28749 cmp     byte ptr [esi],0

81c2874c mov     eax,dword ptr [edi]

81c2874e jne     nt!KeSetEvent+0x70 (81c28775)
nt!KeSetEvent+0x4d:

81c28750 cmp     byte ptr [eax+16h],bl

81c28753 mov     ecx,dword ptr [eax+8]

81c28756 push    dword ptr [ebp+0Ch]

81c28759 jne     nt!KeSetEvent+0x5e (81c28761)
nt!KeSetEvent+0x58:

81c2875b movzx   edx,word ptr [eax+14h]

81c2875f jmp     nt!KeSetEvent+0x63 (81c28766)
nt!KeSetEvent+0x5e:

81c28761 mov     edx,100h
nt!KeSetEvent+0x63:

81c28766 call    nt!KiUnwaitThread (81ca9097)

81c2876b mov     eax,dword ptr [edi]

81c2876d cmp     eax,edi

81c2876f je      nt!KeSetEvent+0x9a (81c287a1)
nt!KeSetEvent+0x6e:

81c28771 jmp     nt!KeSetEvent+0x4d (81c28750)
nt!KeSetEvent+0x70:

81c28775 cmp     byte ptr [eax+16h],bl

81c28778 mov     ecx,dword ptr [eax+8]

81c2877b push    dword ptr [ebp+0Ch]

81c2877e je      nt!KeSetEvent+0x8d (81c28794)
nt!KeSetEvent+0x7b:

81c28780 mov     edx,100h

81c28785 call    nt!KiUnwaitThread (81ca9097)

81c2878a mov     eax,dword ptr [edi]

81c2878c cmp     eax,edi

81c2878e je      nt!KeSetEvent+0x9a (81c287a1)
nt!KeSetEvent+0x8b:

81c28790 jmp     nt!KeSetEvent+0x70 (81c28775)
nt!KeSetEvent+0x8d:

81c28794 and     dword ptr [esi+4],0

81c28798 movzx   edx,word ptr [eax+14h]

81c2879c call    nt!KiUnwaitThread (81ca9097)
nt!KeSetEvent+0x9a:

81c287a1 cmp     byte ptr [ebp+10h],0

81c287a5 je      nt!KeSetEvent+0xb2 (81c287b9)
nt!KeSetEvent+0xa0:

81c287a7 mov     eax,dword ptr fs:[00000124h]

81c287ad mov     cl,byte ptr [ebp+8]

81c287b0 or      dword ptr [eax+68h],8

81c287b4 mov     byte ptr [eax+5Eh],cl

81c287b7 jmp     nt!KeSetEvent+0xcc (81c287d3)
nt!KeSetEvent+0xb2:

81c287b9 mov     ecx,dword ptr fs:[20h]

81c287c0 add     ecx,418h

81c287c6 call    nt!KeReleaseQueuedSpinLockFromDpcLevel (81c8bf0c)

81c287cb push    dword ptr [ebp+8]

81c287ce call    nt!KiExitDispatcher (81ca9c12)
nt!KeSetEvent+0xcc:

81c287d3 mov     eax,dword ptr [ebp-4]
nt!KeSetEvent+0xcf:

81c287d6 pop     edi

81c287d7 pop     esi

81c287d8 pop     ebx

81c287d9 leave

81c287da ret     0Ch
0: kd> dd 84ca6f00 84ca6fff

84ca6f00 a11287c8 a11287c8 00040000 00000000

84ca6f10 a11287e0 a11287e0 00040000 00000000

84ca6f20 a11287f8 a11287f8 00040000 00000000

84ca6f30 a1128810 a1128810 00040000 00000001

84ca6f40 a1128828 a1128828 00040000 00000000

84ca6f50 a1128840 a1128840 00040000 00000000

84ca6f60 a1128858 a1128858 00040000 00000000

84ca6f70 a1128888 a1128888 00040000 00000000

84ca6f80 a11288a0 a11288a0 00040000 00000000

84ca6f90 a1128870 a1128870 00040000 00000000

84ca6fa0 a11288b8 a11288b8 00040000 00000000

84ca6fb0 a11288d0 a11288d0 00040000 00000000

84ca6fc0 a11288e8 a11288e8 00040000 00000000

84ca6fd0 a1128900 a1128900 00040000 00000000

84ca6fe0 a1128918 a1128918 5e55aec0 6003be28

84ca6ff0 60181fe8 00000000 00000000 00000000
0: kd> !pool a11287c8

Pool page a11287c8 region is Paged pool

 a1128000 size:  6d0 previous size:    0  (Allocated)  Toke (Protected)

 a11286d0 size:    8 previous size:  6d0  (Free)       SeSd

 a11286d8 size:   a8 previous size:    8  (Allocated)  SpSy

 a1128780 size:   10 previous size:   a8  (Free)       AlEB

*a1128790 size:  1a0 previous size:   10  (Allocated) *KFlt

  Owning component : Unknown (update pooltag.txt)

 a1128930 size:  6d0 previous size:  1a0  (Allocated)  Toke (Protected)
Let’s look at our stack trace:
0: kd> !thread 82f49020 1f

THREAD 82f49020  Cid 0004.0034  Teb: 00000000 Win32Thread: 00000000 RUNNING on processor 0

IRP List:

    8391e008: (0006,02b0) Flags: 00000000  Mdl: 00000000

Not impersonating

DeviceMap                 85c03048

Owning Process            82f00ab0       Image:         System

Wait Start TickCount      4000214        Ticks: 0

Context Switch Count      21886

UserTime                  00:00:00.000

KernelTime                00:00:00.421

Win32 Start Address nt!ExpWorkerThread (0x81c78ea3)

Stack Init 85be0000 Current 85bdf7c0 Base 85be0000 Limit 85bdd000 Call 0

Priority 14 BasePriority 12 PriorityDecrement 0 IoPriority 2 PagePriority 5

ChildEBP RetAddr

85bdf8e8 81c28750 nt!KiTrap0E+0x2ac (TrapFrame @ 85bdf8e8)

85bdf970 876394df nt!KeSetEvent+0x4d

WARNING: Stack unwind information not available. Following frames may be wrong.

85bdf98c 8763a145 KeyMagic+0x14df

85bdf99c 806f57a0 KeyMagic+0x2145

85bdf9ac 806f514e Wdf01000!FxPkgPnp::PnpEventFailedOwnHardware+0x3b

85bdf9d4 806f5ea9 Wdf01000!FxPkgPnp::PnpEnterNewState+0x15c

85bdf9fc 806f61b3 Wdf01000!FxPkgPnp::PnpProcessEventInner+0x1f5

85bdfa20 806ecf6b Wdf01000!FxPkgPnp::PnpProcessEvent+0x1c8

85bdfa2c 806f34b4 Wdf01000!FxPkgPnp::PnpSurpriseRemoval+0x29

85bdfa38 806edf86 Wdf01000!FxPkgFdo::_PnpSurpriseRemoval+0x10

85bdfa5c 806d7d0a Wdf01000!FxPkgPnp::Dispatch+0x26e

85bdfa68 806d7f0f Wdf01000!FxDevice::Dispatch+0x7f

85bdfa84 81c27f83 Wdf01000!FxDevice::DispatchWithLock+0x5d

85bdfa9c a4966e7f nt!IofCallDriver+0x63

85bdfac0 a496c9ae hidbth!HidBthCallDriverSynchronous+0x55

85bdfae0 85ac5a5d hidbth!HidBthPnP+0x68

85bdfaf4 85acd4c2 HIDCLASS!HidpCallDriver+0x3f

85bdfb10 85acd62e HIDCLASS!HidpFdoPnp+0x60

85bdfb20 85ac64fd HIDCLASS!HidpIrpMajorPnp+0x1e

85bdfb30 81c27f83 HIDCLASS!HidpMajorHandler+0x79

85bdfb48 81daf465 nt!IofCallDriver+0x63

85bdfb7c 81daf6cb nt!IopSynchronousCall+0xce

85bdfbd8 81da5da4 nt!IopRemoveDevice+0xd5

85bdfc00 81da5c97 nt!PnpSurpriseRemoveLockedDeviceNode+0xbd

85bdfc14 81da5f17 nt!PnpDeleteLockedDeviceNode+0x1f

85bdfc44 81daa554 nt!PnpDeleteLockedDeviceNodes+0x4c

85bdfd04 81daabe1 nt!PnpProcessQueryRemoveAndEject+0x572

85bdfd1c 81da9743 nt!PnpProcessTargetDeviceEvent+0x38

85bdfd44 81c78fa0 nt!PnpDeviceEventWorker+0x201

85bdfd7c 81e254e0 nt!ExpWorkerThread+0xfd

85bdfdc0 81c9159e nt!PspSystemThreadStartup+0x9d

00000000 00000000 nt!KiThreadStartup+0x16
IRP and device examination shows that KeyMagic is a lower filter driver to bluetooth HID driver and an upper filter driver to BthEnum (see Bluetooth Driver Stack WDK article):
0: kd> !irp 8391e008

Irp is active with 16 stacks 14 is current (= 0x8391e24c)

 No Mdl: No System Buffer: Thread 82f49020:  Irp stack trace.

     cmd  flg cl Device   File     Completion-Context

 [  0, 0]   0  0 00000000 00000000 00000000-00000000
   Args: 00000000 00000000 00000000 00000000

 [  0, 0]   0  0 00000000 00000000 00000000-00000000
   Args: 00000000 00000000 00000000 00000000

 [  0, 0]   0  0 00000000 00000000 00000000-00000000
   Args: 00000000 00000000 00000000 00000000

 [  0, 0]   0  0 00000000 00000000 00000000-00000000
   Args: 00000000 00000000 00000000 00000000

 [  0, 0]   0  0 00000000 00000000 00000000-00000000
   Args: 00000000 00000000 00000000 00000000

 [  0, 0]   0  0 00000000 00000000 00000000-00000000
   Args: 00000000 00000000 00000000 00000000

 [  0, 0]   0  0 00000000 00000000 00000000-00000000
   Args: 00000000 00000000 00000000 00000000

 [  0, 0]   0  0 00000000 00000000 00000000-00000000
   Args: 00000000 00000000 00000000 00000000

 [  0, 0]   0  0 00000000 00000000 00000000-00000000
   Args: 00000000 00000000 00000000 00000000

 [  0, 0]   0  0 00000000 00000000 00000000-00000000
   Args: 00000000 00000000 00000000 00000000

 [  0, 0]   0  0 00000000 00000000 00000000-00000000
   Args: 00000000 00000000 00000000 00000000

 [  0, 0]   0  0 00000000 00000000 00000000-00000000
   Args: 00000000 00000000 00000000 00000000

 [  0, 0]   0  0 00000000 00000000 00000000-00000000
   Args: 00000000 00000000 00000000 00000000

>[ 1b,17]   0 e1 a1b9b120 00000000 a4966d36-85bdfab0 Success Error Cancel pending

        \Driver\KeyMagic hidbth!HidBthSynchronousCompletion

   Args: 00000000 00000000 00000000 00000000

 [ 1b,17]   0  0 8a1fc030 00000000 00000000-00000000

        \Driver\HidBth

   Args: 00000000 00000000 00000000 00000000

 [ 1b,17]   0  0 8a1fc030 00000000 00000000-00000000

        \Driver\HidBth

   Args: 00000000 00000000 00000000 00000000
0: kd> !devobj 8a1fc030

Device object (8a1fc030) is for:

 _HID00000006 \Driver\HidBth DriverObject 836225e0

Current Irp 00000000 RefCount 0 Type 00000022 Flags 00002050

Dacl 85c60218 DevExt 8a1fc0e8 DevObjExt 8a1fce98

ExtensionFlags (0x00000800)

                             Unknown flags 0x00000800

AttachedTo (Lower) a1b9b120 \Driver\KeyMagic

Device queue is not busy.
0: kd> !devobj a1b9b120

Device object (a1b9b120) is for:

  \Driver\KeyMagic DriverObject 83712d70

Current Irp 00000000 RefCount 0 Type 00000022 Flags 00002004

DevExt 84ca68a0 DevObjExt a1b9b1f0

ExtensionFlags (0x00000800)

                             Unknown flags 0x00000800

AttachedDevice (Upper) 8a1fc030 \Driver\HidBth

AttachedTo (Lower) 8a1ef030 \Driver\BthEnum

Device queue is not busy.
0: kd> !devstack 8a1ef030

  !DevObj   !DrvObj            !DevExt   ObjectName

  8a1fc030  \Driver\HidBth     8a1fc0e8  _HID00000006

  a1b9b120  \Driver\KeyMagic   84ca68a0

> 8a1ef030  \Driver\BthEnum    8a1ef0e8  00000068
lmv command doesn’t show detailed module information:
0: kd> lmv m KeyMagic

start    end        module name

87638000 87642000   KeyMagic   (no symbols)

    Loaded symbol image file: KeyMagic.sys

    Image path: \SystemRoot\system32\DRIVERS\KeyMagic.sys

    Image name: KeyMagic.sys

    Timestamp:        Thu Aug 30 22:59:01 2007 (46D73DA5)

    CheckSum:         0000B906

    ImageSize:        0000A000

    Translations:     0000.04b0 0000.04e0 0409.04b0 0409.04e0
But dumping the module contents shows more (Unknown Component pattern):
0: kd> dc 87638000 87642000

...

...

...

8763b120  \.r.e.g.i.s.t.r.

8763b130  y.\.m.a.c.h.i.n.

8763b140  e.\.S.y.s.t.e.m.

8763b150  \.C.u.r.r.e.n.t.

8763b160  C.o.n.t.r.o.l.S.

8763b170  e.t.\.S.e.r.v.i.

8763b180  c.e.s.\.k.e.y.m.

8763b190  a.g.i.c.....FILT

8763b1a0  ER_EXTENSION....

8763b1b0  NEW_LAYOUT..OLD_

8763b1c0  LAYOUT..UNKNOWN_

8763b1d0  LAYOUT..EXTERNAL

8763b1e0  _BLUETOOTH..EXTE

8763b1f0  RNAL_CORDED.INTE

8763b200  RNAL....UNKNOWN_

8763b210  TYPE....JIS.ANSI

8763b220  ....ISO.UNKNOWN_

8763b230  LANG............

8763b240  u.....%.........

8763b250  ................

8763b260  ............K.m.

8763b270  d.f.L.i.b.r.a.r.

8763b280  y...RSDS.....W.M

8763b290  .V..A..e....c:\b

8763b2a0  wa\applekeyboard

8763b2b0  win-200.1.4\srcr

8763b2c0  oot\applekeyboar

8763b2d0  d\objfre_wlh_x86

8763b2e0  \i386\KeyMagic.p

8763b2f0  db…………..

8763b300  …………….

…

…

…
Therefore we have enough evidence for KeyMagic.sys to contact the vendor for updates or remove it. The latter is better because I don’t use Apple wireless keyboard but the driver is present on my system. To be absolutely sure we can enable IRQL checking in Driver Verifier for KeyMagic.sys.
- Dmitry Vostokov @ DumpAnalysis.org -
Main site www.dumpanalysis.org has undergone the small “redesign” to become more like the blog BSOD theme. Enjoy ![]()
- Dmitry Vostokov @ DumpAnalysis.org -
Why do we need yet another book about device drivers? There are couple of reasons here:
Old books are more about developing the narrow range of legacy drivers than troubleshooting and debugging them.
New books shift towards WDF and ignore legacy drivers.
Windows Internals book is too big and something lightweight is desperately needed.
No published driver books use UML as communication device and discuss driver developement as software factory.
Existing books mostly view device drivers as hardware device drivers.
I started collecting and organizing information about Windows drivers 2 years ago and published a few selected materials so you can get an approximate flavour of what is expected in the forthcoming book scheduled for the next year:
- Dmitry Vostokov @ DumpAnalysis.org -
This is a forthcoming reference book for technical support and escalation engineers troubleshooting and debugging complex software issues. The book is also invaluable for software maintenance and development engineers debugging unmanaged, managed and native code.
- Dmitry Vostokov @ DumpAnalysis.org -