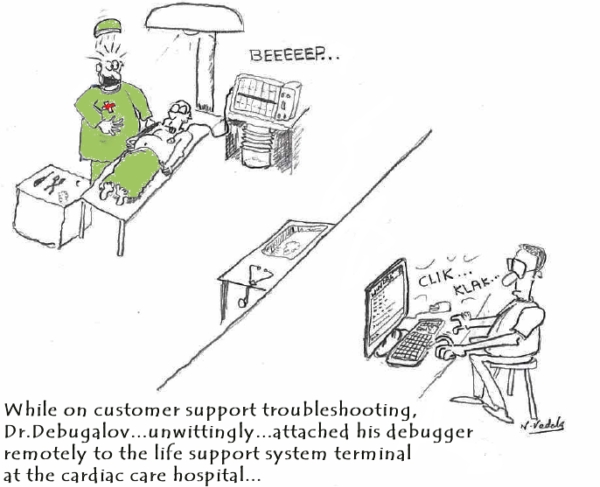
Dr. Debugalov fights against small bugs
July 23rd, 2008New cartoon from Narasimha Vedala based on a real event (click on it to enlarge):
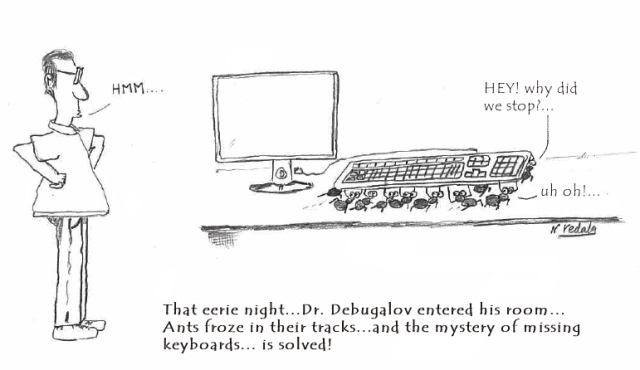
Mysteriously Missing Keyboard
- Dmitry Vostokov @ DumpAnalysis.org -
New cartoon from Narasimha Vedala based on a real event (click on it to enlarge):
Mysteriously Missing Keyboard
- Dmitry Vostokov @ DumpAnalysis.org -
When a process experienced an unhandled exception what were the possible reasons for a postmortem debugger not saving a crash dump? One of them will be illustrated in this post. The process AppA was hanging and causing another process AppB to hang too (see Coupled Processes pattern). If we look at AppA locked critical sections we would see a loader deadlock:
0:000> !locks
CritSec ntdll!LdrpLoaderLock+0 at 7c889d94

WaiterWoken        No

LockCount          8

RecursionCount     2

OwningThread       4534

EntryCount         0

ContentionCount    a3e

*** Locked
CritSec ntdll!FastPebLock+0 at 7c889d40

WaiterWoken        No

LockCount          2

RecursionCount     1

OwningThread       3eb4

EntryCount         0

ContentionCount    15

*** Locked
   3  Id: 30b0.3eb4 Suspend: 1 Teb: 7ffdb000 Unfrozen

ChildEBP RetAddr  Args to Child

00b3e11c 7c822124 7c83970f 0000004c 00000000 ntdll!KiFastSystemCallRet

00b3e120 7c83970f 0000004c 00000000 00000000 ntdll!NtWaitForSingleObject+0xc

00b3e15c 7c839620 00000000 00000004 00000001 ntdll!RtlpWaitOnCriticalSection+0×19c

00b3e17c 7c832ad0 7c889d94 09150000 7c889e0c ntdll!RtlEnterCriticalSection+0xa8

00b3e1b0 77e68de4 00000001 00000000 00b3e1ec ntdll!LdrLockLoaderLock+0xe4

00b3e210 77e98fae 09150000 00b3e5b0 00000104 kernel32!GetModuleFileNameW+0×77

00b3e24c 77e76d5f 091518b8 00b3e5a4 00000000 kernel32!FillUEFInfo+0×51

00b3e8d4 77e84269 00b3e8fc 77e6b831 00b3e904 kernel32!UnhandledExceptionFilter+0xec

00b3e8dc 77e6b831 00b3e904 00000000 00b3e904 kernel32!BaseThreadStart+0×4a

00b3e904 7c82eeb2 00b3e9e8 00b3ffdc 00b3ea04 kernel32!_except_handler3+0×61

00b3e928 7c82ee84 00b3e9e8 00b3ffdc 00b3ea04 ntdll!ExecuteHandler2+0×26

00b3e9d0 7c82ecc6 00b38000 00b3ea04 00b3e9e8 ntdll!ExecuteHandler+0×24

00b3e9d0 7c832335 00b38000 00b3ea04 00b3e9e8 ntdll!KiUserExceptionDispatcher+0xe (CONTEXT @ 00b3ea04)

00b3eeec 77e67319 00090000 00000000 0000056a ntdll!RtlAllocateHeap+0×9e3

00b3ef50 77e67690 77e676bc 00020a50 00000000 kernel32!BasepComputeProcessPath+0xc2

00b3ef90 77e41b95 00000000 00000000 00b3f05c kernel32!BaseComputeProcessDllPath+0xe3

00b3eff0 77e67b77 74065a30 00000000 00000000 kernel32!LoadLibraryExW+0×14e

00b3f004 7406615c 74065a30 007e1ab0 00000000 kernel32!LoadLibraryW+0×11

00b3f020 74066263 007e1ab0 00000000 534c4354 AppA!ProcessItem+0×2d

[…]
  21  Id: 30b0.4534 Suspend: 1 Teb: 7ffa3000 Unfrozen

ChildEBP RetAddr  Args to Child

031eeef8 7c822124 7c83970f 00000350 00000000 ntdll!KiFastSystemCallRet

031eeefc 7c83970f 00000350 00000000 00000000 ntdll!NtWaitForSingleObject+0xc

031eef38 7c839620 00000000 00000004 031ef278 ntdll!RtlpWaitOnCriticalSection+0×19c

031eef58 7c830c25 7c889d40 031ef328 00000000 ntdll!RtlEnterCriticalSection+0xa8

031ef200 7c831016 00000001 031ef2ac 031ef288 ntdll!RtlpDosPathNameToRelativeNtPathName_Ustr+0×97

031ef21c 7c830f85 031ef2ac 031ef288 00000000 ntdll!RtlDosPathNameToRelativeNtPathName_Ustr+0×18

031ef290 7c833ce9 031ef2ac 00000001 031ef414 ntdll!RtlDoesFileExists_UstrEx+0×1c

031ef2c0 7c83350e 031ef328 031ef434 031ef33c ntdll!LdrpSearchPath+0×76

031ef3c4 7c833637 0325fc78 031ef414 00000000 ntdll!LdrpCheckForLoadedDll+0xdc

031ef668 7c833ee5 00000000 0325fc78 031ef968 ntdll!LdrpLoadDll+0×1b3

031ef8e4 77e41bcc 0325fc78 031ef968 031ef948 ntdll!LdrLoadDll+0×198

031ef984 5e00b8d7 00115b00 00000000 00000008 kernel32!LoadLibraryExW+0×1b2

031ef9b0 5dff64aa 000cee40 7406275b 0000059c AppA!LoadPluginModule+0×42

[…]
Looking at TID#3eb4 we see that the cause for deadlock was an exception while loading a DLL. Applying exception context WinDbg command .cxr reveals heap corruption pattern:
0:003> .cxr 00b3ea04

eax=0325f1f0 ebx=00000051 ecx=00090000 edx=00090400 esi=0008019d edi=0325f1e8

eip=7c832335 esp=00b3ecd0 ebp=00b3eeec iopl=0  nv up ei ng nz na po cy

cs=001b  ss=0023  ds=0023  es=0023  fs=003b  gs=0000  efl=00010283

ntdll!RtlAllocateHeap+0×9e3:

7c832335 8906            mov     dword ptr [esi],eax  ds:0023:0008019d={(AppA+0×2) (01000002)}
0:003> kL

  *** Stack trace for last set context - .thread/.cxr resets it

ChildEBP RetAddr

00b3eeec 77e67319 ntdll!RtlAllocateHeap+0×9e3

00b3ef50 77e67690 kernel32!BasepComputeProcessPath+0xc2

00b3ef90 77e41b95 kernel32!BaseComputeProcessDllPath+0xe3

00b3eff0 77e67b77 kernel32!LoadLibraryExW+0×14e

00b3f004 7406615c kernel32!LoadLibraryW+0×11

00b3f020 74066263 AppA!ProcessItem+0×2d

[…]
Seems the address pointed by ESI is valid: [0008019d] = 01000002. However this is write MOV instruction but the accessed memory page is read-only:
0:003> !address 01000002

    01000000 : 01000000 - 00001000

                    Type     01000000 MEM_IMAGE

                    Protect  00000002 PAGE_READONLY

                    State    00001000 MEM_COMMIT

                    Usage    RegionUsageImage

                    FullPath […]AppA.exe
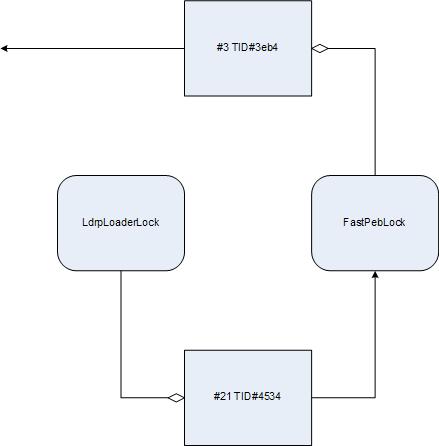
Without heap corruption the normal course of action can be depicted on the following diagram (Wait Chain pattern applied to critical sections):
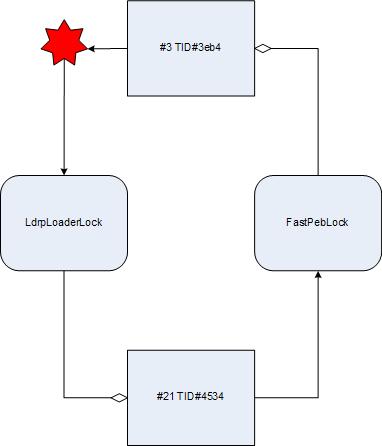
However the exception changes the picture. The course of execution is deflected to the loader again and the loop is closed. We have a classical deadlock:
- Dmitry Vostokov @ DumpAnalysis.org -
New cartoons from Narasimha Vedala:
Early Bird
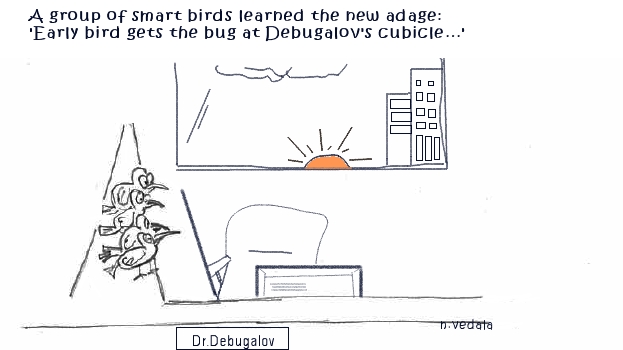
Another cartoon has been added to Links and Tools on Portal post.
- Dmitry Vostokov @ DumpAnalysis.org -
The following table provides correspondence between memory dump types (user, kernel and complete) and pattern names. For ALL, where appropriate, I also list the most common dump types where a pattern can be encountered.
Table: CDA Pattern Classification (Memory dump type)
- Dmitry Vostokov @ DumpAnalysis.org -
The following table provides correspondence between kernel / user mode and space and pattern names. ALL means that a pattern is observable in both modes / spaces.
Table: CDA Pattern Classification (Space/Mode)
- Dmitry Vostokov @ DumpAnalysis.org -
Thinking for a while I realized that it is not possible to create one classification scheme because one pattern can belong to several categories. Therefore I came up with the following draft list of them:
Next two posts will present classification based on Space/Mode and Memory dump type.
- Dmitry Vostokov @ DumpAnalysis.org -
Poor Links and Tools sections are now populated and more will be added in the future together with link classification:

- Dmitry Vostokov @ DumpAnalysis.org -
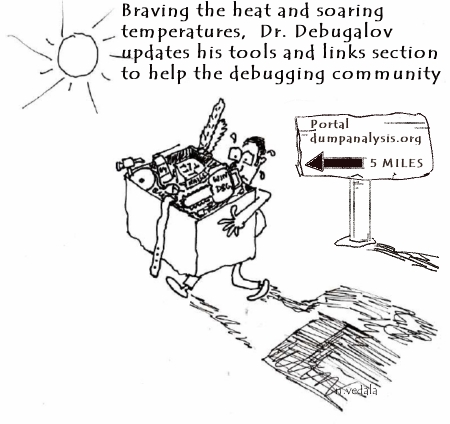
Next pattern is called
Tool Façade (or Tool Facade)
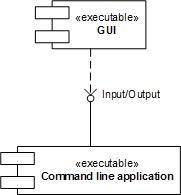
It is used when there is a tool with a cumbersome interface like command line with many options and there is a need for a better and easier to use interface, for example, GUI. This can be illustrated on the following UML component diagram:
Excellent example of this pattern is:
designed as a GUI wrapper around command line tool AddPrinter. Adding the powerful GUI interface allowed to extend its functionality and even find new domains, like testing, where the tool can be used. Excellent information about this tool can be found in the article:
Understanding and using Citrix StressPrinters
- Dmitry Vostokov @ DumpAnalysis.org -
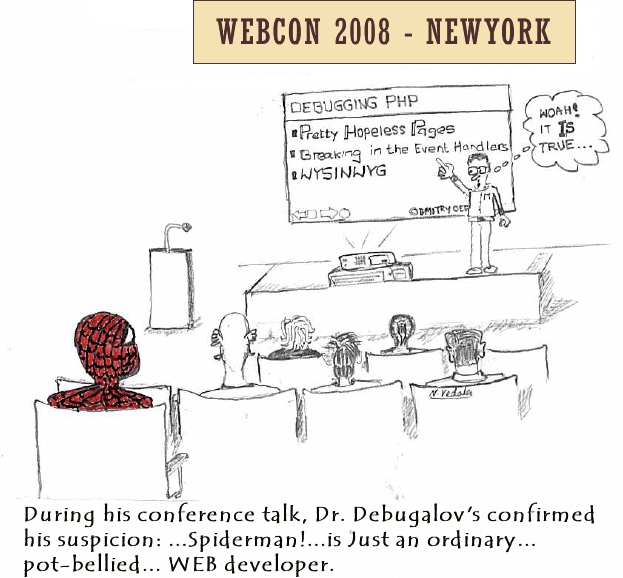
Yet another insightful cartoon from Narasimha Vedala (click on it to enlarge):
Spider Man
- Dmitry Vostokov @ DumpAnalysis.org -
I was very pleased to notice that the reference to crash dump analysis patterns and Memory Dump Analysis Anthology book appeared on Wikipedia:
http://en.wikipedia.org/wiki/Debugging
Special thanks to a person who added this information!
- Dmitry Vostokov @ DumpAnalysis.org -
These are patterns for troubleshooting and debugging tools: solutions for common recurrent problems. Forthcoming book
DebugWare: The Art and Craft of Writing Troubleshooting Tools
which I’m writing with Kapildev Ramlal, the author of several Citrix tools, will discuss them in sufficient detail. The first pattern is named:
API Query
Software products use various API and external interfaces to query data or get notifications from operating system environment. Their behaviour depends on API return values or output parameters that are not always logged or logged with insufficient detail. In order to reproduce or diagnose problems an engineer can write a small API Query tool that will periodically or asynchronously query the same set of API and log their input and output data. If the problem happens with the product at some point this additional log will help in problem identification and resolution.
Examples:
I’ve set up a dedicated page for DebugWare patterns:
http://www.dumpanalysis.org/blog/index.php/debugware-patterns/
- Dmitry Vostokov @ DumpAnalysis.org -
You won’t find any insightful information in this post only the fact that it really involves a railroad! Because registration and 071-660 beta exam itself expire shortly there were no physical seats available in testing centers in Dublin, Republic of Ireland, where I live. So I had to book the exam in a completely remote city about 3 hours by train! Its amazing to what distances people can travel to be certified in hot topic.
- Dmitry Vostokov @ DumpAnalysis.org -
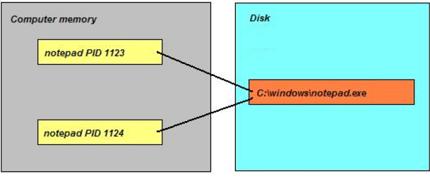
It has been some time since I wrote the previous part of these series. Now I turn back to the theory again and uncover the mystery of the the following phrase used so often in analysis reports: “stack trace of the problem thread“. What is a thread actually? It is defined as a unit of execution or processing. Imagine an Internet browser running on your computer. It was launched by clicking on browser.exe file which we call an application executable file. When this file is loaded and running it occupies some memory regions and we call all these memory regions an Internet browser process. Let click on browser.exe again. A new instance is launched and again, a new running instance is also called a process, the second one. We see that one application file corresponds to several simultaneously running processes where each one has its own unique number, process id (PID). This is illustrated on the following picture for the case of notepad.exe:
Some processes do several tasks in parallel. We call them threads of execution and each one is assigned a unique number, thread id (TID). Consider an Internet browser again. TID 112 is processing keyboard / mouse events (scrolls the page), TID 114 is downloading a graphics file and TID 212 is drawing an animated GIF picture. Every thread does its task in steps, splitting its steps into sub-tasks, dividing every sub-tasks into even smaller units and so on. For example downloading a graphics file can be split into locating a file name on an HTML page, establishing a TCP/IP connection, receiving data and then closing down that connection. Sub-task of locating a file name on an HTML page can be subdivided into finding an IMG tag, then finding its SRC attribute, then parsing a file name, an so on. Abstractly this can be depicted as the nested hierarchy of sequential actions (called functions):
Suppose during the step γ we have a problem. At that time a crash dump is saved. Then in the crash dump we would see the sequence B -> d -> γ. It is called a stack trace (or a backtrace) of the problem thread that was supposed to successfully finish the sequence A -> B -> C but was interrupted at the sub-sub-step γ. In the debugger this stack trace would have been shown as:
application!γ
application!d
application!B
The most recent action is on the top. Let’s go back to our Internet browser example and the thread locating a file name on an HTML page. Suppose the code for parsing file names contains a defect and Internet browser crashes. Then the crash dump would reveal the following stack trace:
browser!ParseFileName
browser!FindSRCAttrubute
browser!FindIMGTag
browser!LocateFileName
browser!DownloadFile
It is often possible to interpret stack traces and guess their meanings by reading the names of corresponding actions.
- Dmitry Vostokov @ DumpAnalysis.org -
The proposed World Heavy-weight Debugging Championship and the cartoon come from Narasimha Vedala (click to enlarge):
At The Championships
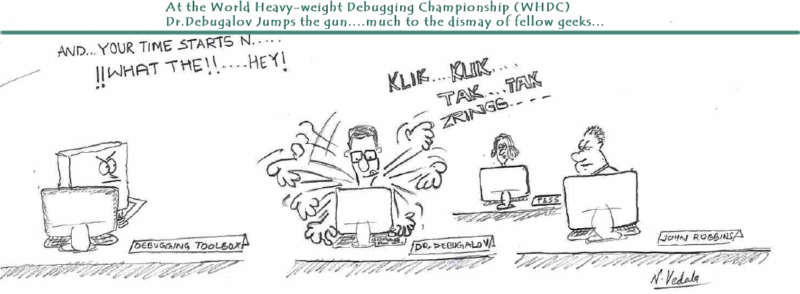
WHDC is also known as the abbreviation of Windows Hardware Developer Central.
- Dmitry Vostokov @ DumpAnalysis.org -
Let’s now apply the knowledge of crash dump analysis patterns to the real memory dump coming from the hanging system. !locks WinDbg command is the most frequently used start command for such symptoms according to my observation which might be biased. It reveals deep Wait Chain pattern for executive resources:
1: kd> !locks

[...]

Resource @ 0x8b10c168    Exclusively owned

    Contention Count = 1950624

    NumberOfSharedWaiters = 2

    NumberOfExclusiveWaiters = 154

     Threads: 88256430-01<*> 882aedb0-01    8a348580-01

     Threads Waiting On Exclusive Access:

              891fd368       894fd240       88382280       8921b9c0

              8aa18db0       89790328       882b8818       88a70bf8

              884a2780       88999818       8a13b020       8846a7a0

              8a0b3020       8812e568       897b6db0       88a16440

              8922c5f8       88bfe3b8       88264ac0       89ff2b40

              8a9da020       881cf020       8807adb0       89d64598

              887811d0       8822a850       88264820       88194738

              8801f7a8       88284020       88628db0       8a071db0

              884a84b0       88be46c0       89755b18       89700020

              89ca4580       881cddb0       882f7020       88bcf9a0

              8921b020       8826fdb0       88a73db0       88211020

              8868a1c8       89121280       89e01020       895cedb0

              88d03790       883941f8       8910f820       891ebc80

              89862db0       88154af8       8821e7d0       881cedb0

              8822b020       88094818       8a00b020       89e69020

              880bbdb0       8945f690       8954c1c0       88d2cb90

              881cd020       8921c448       89550540       8a5a5870

              8a159228       893976c0       882847b8       89306578

              880eb9a8       8978e020       882f72c0       8966c380

              8a12f4b8       8815adb0       881a5020       897c7db0

              8873ebf8       88674530       8831b468       88e999a0

              88287020       8966e600       88541db0       8826d7a0

              88119b10       8a226338       882f7810       888ba348

              884b89a8       88d03db0       8826db00       8910adb0

              881d8368       89288238       8a00adb0       89125db0

              88eb50a0       88dbbdb0       880ed020       895cd5b0

              881d4b00       88565db0       886e7780       884b86d8

              8a603598       89383020       8826f370       886d2248

              88cd1360       881d1888       88bef670       88117db0

              890d63f0       894d0368       8826f850       89123020

              88209020       8826fac0       88f9bdb0       89027478

              894b8d18       882a7338       899b9020       897c3db0

              8a13fc50       88b33d50       88b54b68       88652360

              8a199020       8910dc98       8833a020       8a194a70

              8a5af640       89b717a0       89464db0       8a152878

              884773d8       88afe020       88debaf8       88bef2a0

              88bd6948       89abddb0       8a133db0       88e0ebe8

              88287398       889622e0       8836aab8       88daec80

              88c5c450       88225718
[...]
Resource @ 0x8a316c98    Exclusively owned

    Contention Count = 40315

    NumberOfExclusiveWaiters = 2

     Threads: 893bd498-01<*>

     Threads Waiting On Exclusive Access:

              8846f9a8       88256430
[...]
Resource @ 0x8a2b3800    Exclusively owned

    Contention Count = 17735

    NumberOfExclusiveWaiters = 1

     Threads: 8a30ec80-01<*>

     Threads Waiting On Exclusive Access:

              893bd498
[...]
14606 total locks, 14 locks currently held
We have this chain: 154 threads -> 88256430 -> 893bd498 -> 8a30ec80
The same conclusion comes from !analyze -v -hang command:
1: kd> !analyze -v -hang
[...]
Scanning for threads blocked on locks ...
CURRENT_IRQL: 2
BLOCKING_THREAD: 8a30ec80
LOCK_ADDRESS: 8a2b3800 -- (!locks 8a2b3800)
Resource @ 0x8a2b3800    Exclusively owned

    Contention Count = 17735

    NumberOfExclusiveWaiters = 1

     Threads: 8a30ec80-01<*>

     Threads Waiting On Exclusive Access:

              893bd498
BUGCHECK_STR: LOCK_HELD
[...]
Let’s examine the thread 8a30ec80 that holds so many others:
1: kd> !thread 8a30ec80 1f

THREAD 8a30ec80  Cid 3ca0.20f0  Teb: 00000000 Win32Thread: 00000000 RUNNING on processor 2

Not impersonating

DeviceMap                 e1000930

Owning Process            8a254128       Image:         processA.exe

Wait Start TickCount      2024978        Ticks: 2291 (0:00:00:35.796)

Context Switch Count      339739

UserTime                  00:00:00.000

KernelTime                01:08:29.484

Start Address driverA!WorkerRoutine (0xbfa4b850)

Stack Init b7409000 Current b7407e74 Base b7409000 Limit b7406000 Call 0

Priority 13 BasePriority 13 PriorityDecrement 0

ChildEBP RetAddr

f77353a0 bfa4b880 driverA!DoProcessing+0×256

f77353a4 ff180010 driverA!WorkerRoutine+0×30

[…]
We see that this thread is running on processor 2 and the time spent in kernel is more than one hour. Seems we have the case of Spiking Thread pattern here. Also the thread is not waiting and seems to be moving some data:
1: kd> .thread 8a30ec80

Implicit thread is now 8a30ec80
1: kd> r

Last set context:

eax=baec2950 ebx=00000000 ecx=00001b4a edx=00002275 esi=bae8c010 edi=ba01a018

eip=bfa3b68c esp=f77353a4 ebp=b7407f44 iopl=0 nv up ei pl nz na po nc

cs=0008 ss=0010 ds=0023 es=0023 fs=0030 gs=0000 efl=00000202

driverA!DoProcessing+0×256:

bfa3b68c f3a5 rep movs dword ptr es:[edi],dword ptr [esi]
This driver was also known to have pool allocation problems resulting in various strange system behaviour so let’s inspect the output of !vm command to see whether we have an instance of Insufficient Memory pattern:
1: kd> !vm
*** Virtual Memory Usage ***

 Physical Memory:     1048242 (   4192968 Kb)

 Page File: \??\C:\pagefile.sys

   Current:   4456448 Kb  Free Space:   3483860 Kb

   Minimum:   4456448 Kb  Maximum:      4456448 Kb

 Available Pages:      409879 (   1639516 Kb)

 ResAvail Pages:       942398 (   3769592 Kb)

 Locked IO Pages:         124 (       496 Kb)

 Free System PTEs:     182782 (    731128 Kb)

 Free NP PTEs:          32766 (    131064 Kb)

 Free Special NP:           0 (         0 Kb)

 Modified Pages:           29 (       116 Kb)

 Modified PF Pages:        29 (       116 Kb)

 NonPagedPool Usage:    13567 (     54268 Kb)

 NonPagedPool Max:      65279 (    261116 Kb)

 PagedPool 0 Usage:     12350 (     49400 Kb)

 PagedPool 1 Usage:      2442 (      9768 Kb)

 PagedPool 2 Usage:      2457 (      9828 Kb)

 PagedPool 3 Usage:      2395 (      9580 Kb)

 PagedPool 4 Usage:      2465 (      9860 Kb)

 PagedPool Usage:       22109 (     88436 Kb)

 PagedPool Maximum:     64512 (    258048 Kb)
********** 3 pool allocations have failed **********
 Shared Commit:        133470 (    533880 Kb)

 Special Pool:              0 (         0 Kb)

 Shared Process:        24993 (     99972 Kb)

 PagedPool Commit:      22173 (     88692 Kb)

 Driver Commit:          2056 (      8224 Kb)

 Committed pages:      938909 (   3755636 Kb)

 Commit limit:        2119027 (   8476108 Kb)
[...]
We have signs here but the current size of paged pool and nonpaged pool seems to be very far from their maximum. Perhaps there were failures in session pool allocations? Let’s look at session pool:
1: kd> !vm 4

[...]

 Session ID 5 @ f79f3000:

 Paged Pool Usage:       35640K
*** 6 Pool Allocation Failures ***
Commit Usage: 36900K
We see the problem in session 5 and let’s see in which session our processA.exe was running:
1: kd> !process 8a254128 0

PROCESS 8a254128  SessionId: 15  Cid: 3ca0    Peb: 7ffd7000  ParentCid: 01ac

    DirBase: bff47800  ObjectTable: e779f5c8  HandleCount: 161.

    Image: processA.exe
It was session 15 and therefore we might conclude that previous problems with driverA are not connected to this new one. The identified problem is CPU spike. Perhaps the code contains a bug that causes this driver to loop indefinitely.
- Dmitry Vostokov @ DumpAnalysis.org -
New cartoons from Narasimha Vedala:
Valley Of Death

At A Glance
Igor Messes Up

- Dmitry Vostokov @ DumpAnalysis.org -
One of the users pointed out that Dump Analysis Portal font (Courier New) doesn’t correspond to default BSOD fonts for Windows XP and Vista. According to Wikipedia article:
“The XP BSoD uses the Lucida Console font while the Vista BSoD uses the Consolas font.”
I changed CSS style and now you can enjoy Lucida Console when viewing the portal from Windows XP, Consolas when viewing from Windows Vista and Courier New from other operating systems.
Blog theme remains unchanged until I experiment with new fonts. Consolas font will be also used in one of the forthcoming reference books.
- Dmitry Vostokov @ DumpAnalysis.org -
More cartoons from Narasimha Vedala:
Heap Analysis

Revolution Is Brewing

- Dmitry Vostokov @ DumpAnalysis.org -