Archive for the ‘x64 Windows’ Category
Saturday, December 3rd, 2011
If not for you then definitely for me because I now diagnose Spiking Thread pattern much faster. One of the readers if this blog asked me whether there is !runaway command equivalent for kernel and complete memory dumps. So, after some thinking I gave it a try especially in the context of WinDbg scripting exercises designed for Advanced Windows Memory Dump Analysis training. As a result I wrote 2 scripts initially that you can try yourself. Their output here is taken from a complete memory dump I used for Fundamentals of Complete Crash and Hang Memory Dump Analysis presentation.
The first one dumps the most CPU consuming threads for user and kernel mode:
$$

$$ krunawaymost.wds

$$ Copyright (c) 2011 Memory Dump Analysis Services

$$ GNU GENERAL PUBLIC LICENSE

$$ http://www.gnu.org/licenses/gpl-3.0.txt

$$

r $t0 = 0

!for_each_thread “r $t1 = dwo( @#Thread + @@c++(#FIELD_OFFSET(nt!_KTHREAD, UserTime)) ); .if (@$t1 > @$t0) {r $t0 = @$t1; r $t2 = @#Thread}”

.echo “The largest UserTime value: ”

? @$t0

!thread @$t2 ff

r $t0 = 0

!for_each_thread “r $t1 = dwo( @#Thread + @@c++(#FIELD_OFFSET(nt!_KTHREAD, KernelTime)) ); .if (@$t1 > @$t0) {r $t0 = @$t1; r $t2 = @#Thread}”

.echo “The largest KernelTime value: ”

? @$t0

!thread @$t2 ff
0: kd> $$><c:\Scripts\krunawaymost.wds

The largest UserTime value:

Evaluate expression: 5470 = 00000000`0000155e

THREAD fffffa800451d720  Cid 1418.17fc  Teb: 000007fffffdc000 Win32Thread: 0000000000000000 RUNNING on processor 2

Not impersonating

DeviceMap                 fffff8a001ce6b90

Owning Process            fffffa800442ab30       Image:         ApplicationE.exe

Attached Process          N/A            Image:         N/A

Wait Start TickCount      22295          Ticks: 0

Context Switch Count      27960

UserTime                  00:01:25.332

KernelTime                00:00:00.015

*** ERROR: Module load completed but symbols could not be loaded for ApplicationE.exe

Win32 Start Address ApplicationE (0×000000013f0f1578)

Stack Init fffff8800723cc70 Current fffff8800723c960

Base fffff8800723d000 Limit fffff88007237000 Call 0

Priority 8 BasePriority 8 UnusualBoost 0 ForegroundBoost 0 IoPriority 2 PagePriority 5

Child-SP          RetAddr           Call Site

00000000`0021f9e0 00000000`00000000 ApplicationE+0×6cd3
The largest KernelTime value:

Evaluate expression: 187 = 00000000`000000bb

THREAD fffffa80098d7b60  Cid 07bc.0a14  Teb: 000007fffffd7000 Win32Thread: fffff900c2ca0c20 WAIT: (UserRequest) KernelMode Non-Alertable

    fffffa8008a4a030  NotificationEvent

Not impersonating

DeviceMap                 fffff8a001ce6b90

Owning Process            fffffa80096beb30       Image:         dwm.exe

Attached Process          N/A            Image:         N/A

Wait Start TickCount      22294          Ticks: 1 (0:00:00:00.015)

Context Switch Count      15473                 LargeStack

UserTime                  00:00:06.801

KernelTime                00:00:02.917

Win32 Start Address dwmcore!CPartitionThread::ThreadMain (0×000007fef8a1f0d8)

Stack Init fffff8800d3d5c70 Current fffff8800d3d5740

Base fffff8800d3d6000 Limit fffff8800d3cf000 Call 0

Priority 15 BasePriority 15 UnusualBoost 0 ForegroundBoost 0 IoPriority 2 PagePriority 5

Child-SP          RetAddr           Call Site

fffff880`0d3d5780 fffff800`02ee6f32 nt!KiSwapContext+0×7a

fffff880`0d3d58c0 fffff800`02ee974f nt!KiCommitThreadWait+0×1d2

fffff880`0d3d5950 fffff880`0fef65b3 nt!KeWaitForSingleObject+0×19f

fffff880`0d3d59f0 fffff960`001fedea dxgkrnl!DxgkWaitForVerticalBlankEvent+0×53f

fffff880`0d3d5ab0 fffff800`02ee0ed3 win32k!NtGdiDdDDIWaitForVerticalBlankEvent+0×12

fffff880`0d3d5ae0 000007fe`ff1d143a nt!KiSystemServiceCopyEnd+0×13 (TrapFrame @ fffff880`0d3d5ae0)

00000000`0287f778 000007fe`f8791da1 GDI32!NtGdiDdDDIWaitForVerticalBlankEvent+0xa

00000000`0287f780 000007fe`f89e1b6e dxgi!CDXGIOutput::WaitForVBlank+0×51

00000000`0287f7c0 000007fe`f89e1ae9 dwmcore!CD3DDeviceLevel1::WaitForVBlank+0×1f9

00000000`0287f810 000007fe`f89e1a9d dwmcore!CHwDisplayRenderTarget::WaitForVBlank+0×39

00000000`0287f850 000007fe`f89e1a4c dwmcore!CDesktopRenderTarget::WaitForVBlank+0×40

00000000`0287f880 000007fe`f89d3513 dwmcore!CSlaveHWndRenderTarget::WaitForVBlank+0×2c

00000000`0287f8c0 000007fe`f89d3584 dwmcore!CRenderTargetManager::WaitForVBlank+0×7d

00000000`0287f900 000007fe`f89d2661 dwmcore!CPartitionVerticalBlankScheduler::WaitForVBlank+0×7c

00000000`0287f950 000007fe`f8a1f0f4 dwmcore!CPartitionVerticalBlankScheduler::Run+0xe5

00000000`0287f9b0 00000000`7719652d dwmcore!CPartitionThread::ThreadMain+0×1c

00000000`0287f9e0 00000000`772cc521 kernel32!BaseThreadInitThunk+0xd

00000000`0287fa10 00000000`00000000 ntdll!RtlUserThreadStart+0×1d
The second script takes two arguments and shows all threads that have UserTime and KernelTime ticks value greater than (you can have the idea of the maximum from the previous script):
$$

$$ krunawaygt.wds

$$ Copyright (c) 2011 Memory Dump Analysis Services

$$ GNU GENERAL PUBLIC LICENSE

$$ http://www.gnu.org/licenses/gpl-3.0.txt

$$

!for_each_thread “r $t1 = dwo( @#Thread + @@c++(#FIELD_OFFSET(nt!_KTHREAD, UserTime)) ); r $t0 = $arg1; .if (@$t1 > @$t0) {!thread @#Thread ff}”

!for_each_thread “r $t1 = dwo( @#Thread + @@c++(#FIELD_OFFSET(nt!_KTHREAD, KernelTime)) ); r $t0 = $arg2; .if (@$t1 > @$t0) {!thread @#Thread ff}”
Using hints from the previous script run (the largest UserTime ticks value is 0×155e) we now get threads that spent more than 0×100 ticks in user mode:
0: kd> $$>a<c:\Scripts\krunawaygt.wds 100 100

THREAD fffffa800843e060  Cid 03f4.0658  Teb: 000007fffff90000 Win32Thread: 0000000000000000 WAIT: (WrQueue) UserMode Non-Alertable

    fffffa800843c2c0  QueueObject

Not impersonating

DeviceMap                 fffff8a000008aa0

Owning Process            fffffa800916b060       Image:         MsMpEng.exe

Attached Process          N/A            Image:         N/A

Wait Start TickCount      21211          Ticks: 1084 (0:00:00:16.910)

Context Switch Count      6028

UserTime                  00:00:10.140

KernelTime                00:00:00.296

Win32 Start Address msvcrt!endthreadex (0×000007feff5173fc)

Stack Init fffff88009d4bc70 Current fffff88009d4b660

Base fffff88009d4c000 Limit fffff88009d46000 Call 0

Priority 9 BasePriority 8 UnusualBoost 0 ForegroundBoost 0 IoPriority 2 PagePriority 5

*** ERROR: Symbol file could not be found.  Defaulted to export symbols for mprtp.dll -

Child-SP          RetAddr           Call Site

fffff880`09d4b6a0 fffff800`02ee6f32 nt!KiSwapContext+0×7a

fffff880`09d4b7e0 fffff800`02ee9f93 nt!KiCommitThreadWait+0×1d2

fffff880`09d4b870 fffff800`031ca647 nt!KeRemoveQueueEx+0×323

fffff880`09d4b930 fffff800`0319cae5 nt!IoRemoveIoCompletion+0×47

fffff880`09d4b9c0 fffff800`02ee0ed3 nt!NtRemoveIoCompletion+0×145

fffff880`09d4ba70 00000000`772f13aa nt!KiSystemServiceCopyEnd+0×13 (TrapFrame @ fffff880`09d4bae0)

00000000`0209fb08 000007fe`fd9e169d ntdll!ZwRemoveIoCompletion+0xa

00000000`0209fb10 00000000`7718a4e1 KERNELBASE!GetQueuedCompletionStatus+0×39

00000000`0209fb70 00000000`748f2c74 kernel32!GetQueuedCompletionStatusStub+0×11

00000000`0209fbb0 00000000`0045cbc0 mprtp!MpPluginSignatureChange+0×3e170

00000000`0209fbb8 000007fe`fbac25ff 0×45cbc0

00000000`0209fbc0 00000000`00466610 FLTLIB!FilterGetMessage+0×2b

00000000`0209fc20 00000000`00000000 0×466610
THREAD fffffa800845c060  Cid 03f4.065c  Teb: 000007fffff8e000 Win32Thread: 0000000000000000 WAIT: (WrQueue) UserMode Non-Alertable

    fffffa800843c2c0  QueueObject

Not impersonating

DeviceMap                 fffff8a000008aa0

Owning Process            fffffa800916b060       Image:         MsMpEng.exe

Attached Process          N/A            Image:         N/A

Wait Start TickCount      21520          Ticks: 775 (0:00:00:12.090)

Context Switch Count      4979

UserTime                  00:00:04.149

KernelTime                00:00:00.156

Win32 Start Address msvcrt!endthreadex (0×000007feff5173fc)

Stack Init fffff88009d52c70 Current fffff88009d52660

Base fffff88009d53000 Limit fffff88009d4d000 Call 0

Priority 8 BasePriority 8 UnusualBoost 0 ForegroundBoost 0 IoPriority 2 PagePriority 5

*** ERROR: Symbol file could not be found.  Defaulted to export symbols for mprtp.dll -

Child-SP          RetAddr           Call Site

fffff880`09d526a0 fffff800`02ee6f32 nt!KiSwapContext+0×7a

fffff880`09d527e0 fffff800`02ee9f93 nt!KiCommitThreadWait+0×1d2

fffff880`09d52870 fffff800`031ca647 nt!KeRemoveQueueEx+0×323

fffff880`09d52930 fffff800`0319cae5 nt!IoRemoveIoCompletion+0×47

fffff880`09d529c0 fffff800`02ee0ed3 nt!NtRemoveIoCompletion+0×145

fffff880`09d52a70 00000000`772f13aa nt!KiSystemServiceCopyEnd+0×13 (TrapFrame @ fffff880`09d52ae0)

00000000`01ccf498 000007fe`fd9e169d ntdll!ZwRemoveIoCompletion+0xa

00000000`01ccf4a0 00000000`7718a4e1 KERNELBASE!GetQueuedCompletionStatus+0×39

00000000`01ccf500 00000000`748f2c74 kernel32!GetQueuedCompletionStatusStub+0×11

00000000`01ccf540 00000000`0045d030 mprtp!MpPluginSignatureChange+0×3e170

00000000`01ccf548 000007fe`fbac25ff 0×45d030

00000000`01ccf550 00000000`004666b0 FLTLIB!FilterGetMessage+0×2b

00000000`01ccf5b0 00000000`00000000 0×4666b0
THREAD fffffa80092b7060  Cid 03f4.1268  Teb: 000007fffff6a000 Win32Thread: 0000000000000000 WAIT: (WrQueue) UserMode Alertable

    fffffa8009299140  QueueObject

Not impersonating

DeviceMap                 fffff8a000008aa0

Owning Process            fffffa800916b060       Image:         MsMpEng.exe

Attached Process          N/A            Image:         N/A

Wait Start TickCount      7762           Ticks: 14533 (0:00:03:46.716)

Context Switch Count      3297

UserTime                  00:00:06.489

KernelTime                00:00:00.499

Win32 Start Address ntdll!TppWorkerThread (0×00000000772bfbc0)

Stack Init fffff8800e620c70 Current fffff8800e620680

Base fffff8800e621000 Limit fffff8800e61b000 Call 0

Priority 8 BasePriority 8 UnusualBoost 0 ForegroundBoost 0 IoPriority 2 PagePriority 5

Child-SP          RetAddr           Call Site

fffff880`0e6206c0 fffff800`02ee6f32 nt!KiSwapContext+0×7a

fffff880`0e620800 fffff800`02ee9f93 nt!KiCommitThreadWait+0×1d2

fffff880`0e620890 fffff800`031ca647 nt!KeRemoveQueueEx+0×323

fffff880`0e620950 fffff800`02ecdb36 nt!IoRemoveIoCompletion+0×47

fffff880`0e6209e0 fffff800`02ee0ed3 nt!NtWaitForWorkViaWorkerFactory+0×285

fffff880`0e620ae0 00000000`772f2c1a nt!KiSystemServiceCopyEnd+0×13 (TrapFrame @ fffff880`0e620ae0)

00000000`0540f998 00000000`772bfe0b ntdll!ZwWaitForWorkViaWorkerFactory+0xa

00000000`0540f9a0 00000000`7719652d ntdll!TppWorkerThread+0×2c9

00000000`0540fca0 00000000`772cc521 kernel32!BaseThreadInitThunk+0xd

00000000`0540fcd0 00000000`00000000 ntdll!RtlUserThreadStart+0×1d
THREAD fffffa80098d7b60  Cid 07bc.0a14  Teb: 000007fffffd7000 Win32Thread: fffff900c2ca0c20 WAIT: (UserRequest) KernelMode Non-Alertable

    fffffa8008a4a030  NotificationEvent

Not impersonating

DeviceMap                 fffff8a001ce6b90

Owning Process            fffffa80096beb30       Image:         dwm.exe

Attached Process          N/A            Image:         N/A

Wait Start TickCount      22294          Ticks: 1 (0:00:00:00.015)

Context Switch Count      15473                 LargeStack

UserTime                  00:00:06.801

KernelTime                00:00:02.917

Win32 Start Address dwmcore!CPartitionThread::ThreadMain (0×000007fef8a1f0d8)

Stack Init fffff8800d3d5c70 Current fffff8800d3d5740

Base fffff8800d3d6000 Limit fffff8800d3cf000 Call 0

Priority 15 BasePriority 15 UnusualBoost 0 ForegroundBoost 0 IoPriority 2 PagePriority 5

Child-SP          RetAddr           Call Site

fffff880`0d3d5780 fffff800`02ee6f32 nt!KiSwapContext+0×7a

fffff880`0d3d58c0 fffff800`02ee974f nt!KiCommitThreadWait+0×1d2

fffff880`0d3d5950 fffff880`0fef65b3 nt!KeWaitForSingleObject+0×19f

fffff880`0d3d59f0 fffff960`001fedea dxgkrnl!DxgkWaitForVerticalBlankEvent+0×53f

fffff880`0d3d5ab0 fffff800`02ee0ed3 win32k!NtGdiDdDDIWaitForVerticalBlankEvent+0×12

fffff880`0d3d5ae0 000007fe`ff1d143a nt!KiSystemServiceCopyEnd+0×13 (TrapFrame @ fffff880`0d3d5ae0)

00000000`0287f778 000007fe`f8791da1 GDI32!NtGdiDdDDIWaitForVerticalBlankEvent+0xa

00000000`0287f780 000007fe`f89e1b6e dxgi!CDXGIOutput::WaitForVBlank+0×51

00000000`0287f7c0 000007fe`f89e1ae9 dwmcore!CD3DDeviceLevel1::WaitForVBlank+0×1f9

00000000`0287f810 000007fe`f89e1a9d dwmcore!CHwDisplayRenderTarget::WaitForVBlank+0×39

00000000`0287f850 000007fe`f89e1a4c dwmcore!CDesktopRenderTarget::WaitForVBlank+0×40

00000000`0287f880 000007fe`f89d3513 dwmcore!CSlaveHWndRenderTarget::WaitForVBlank+0×2c

00000000`0287f8c0 000007fe`f89d3584 dwmcore!CRenderTargetManager::WaitForVBlank+0×7d

00000000`0287f900 000007fe`f89d2661 dwmcore!CPartitionVerticalBlankScheduler::WaitForVBlank+0×7c

00000000`0287f950 000007fe`f8a1f0f4 dwmcore!CPartitionVerticalBlankScheduler::Run+0xe5

00000000`0287f9b0 00000000`7719652d dwmcore!CPartitionThread::ThreadMain+0×1c

00000000`0287f9e0 00000000`772cc521 kernel32!BaseThreadInitThunk+0xd

00000000`0287fa10 00000000`00000000 ntdll!RtlUserThreadStart+0×1d
THREAD fffffa800451d720  Cid 1418.17fc  Teb: 000007fffffdc000 Win32Thread: 0000000000000000 RUNNING on processor 2

Not impersonating

DeviceMap                 fffff8a001ce6b90

Owning Process            fffffa800442ab30       Image:         ApplicationE.exe

Attached Process          N/A            Image:         N/A

Wait Start TickCount      22295          Ticks: 0

Context Switch Count      27960

UserTime                  00:01:25.332

KernelTime                00:00:00.015

*** ERROR: Module load completed but symbols could not be loaded for ApplicationE.exe

Win32 Start Address ApplicationE (0×000000013f0f1578)

Stack Init fffff8800723cc70 Current fffff8800723c960

Base fffff8800723d000 Limit fffff88007237000 Call 0

Priority 8 BasePriority 8 UnusualBoost 0 ForegroundBoost 0 IoPriority 2 PagePriority 5

Child-SP          RetAddr           Call Site

00000000`0021f9e0 00000000`00000000 ApplicationE+0×6cd3
Memory Dump Analysis Services is now working to incorporate client-side WinDbg scripting into their CARE2 architecture.
- Dmitry Vostokov @ DumpAnalysis.org + TraceAnalysis.org -
Posted in Announcements, Complete Memory Dump Analysis, Crash Analysis Report Environment (CARE), Crash Dump Analysis, Crash Dump Patterns, Debugging, Memory Dump Analysis Services, Training and Seminars, WinDbg Scripts, WinDbg Tips and Tricks, x64 Windows | No Comments »
Thursday, November 10th, 2011
Hidden Parameter pattern is a variant of Execution Residue and String Parameter where we have parameters left out from stack trace due to register calling conventions and compiler optimizations. However, raw stack analysis in a region around stack frames of interest we find what we are looking for. Here’s an example from an x64 system blocked thread waiting for data from a named pipe:
0: kd> kL

  *** Stack trace for last set context - .thread/.cxr resets it

Child-SP          RetAddr           Call Site

fffffa60`2c3627d0 fffff800`018b90fa nt!KiSwapContext+0x7f

fffffa60`2c362910 fffff800`018add3b nt!KiSwapThread+0x13a

fffffa60`2c362980 fffff800`01b2121f nt!KeWaitForSingleObject+0x2cb

fffffa60`2c362a10 fffff800`01b319b6 nt!IopXxxControlFile+0xdeb

fffffa60`2c362b40 fffff800`018b68f3 nt!NtFsControlFile+0x56

fffffa60`2c362bb0 00000000`778d6eaa nt!KiSystemServiceCopyEnd+0x13

00000000`11f4da68 00000000`77767b6e ntdll!ZwFsControlFile+0xa

00000000`11f4da70 000007fe`ff94abc8 kernel32!WaitNamedPipeW+0×22f

00000000`11f4db60 000007fe`ff98a32d RPCRT4!NdrProxyForwardingFunction255+0×814d

00000000`11f4dc30 000007fe`ff98918b RPCRT4!OSF_CCONNECTION::TransOpen+0xcd

00000000`11f4dcc0 000007fe`ff988f9b RPCRT4!OSF_CCONNECTION::OpenConnectionAndBind+0×17b

00000000`11f4dd90 000007fe`ff988ec6 RPCRT4!OSF_CCALL::BindToServer+0xbb

00000000`11f4de40 000007fe`ff983368 RPCRT4!OSF_BINDING_HANDLE::InitCCallWithAssociation+0xa5

00000000`11f4dea0 000007fe`ff983220 RPCRT4!OSF_BINDING_HANDLE::AllocateCCall+0×118

00000000`11f4dfd0 000007fe`ffa1f740 RPCRT4!OSF_BINDING_HANDLE::NegotiateTransferSyntax+0×30

00000000`11f4e020 000007fe`ffa1fecb RPCRT4!Ndr64pClientSetupTransferSyntax+0×200

00000000`11f4e080 000007fe`ffa20281 RPCRT4!NdrpClientCall3+0×6b

00000000`11f4e2d0 000007fe`fe087c8c RPCRT4!NdrClientCall3+0xdd

[…]
Even if we disassemble the return address of a caller of WaitNamedPipeW function we won’t easily find the passed first string parameter (named pipe name) unless we do a substancial reverse engineering and data flow analysis:
0: kd> ub 000007fe`ff94abc8

RPCRT4!_imp_load_getaddrinfo+0×7:

000007fe`ff94ab9f jmp     RPCRT4!_tailMerge_WS2_32_dll (000007fe`ff94cef8)

000007fe`ff94aba4 call    qword ptr [RPCRT4!_imp_GetLastError (000007fe`ffa2d528)]

000007fe`ff94abaa mov     r12d,eax

000007fe`ff94abad cmp     r12d,0E7h

000007fe`ff94abb4 jne     RPCRT4!NdrProxyForwardingFunction255+0×8193 (000007fe`ff99c8fb)

000007fe`ff94abba mov     edx,3E8h

000007fe`ff94abbf mov     rcx,rsi

000007fe`ff94abc2 call    qword ptr [RPCRT4!_imp_WaitNamedPipeW (000007fe`ffa2d3f8)]
So dumping raw stack date around corresponding frames give us pipe name clue and possible service to look further:
0: kd> dpu 00000000`11f4da70

00000000`11f4da70  00000000`11f4dba8 “\\.\PIPE\ServiceArpc”

00000000`11f4da78  00000000`00000000

00000000`11f4da80  00000000`00000000

00000000`11f4da88  00000000`000003e8

00000000`11f4da90  00000000`11f4db30

00000000`11f4da98  00000000`00110018

00000000`11f4daa0  00000000`0d9001a0

00000000`11f4daa8  00000000`0000001a

00000000`11f4dab0  00000000`00000000

00000000`11f4dab8  00000000`00000000

00000000`11f4dac0  00000000`0020000c

00000000`11f4dac8  00000000`0d9001e2 “ServiceArpc”

00000000`11f4dad0  00000000`00000000

00000000`11f4dad8  00000000`00000000

00000000`11f4dae0  00000000`00240022
- Dmitry Vostokov @ DumpAnalysis.org + TraceAnalysis.org -
Posted in Crash Dump Analysis, Crash Dump Patterns, Debugging, x64 Windows | 1 Comment »
Thursday, November 3rd, 2011
The new 6th volume contains revised, edited, cross-referenced, and thematically organized selected DumpAnalysis.org blog posts about memory dump and software trace analysis, software troubleshooting and debugging written in November 2010 - October 2011 for software engineers developing and maintaining products on Windows platforms, quality assurance engineers testing software on Windows platforms, technical support and escalation engineers dealing with complex software issues, and security researchers, malware analysts and reverse engineers. The sixth volume features:
- 56 new crash dump analysis patterns including 14 new .NET memory dump analysis patterns
- 4 new pattern interaction case studies
- 11 new trace analysis patterns
- New Debugware pattern
- Introduction to UI problem analysis patterns
- Introduction to intelligence analysis patterns
- Introduction to unified debugging pattern language
- Introduction to generative debugging, metadefect template library and DNA of software behaviour
- The new school of debugging and trends
- .NET memory dump analysis checklist
- Software trace analysis checklist
- Introduction to close and deconstructive readings of a software trace
- Memory dump analysis compass
- Computical and Stack Trace Art
- The abductive reasoning of Philip Marlowe
- Orbifold memory space and cloud computing
- Memory worldview
- Interpretation of cyberspace
- Relationship of memory dumps to religion
- Fully cross-referenced with Volume 1, Volume 2, Volume 3, Volume 4, and Volume 5
Product information:
- Title: Memory Dump Analysis Anthology, Volume 6
- Author: Dmitry Vostokov
- Language: English
- Product Dimensions: 22.86 x 15.24
- Paperback: 300 pages
- Publisher: Opentask (December 2011)
- ISBN-13: 978-1-908043-19-1
- Hardcover: 300 pages
- Publisher: Opentask (January 2012)
- ISBN-13: 978-1-908043-20-7

Back cover features 3d memory space visualization image created with ParaView.
- Dmitry Vostokov @ DumpAnalysis.org + TraceAnalysis.org -
Posted in .NET Debugging, Announcements, Art, Books, Cloud Computing, Cloud Memory Dump Analysis, Common Mistakes, Complete Memory Dump Analysis, Computer Science, Computicart (Computical Art), Crash Dump Analysis, Crash Dump Patterns, Cyber Intelligence, Cyber Problems, Cyber Security, Cyber Space, Cyber Warfare, DebugWare Patterns, Debugging, Debugging Industry, Debugging Methodology, Debugging Slang, Debugging Trends, Escalation Engineering, Generative Debugging, Intelligence Analysis Patterns, Kernel Development, Memoidealism, Memoretics, Memory Visualization, Metadefect Template Library, New Debugging School, Philosophy, Physicalist Art, Publishing, Root Cause Analysis, Science of Memory Dump Analysis, Science of Software Tracing, Security, Software Behavior DNA, Software Behavior Patterns, Software Behavioral Genome, Software Engineering, Software Narratology, Software Technical Support, Software Trace Analysis, Software Trace Deconstruction, Software Trace Reading, Software Victimology, Testing, The Way of Philip Marlowe, Tools, Trace Analysis Patterns, Training and Seminars, Troubleshooting Methodology, UI Problem Analysis Patterns, Unified Debugging Patterns, Victimware, WinDbg Tips and Tricks, Windows 7, Windows Azure, Windows Data Structures, Windows Server 2008, Windows System Administration, x64 Windows | No Comments »
Sunday, August 14th, 2011
Due to the need to extend existing basic and intermediate Accelerated Windows Memory Dump Analysis training Memory Dump Analysis Services organises advanced training course. Here is the description and registration information:
Learn how to navigate through memory dump space and Windows data structures to troubleshoot and debug complex software incidents. We use a unique and innovative pattern-driven analysis approach to speed up the learning curve. The training consists of practical step-by-step exercises using WinDbg to diagnose structural and behavioral patterns in 32-bit and 64-bit process, kernel and complete memory dumps.

If you are registered you are allowed to optionally submit your memory dumps before the training. This will allow us in addition to the carefully constructed problems tailor extra examples to the needs of the attendees.
The training consists of one four-hour session and additional homework exercises. When you finish the training you additionally get:
- A full transcript in PDF format (retail price $200)
- 5 volumes of Memory Dump Analysis Anthology in PDF format (retail price $100)
- A personalized attendance certificate with unique CID (PDF format)
Prerequisites: Basic and intermediate level Windows memory dump analysis: ability to list processors, processes, threads, modules, apply symbols, walk through stack traces and raw stack data, diagnose patterns such as heap corruption, CPU spike, memory and handle leaks, access violation, stack overflow, critical section and resource wait chains and deadlocks. If you don’t feel comfortable with prerequisites then Accelerated Windows Memory Dump Analysis training is recommended to take (or purchase a corresponding book) before attending this course.
Audience: Software developers, software technical support and escalation engineers.
Session: December 9, 2011 4:00 PM - 8:00 PM GMT
Price: 210 USD
Space is limited.
Reserve your remote training seat now at:
https://student.gototraining.com/24s4l/register/3788047691824598784
- Dmitry Vostokov @ DumpAnalysis.org + TraceAnalysis.org -
Posted in Announcements, Complete Memory Dump Analysis, Crash Dump Analysis, Crash Dump Patterns, Debugging, Escalation Engineering, Kernel Development, Memory Dump Analysis Services, Multithreading, Reverse Engineering, Root Cause Analysis, Software Engineering, Software Technical Support, Structural Memory Patterns, Training and Seminars, Uses of UML, Vista, WinDbg Scripts, WinDbg Tips and Tricks, Windows 7, Windows Data Structures, Windows Server 2008, x64 Windows | No Comments »
Thursday, August 11th, 2011
Due to popular demand and the need to extend existing Accelerated Windows Memory Dump Analysis training Memory Dump Analysis Services organises the new training course. Here is the description and registration information:
Learn how to analyze .NET application and service crashes and freezes, navigate through memory dump space (managed and unmanaged code) and diagnose corruption, leaks, CPU spikes, blocked threads, deadlocks, wait chains, resource contention, and much more. We use a unique and innovative pattern-driven analysis approach to speed up the learning curve. The training consists of practical step-by-step exercises using WinDbg to diagnose patterns in 32-bit and 64-bit process memory dumps.

If you are registered you are allowed to optionally submit your memory dumps before the training. This will allow us in addition to the carefully constructed problems tailor extra examples to the needs of the attendees.
The training consists of one four-hour session and additional homework exercises. When you finish the training you additionally get:
- A full transcript in PDF format (retail price $200)
- 5 volumes of Memory Dump Analysis Anthology in PDF format (retail price $100)
- A personalized attendance certificate with unique CID (PDF format)
Prerequisites: Basic .NET programming and debugging.
Audience: Software developers, software technical support and escalation engineers.
Session: October 28, 2011 4:00 PM - 8:00 PM GMT
Price: 210 USD
Space is limited.
Reserve your remote training seat now at:
https://student.gototraining.com/24s4l/register/423991811034037760
- Dmitry Vostokov @ DumpAnalysis.org + TraceAnalysis.org -
Posted in .NET Debugging, Announcements, Cloud Memory Dump Analysis, Crash Dump Analysis, Crash Dump Patterns, Debugging, Escalation Engineering, Memory Dump Analysis Services, Multithreading, Software Engineering, Software Technical Support, Training and Seminars, Windows 7, Windows Azure, Windows Server 2008, x64 Windows | No Comments »
Sunday, August 7th, 2011
During the previous several months many people expressed their interest in the training (the next one is scheduled for November) but its time was not suitable due to the very different geographic time zones. So I have decided to publish this training in book format (currently in PDF) and make it available in paperback on Amazon and B&N later. Book details:
- Title: Accelerated Windows Memory Dump Analysis: Training Course Transcript and WinDbg Practice Exercises with Notes
- Description: The full transcript of Memory Dump Analysis Services Training with 21 step-by-step exercises, notes, source code of specially created modeling applications and selected Q&A. Covers about 50 crash dump analysis patterns from process, kernel and complete memory dumps.
- Authors: Dmitry Vostokov, Memory Dump Analysis Services
- Publisher: OpenTask (August 2011)
- Language: English
- Product Dimensions: 28.0 x 21.6
- Paperback: 360 pages
- ISBN-13: 978-1908043290

Table of Contents
Now available for sale in PDF format from Memory Dump Analysis Services.
- Dmitry Vostokov @ DumpAnalysis.org + TraceAnalysis.org -
Posted in Announcements, Books, Complete Memory Dump Analysis, Crash Dump Analysis, Crash Dump Patterns, Escalation Engineering, Memory Dump Analysis Services, Publishing, Software Technical Support, Testing, Tools, Training and Seminars, Vista, WinDbg Tips and Tricks, Windows 7, Windows Server 2008, Windows System Administration, x64 Windows | No Comments »
Saturday, August 6th, 2011
Due to popular demand (the previous training was fully booked) Memory Dump Analysis Services scheduled the next training sessions.
Learn how to analyze application, service and system crashes and freezes, navigate through memory dump space and diagnose heap corruption, memory leaks, CPU spikes, blocked threads, deadlocks, wait chains, and much more. We use a unique and innovative pattern-driven analysis approach to speed up the learning curve. The training consists of more than 20 practical step-by-step exercises using WinDbg highlighting more than 50 patterns diagnosed in 32-bit and 64-bit process, kernel and complete memory dumps.
Public preview (selected slides) of the previous training

Memory Dump Analysis Services organizes a training course.
If you are registered you are allowed to optionally submit your memory dumps before the training. This will allow us in addition to the carefully constructed problems tailor extra examples to the needs of the attendees.
The training consists of 4 two-hour sessions (2 hours every day). When you finish the training you additionally get:
- A full transcript in PDF format (retail price $200)
- 5 volumes of Memory Dump Analysis Anthology in PDF format (retail price $100)
- A personalized attendance certificate with unique CID (PDF format)
Prerequisites: Basic Windows troubleshooting
Session 1: November 1, 2011 4:00 PM - 6:00 PM GMT
Session 2: November 2, 2011 4:00 PM - 6:00 PM GMT
Session 3: November 3, 2011 4:00 PM - 6:00 PM GMT
Session 4: November 4, 2011 4:00 PM - 6:00 PM GMT
Price: 210 USD
Space is limited.
Reserve your remote training seat now.
If scheduled dates or time are not suitable for you Memory Dump Analysis Services offers the same training in book format.
Training testimonials:
I would like to thank you and recommend your training. I think that the “Accelerated Windows Memory Dump Analysis” training is a pin-point, well taught training. I think it’s the leading training in the dump analysis area and I’ve enjoyed it, the books and materials are very detailed and well written and Dmitry answered all of the needed question. In addition after the training Dmitry sent a PDF with written answers and more information about the questions that were asked. I will give this training 5/5. Thank you Dmitry.
Yaniv Miron, Security Researcher, IL.Hack
- Dmitry Vostokov @ DumpAnalysis.org + TraceAnalysis.org -
Posted in Announcements, Complete Memory Dump Analysis, Crash Dump Analysis, Crash Dump Patterns, Escalation Engineering, Memory Dump Analysis Services, Multithreading, Software Technical Support, Testing, Tools, Training and Seminars, Vista, WinDbg Tips and Tricks, Windows 7, Windows Server 2008, Windows System Administration, x64 Windows | No Comments »
Friday, July 15th, 2011
One way to quickly check for something suspicious in a memory dump is to convert it to a debugger log (for example, stack trace collection) and search for textual strings such as “Waiting for“, “Terminate“, “Stop”, “Mutant“, “Exception“, “Crit“, “MessageBox“, “SuspendCount“, etc. The vocabulary, of course, is OS dependent, can have false positives, and can change over time. We name this pattern Problem Vocabulary. It is similar to Vocabulary Index software trace analysis pattern.
For example, recently in a complete memory dump involving lots of ALPC wait chains with potential inter-process deadlock we found the following thread having long waiting time (exceeding ALPC threads waiting times) pointing to a process object to examine further:
THREAD fffffa801338b950  Cid 02a0.7498  Teb: 000007fffffd8000 Win32Thread: 0000000000000000 WAIT: (UserRequest) UserMode Non-Alertable

    fffffa8012a39b30  ProcessObject

Not impersonating

DeviceMap                 fffff8a000008a70

Owning Process            fffffa800a31d040       Image:         smss.exe

Attached Process          N/A            Image:         N/A

Wait Start TickCount      9752080        Ticks: 5334204 (0:23:09:06.937)

Context Switch Count      38

UserTime                  00:00:00.000

KernelTime                00:00:00.000

Win32 Start Address ntdll!TppWorkerThread (0×000000007722fbc0)

Stack Init fffff88020259db0 Current fffff88020259900

Base fffff8802025a000 Limit fffff88020254000 Call 0

Priority 11 BasePriority 11 UnusualBoost 0 ForegroundBoost 0 IoPriority 2 PagePriority 5

Kernel stack not resident.

Child-SP          RetAddr           Call Site

fffff880`20259940 fffff800`01693f92 nt!KiSwapContext+0×7a

fffff880`20259a80 fffff800`016967af nt!KiCommitThreadWait+0×1d2

fffff880`20259b10 fffff800`01984b2e nt!KeWaitForSingleObject+0×19f

fffff880`20259bb0 fffff800`0168df93 nt!NtWaitForSingleObject+0xde

fffff880`20259c20 00000000`7726135a nt!KiSystemServiceCopyEnd+0×13 (TrapFrame @ fffff880`20259c20)

00000000`0048f648 00000000`48026517 ntdll!NtWaitForSingleObject+0xa

00000000`0048f650 00000000`480269c4 smss!SmpTerminateCSR+0xa3

00000000`0048f6a0 00000000`48023670 smss!SmpStopCsr+0×44

00000000`0048f6d0 00000000`77288137 smss!SmpApiCallback+0×338

00000000`0048f900 00000000`7722feff ntdll! ?? ::FNODOBFM::`string’+0×1f718

00000000`0048f990 00000000`77274a00 ntdll!TppWorkerThread+0×3f8

00000000`0048fc90 00000000`00000000 ntdll!RtlUserThreadStart+0×25
In that process we could see a blocking module and recommended to contact its vendor:
- Dmitry Vostokov @ DumpAnalysis.org + TraceAnalysis.org -
Posted in Complete Memory Dump Analysis, Crash Dump Patterns, Debugging, x64 Windows | No Comments »
Thursday, July 14th, 2011
As a part of unified debugging pattern and generative debugging approach we extend software behavior analysis patterns such as memory dump and software trace analysis with UI abnormal behaviour patterns. Here by abnormality we mean behavior that users should not encounter while using software. Typical example is some error message or GUI distortion during execution of a functional use case. Such patterns will extend software behavior analysis pattern language we use for description of various post-construction software problems.
The first pattern we start with is called Error Message Box and we link it to Message Box and Self-Diagnosis memory analysis patterns. You can download x86 and x64 modeling examples from this location:
UIPMessageBox.zip
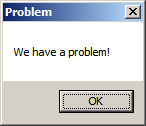
When we start the application it shows a message box:
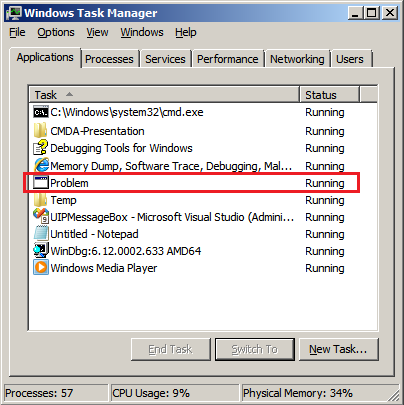
We then launch Task Manager and find the window:
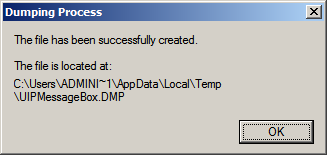
Then we save a crash dump using right-click context menu:
When we open the process memory dump we see this stack trace:
0:000> ~*kL
.  0  Id: d30.71c Suspend: 0 Teb: 000007ff`fffdd000 Unfrozen

Child-SP          RetAddr           Call Site

00000000`002ff1e8 00000000`77837214 user32!ZwUserWaitMessage+0xa

00000000`002ff1f0 00000000`778374a5 user32!DialogBox2+0x274

00000000`002ff280 00000000`778827f0 user32!InternalDialogBox+0x135

00000000`002ff2e0 00000000`77881ae5 user32!SoftModalMessageBox+0x9b4

00000000`002ff410 00000000`7788133b user32!MessageBoxWorker+0x31d

00000000`002ff5d0 00000000`77881232 user32!MessageBoxTimeoutW+0xb3

00000000`002ff6a0 00000001`3ffa101d user32!MessageBoxW+0×4e

00000000`002ff6e0 00000001`3ffa1039 UIPMessageBox!bar+0×1d

00000000`002ff710 00000001`3ffa1052 UIPMessageBox!foo+0×9

00000000`002ff740 00000001`3ffa11ea UIPMessageBox!wmain+0×12

00000000`002ff770 00000000`7770f56d UIPMessageBox!__tmainCRTStartup+0×15a

00000000`002ff7b0 00000000`77942cc1 kernel32!BaseThreadInitThunk+0xd

00000000`002ff7e0 00000000`00000000 ntdll!RtlUserThreadStart+0×1d
We see there that foo function called bar function which displayed the message box. In real scenarios function name could me more meaningful and give a clue for troubleshooting and debugging in addition to message text:
0:000> ub 00000001`3ffa101d

UIPMessageBox!__unguarded_readlc_active+0xfff:

00000001`3ffa0fff add     byte ptr [rax-7Dh],cl

00000001`3ffa1002 in      al,dx

00000001`3ffa1003 sub     byte ptr [rbp+33h],al

00000001`3ffa1006 leave

00000001`3ffa1007 lea     r8,[UIPMessageBox!__mnames+0×28 (00000001`3ffa83c8)]

00000001`3ffa100e lea     rdx,[UIPMessageBox!__mnames+0×38 (00000001`3ffa83d8)]

00000001`3ffa1015 xor     ecx,ecx

00000001`3ffa1017 call    qword ptr [UIPMessageBox!_imp_MessageBoxW (00000001`3ffa71d8)]
0:000> du 00000001`3ffa83c8

00000001`3ffa83c8  “Problem”
0:000> du 00000001`3ffa83d8

00000001`3ffa83d8  “We have a problem!”
- Dmitry Vostokov @ DumpAnalysis.org + TraceAnalysis.org -
Posted in Announcements, Crash Dump Analysis, Crash Dump Patterns, Debugging, Generative Debugging, Pattern Models, Software Behavior Patterns, UI Problem Analysis Patterns, Unified Debugging Patterns, x64 Windows | No Comments »
Thursday, July 14th, 2011
Sometimes TEB information is missing from laterally damaged dumps:
0:010> !teb

TEB at 000007fffff9c000

    ExceptionList:        0000000000000000

    StackBase:            0000000000000000

    StackLimit:           0000000000000000

    SubSystemTib:         0000000000000000

    FiberData:            0000000000000000

    ArbitraryUserPointer: 0000000000000000

    Self:                 0000000000000000

    EnvironmentPointer:   0000000000000000

    ClientId:             0000000000000000 . 0000000000000000

    RpcHandle:            0000000000000000

    Tls Storage:          0000000000000000

    PEB Address:          0000000000000000

    LastErrorValue:       0

    LastStatusValue:      0

    Count Owned Locks:    0

    HardErrorMode:        0
In such cases if stack trace is present we can get raw stack data with associated symbolic information by using ChildEBP (x86) or Child-SP (x64) columns:
0:010> kL

Child-SP          RetAddr           Call Site

00000000`0310ec88 000007fe`fd2313a6 ntdll!NtWaitForMultipleObjects+0xa

00000000`0310ec90 00000000`77023143 KERNELBASE!WaitForMultipleObjectsEx+0xe8

00000000`0310ed90 00000000`77099025 kernel32!WaitForMultipleObjectsExImplementation+0xb3

00000000`0310ee20 00000000`770991a7 kernel32!WerpReportFaultInternal+0×215

00000000`0310eec0 00000000`770991ff kernel32!WerpReportFault+0×77

00000000`0310eef0 00000000`7709941c kernel32!BasepReportFault+0×1f

00000000`0310ef20 00000000`772b6228 kernel32!UnhandledExceptionFilter+0×1fc

00000000`0310f000 00000000`77234f48 ntdll! ?? ::FNODOBFM::`string’+0×22c5

00000000`0310f030 00000000`77254f6d ntdll!_C_specific_handler+0×8c

00000000`0310f0a0 00000000`77235b2c ntdll!RtlpExecuteHandlerForException+0xd

00000000`0310f0d0 00000000`7726f638 ntdll!RtlDispatchException+0×3cb

00000000`0310f7b0 00000000`000a1760 ntdll!KiUserExceptionDispatcher+0×2e

00000000`0310fd68 000007fe`f6c1ba28 0xa1760

00000000`0310fd70 000007fe`fb5c4744 ModuleA!Close+0×88

00000000`0310fdb0 000007fe`fb5c7603 ModuleB!Close+0×38

00000000`0310fde0 00000000`7701f56d ModuleB!WorkItem+0×5b

00000000`0310fe10 00000000`77252cc1 kernel32!BaseThreadInitThunk+0xd

00000000`0310fe40 00000000`00000000 ntdll!RtlUserThreadStart+0×1d
0:010> dps 00000000`0310ec88 00000000`0310fe40

00000000`0310ec88  000007fe`fd2313a6 KERNELBASE!WaitForMultipleObjectsEx+0xe8

[…]

00000000`0310fe38  00000000`77252cc1 ntdll!RtlUserThreadStart+0×1d

00000000`0310fe40  00000000`00000000
- Dmitry Vostokov @ DumpAnalysis.org + TraceAnalysis.org -
Posted in Crash Dump Patterns, Debugging, WinDbg Tips and Tricks, x64 Windows | No Comments »
Saturday, June 25th, 2011
In addition to Blocked Thread, endpoint threads of Wait Chain patterns, and Blocking Module we would like to add Blocking File pattern that often happen (but not limited to) in roaming profile scenarios. For example, an application was reported hanging and in a complete memory dump we can see a thread in stack trace collection:
THREAD fffffa8005eca060  Cid 14b0.1fec  Teb: 000000007ef84000 Win32Thread: fffff900c26c2c30 WAIT: (Executive) KernelMode Non-Alertable

        fffffa80048e6758  NotificationEvent

IRP List:

       fffffa8005a6c160: (0006,03e8) Flags: 00060000  Mdl: 00000000

Not impersonating

DeviceMap                 fffff8a0055b6620

Owning Process            fffffa80063dd970       Image:         Application.exe

Attached Process          N/A            Image:         N/A

Wait Start TickCount      171988390      Ticks: 26963639 (4:21:01:46.859)

Context Switch Count      226                 LargeStack

UserTime                  00:00:00.015

KernelTime                00:00:00.015

Win32 Start Address 0×000000006d851f62

Stack Init fffff880075a9db0 Current fffff880075a9770

Base fffff880075aa000 Limit fffff880075a4000 Call 0

Priority 10 BasePriority 8 UnusualBoost 0 ForegroundBoost 2 IoPriority 2 PagePriority 5

Child-SP          RetAddr           Call Site

fffff880`075a97b0 fffff800`0167f752 nt!KiSwapContext+0×7a

fffff880`075a98f0 fffff800`016818af nt!KiCommitThreadWait+0×1d2

fffff880`075a9980 fffff800`019b612a nt!KeWaitForSingleObject+0×19f

fffff880`075a9a20 fffff800`0198feaa nt! ?? ::NNGAKEGL::`string’+0×1d61a

fffff880`075a9a60 fffff800`018ed0e3 nt!IopSynchronousServiceTail+0×35a

fffff880`075a9ad0 fffff800`01677853 nt!NtLockFile+0×514

fffff880`075a9bb0 00000000`77840cea nt!KiSystemServiceCopyEnd+0×13 (TrapFrame @ fffff880`075a9c20)

00000000`0798e488 00000000`7543293b ntdll!ZwLockFile+0xa

00000000`0798e490 00000000`7541cf87 wow64!whNtLockFile+0×7f

00000000`0798e510 00000000`7536276d wow64!Wow64SystemServiceEx+0xd7

00000000`0798edd0 00000000`7541d07e wow64cpu!TurboDispatchJumpAddressEnd+0×24

00000000`0798ee90 00000000`7541c549 wow64!RunCpuSimulation+0xa

00000000`0798eee0 00000000`7786d177 wow64!Wow64LdrpInitialize+0×429

00000000`0798f430 00000000`7782308e ntdll! ?? ::FNODOBFM::`string’+0×2bfe4

00000000`0798f4a0 00000000`00000000 ntdll!LdrInitializeThunk+0xe
We immediately spot the anomaly of a lock file attempt and look at its IRP:
0: kd> !irp fffffa8005a6c160

Irp is active with 7 stacks 7 is current (= 0xfffffa8005a6c3e0)

 No Mdl: No System Buffer: Thread fffffa8005eca060:  Irp stack trace.

     cmd  flg cl Device   File     Completion-Context

 [  0, 0]   0  2 00000000 00000000 00000000-00000000
   Args: 00000000 00000000 00000000 ffffffffc000020c

 [  0, 0]   0  0 00000000 00000000 00000000-00000000
   Args: 00000000 00000000 00000000 00000000

 [  0, 0]   0  0 00000000 00000000 00000000-00000000
   Args: 00000000 00000000 00000000 00000000

 [  0, 0]   0  0 00000000 00000000 00000000-00000000
   Args: 00000000 00000000 00000000 00000000

 [  0, 0]   0  0 00000000 00000000 00000000-00000000
   Args: 00000000 00000000 00000000 00000000

 [ 11, 0]   0  2 fffffa8004da0620 00000000 fffff8800177d9cc-fffffa800710e580

        \FileSystem\mrxsmb mup!MupiUncProviderCompletion

   Args: 00000000 00000000 00000000 00000000

>[ 11, 1]   0  0 fffffa8004066400 fffffa80048e66c0 00000000-00000000

        \FileSystem\Mup

   Args: fffffa8004a98120 00000001 00000000 00000000
From that IRP we see a file name:
0: kd> !fileobj fffffa80048e66c0
[...]\AppData\Roaming\Vendor\Product\Recent\index.dat
LockOperation Set  Device Object: 0xfffffa8004066400   \FileSystem\Mup

Vpb is NULL

Access: Read SharedRead SharedWrite SharedDelete
Flags:  0x40002

 Synchronous IO

 Handle Created
File Object is currently busy and has 0 waiters.
FsContext: 0xfffff8a00e8d9010 FsContext2: 0xfffff8a012e4d688

CurrentByteOffset: 0

Cache Data:

  Section Object Pointers: fffffa8006086928

  Shared Cache Map: 00000000

File object extension is at fffffa8005c8cbe0:
Alternatively we get a 32-bit stack trace from the virtualized process:
0: kd> .process /r /p fffffa80063dd970

Implicit process is now fffffa80`063dd970

Loading User Symbols
0: kd> .thread /w fffffa8005eca060

Implicit thread is now fffffa80`05eca060

The context is partially valid. Only x86 user-mode context is available.

x86 context set
0: kd:x86> .reload

Loading Kernel Symbols

Loading User Symbols

Loading unloaded module list

Loading Wow64 Symbols
0: kd:x86> kv

  *** Stack trace for last set context - .thread/.cxr resets it

ChildEBP RetAddr  Args to Child

07ac8510 774f033f 00000390 00000000 00000000 ntdll_779d0000!ZwLockFile+0×12

07ac8590 774f00d3 061b2b68 ada9964d c0000016 kernel32!BaseDllOpenIniFileOnDisk+0×246

07ac85d0 774efae9 061b2b68 00001000 6d352f20 kernel32!BaseDllReadWriteIniFileOnDisk+0×2d

07ac85e8 775001bf 00000001 00000000 061b2b68 kernel32!BaseDllReadWriteIniFile+0xed

07ac861c 6d928401 07aca71c 00000000 00001000 kernel32!GetPrivateProfileStringW+0×35

WARNING: Stack unwind information not available. Following frames may be wrong.

07ac8640 6d9282f5 07aca71c 00000000 00000000 DLL+0×618401

[…]

07acfb14 774e3677 06757d20 07acfb60 77a09d72 DLL+0×541f6d

07acfb20 77a09d72 06757d20 eca51e43 00000000 kernel32!BaseThreadInitThunk+0xe

07acfb60 77a09d45 6d851f62 06757d20 ffffffff ntdll_779d0000!__RtlUserThreadStart+0×70

07acfb78 00000000 6d851f62 06757d20 00000000 ntdll_779d0000!_RtlUserThreadStart+0×1b
We get the same file name from a file handle:
0: kd> !handle 00000390

processor number 0, process fffffa80063dd970

PROCESS fffffa80063dd970

    SessionId: 5  Cid: 14b0    Peb: 7efdf000  ParentCid: 1fac

    DirBase: 48293000  ObjectTable: fffff8a010515f90  HandleCount: 342.

    Image: Application.exe
Handle table at fffff8a0083e9000 with 444 Entries in use

0390: Object: fffffa80048e66c0  GrantedAccess: 00120089 Entry: fffff8a00866fe40

Object: fffffa80048e66c0  Type: (fffffa8003cf0b40) File

    ObjectHeader: fffffa80048e6690 (new version)

        HandleCount: 1  PointerCount: 3

        Directory Object: 00000000  Name: […]\AppData\Roaming\Vendor\Product\Recent\index.dat {Mup}
We also c0000016 error code on raw stack and examine it too:
0: kd> !error c0000016

Error code: (NTSTATUS) 0xc0000016 (3221225494) - {Still Busy}  The specified I/O request packet (IRP) cannot be disposed of because the I/O operation is not complete.
- Dmitry Vostokov @ DumpAnalysis.org + TraceAnalysis.org -
Posted in Complete Memory Dump Analysis, Crash Dump Analysis, Crash Dump Patterns, Debugging, x64 Windows | No Comments »
Saturday, June 18th, 2011
A service written in one of .NET languages was described as crashing and a process dump was collected for analysis. The default analysis command couldn’t an exception so we had to look at stack trace collection to find any anomalies. Indeed, there was a thread with message box code:
0:010> kL

Child-SP          RetAddr           Call Site

00000000`1f69e808 00000000`774b4bc4 user32!ZwUserWaitMessage+0xa

00000000`1f69e810 00000000`774b4edd user32!DialogBox2+0x274

00000000`1f69e8a0 00000000`77502920 user32!InternalDialogBox+0x135

00000000`1f69e900 00000000`77501c15 user32!SoftModalMessageBox+0x9b4

00000000`1f69ea30 00000000`7750146b user32!MessageBoxWorker+0x31d

00000000`1f69ebf0 00000000`77501362 user32!MessageBoxTimeoutW+0xb3

00000000`1f69ecc0 000007fe`f1590ce7 user32!MessageBoxW+0×4e

00000000`1f69ed00 000007fe`eb0f5c59 mscorwks!DoNDirectCall__PatchGetThreadCall+0×7b

[…]
MessageBoxW parameters were showing self-diagnosis pattern with a stack trace:
0:010> du 00000000`085f90c8

00000000`085f90c8  "......    at ClassA.foo()”

[…]
0:010> du 00000000`085f9c40

00000000`085f9c40  "Assertion Failed: Abort=Quit, Re"

00000000`085f9c80  "try=Debug, Ignore=Continue"
We tried unsuccessfully to load CLR extensions and requested the copy of .NET Framework from the affected computer. After that we were able to load version-specific extension, see managed stack trace and managed code exception:
0:010> !DumpStack

OS Thread Id: 0x8dc (15)

Child-SP         RetAddr          Call Site

000000001f69e808 00000000774b4bc4 user32!ZwUserWaitMessage+0xa

000000001f69e810 00000000774b4edd user32!DialogBox2+0x274

000000001f69e8a0 0000000077502920 user32!InternalDialogBox+0x135

000000001f69e900 0000000077501c15 user32!SoftModalMessageBox+0x9b4

000000001f69ea30 000000007750146b user32!MessageBoxWorker+0x31d

000000001f69ebf0 0000000077501362 user32!MessageBoxTimeoutW+0xb3

000000001f69ecc0 000007fef1590ce7 user32!MessageBoxW+0x4e

000000001f69ed00 000007feeb0f5c59 mscorwks!DoNDirectCall__PatchGetThreadCall+0x7b

[...]

000000001f69e030 000007ff00a9ba1c ModuleA!ClassA.foo()+0×47

[…]

000000001f69fe30 000000007781c521 kernel32!BaseThreadInitThunk+0xd

000000001f69fe60 0000000000000000 ntdll!RtlUserThreadStart+0×1d
0:010> ~0s
0:000> !pe

Exception object: 0000000005a976b8

Exception type: System.FormatException

Message: Index (zero based) must be greater than or equal to zero and less than the size of the argument list.

InnerException: <none>

StackTrace (generated):

    SP               IP               Function

    0000000000D0BE40 000007FEEC2153B0 mscorlib_ni!System.Text.StringBuilder.AppendFormat(System.IFormatProvider, System.String, System.Object[])+0x999280

    0000000000D0BEE0 000007FEEB87C0FA mscorlib_ni!System.String.Format(System.IFormatProvider, System.String, System.Object[])+0x5a

    0000000000D0BF30 000007FF00AB336B ModuleA!ClassB.get()+0xeb
- Dmitry Vostokov @ DumpAnalysis.org + TraceAnalysis.org -
Posted in .NET Debugging, Crash Dump Analysis, Crash Dump Patterns, Debugging, x64 Windows | No Comments »
Wednesday, June 1st, 2011
Version-Specific Extension is a pattern similar to Platform-Specific Debugger pattern by suggesting the course of the further debugging actions. Similar instructions are given when a debugger depends on specialized modules differing from platform (or application) version. We consider here a .NET example where opening a dump shows only that it was perhaps saved manually with possible hidden exceptions that need to be dug out:
0:000> !analyze -v
FAULTING_IP:

+0

00000000`00000000 ??              ???
EXCEPTION_RECORD:  ffffffffffffffff -- (.exr 0xffffffffffffffff)

ExceptionAddress: 0000000000000000

   ExceptionCode: 80000003 (Break instruction exception)

  ExceptionFlags: 00000000

NumberParameters: 0
We notice a failed attempt for .NET analysis and the following instructions on how correct it:
MANAGED_STACK: !dumpstack -EE

Failed to load data access DLL, 0×80004005

Verify that 1) you have a recent build of the debugger (6.2.14 or newer)

            2) the file mscordacwks.dll that matches your version of mscorwks.dll is in the version directory

            3) or, if you are debugging a dump file, verify that the file mscordacwks_<arch>_<arch>_<version>.dll is on your symbol path.

            4) you are debugging on the same architecture as the dump file. For example, an IA64 dump file must be debugged on an IA64 machine.
You can also run the debugger command .cordll to control the debugger's load of mscordacwks.dll. .cordll -ve -u -l will do a verbose reload. If that succeeds, the SOS command should work on retry.
If you are debugging a minidump, you need to make sure that your executable path is pointing to mscorwks.dll as well.
Because we know that we have .NET framework installed on a postmortem debugging machine we check the target module version:
0:000> lmv m mscorwks

start             end                 module name

000007fe`ee380000 000007fe`eed1d000   mscorwks   (pdb symbols)

    Loaded symbol image file: mscorwks.dll

    Image path: C:\Windows\Microsoft.NET\Framework64\v2.0.50727\mscorwks.dll

    Image name: mscorwks.dll

    Timestamp:        Sun Feb 06 20:53:54 2011 (4D4F0A62)

    CheckSum:         00990593

    ImageSize:        0099D000

    File version:     2.0.50727.5444

    Product version:  2.0.50727.5444

    File flags:       0 (Mask 3F)

    File OS:          4 Unknown Win32

    File type:        2.0 Dll

    File date:        00000000.00000000

    Translations:     0409.04b0

    CompanyName:      Microsoft Corporation

    ProductName:      Microsoft® .NET Framework

    InternalName:     mscorwks.dll

    OriginalFilename: mscorwks.dll

    ProductVersion:   2.0.50727.5444

    FileVersion:      2.0.50727.5444 (Win7SP1GDR.050727-5400)

    FileDescription:  Microsoft .NET Runtime Common Language Runtime - WorkStation

    LegalCopyright:   © Microsoft Corporation.  All rights reserved.

    Comments:         Flavor=Retail
It is slightly newer (.5444) than we have installed (.3619). The customer also sent their framework version together with the memory dump file. So we unload the current SOS extension (for details please see Managed Code Exception pattern):
0:000> .chain

Extension DLL chain:

    C:\Windows\Microsoft.NET\Framework64\v2.0.50727\sos: image 2.0.50727.3619, API 1.0.0, built Mon Oct 25 06:52:09 2010

        [path: C:\Windows\Microsoft.NET\Framework64\v2.0.50727\sos.dll]

    dbghelp: image 6.11.0001.404, API 6.1.6, built Thu Feb 26 02:10:27 2009

        [path: C:\Program Files\Debugging Tools for Windows (x64)\dbghelp.dll]

    ext: image 6.11.0001.404, API 1.0.0, built Thu Feb 26 02:10:26 2009

        [path: C:\Program Files\Debugging Tools for Windows (x64)\winext\ext.dll]

    exts: image 6.11.0001.404, API 1.0.0, built Thu Feb 26 02:10:17 2009

        [path: C:\Program Files\Debugging Tools for Windows (x64)\WINXP\exts.dll]

    uext: image 6.11.0001.404, API 1.0.0, built Thu Feb 26 02:10:20 2009

        [path: C:\Program Files\Debugging Tools for Windows (x64)\winext\uext.dll]

    ntsdexts: image 6.1.7015.0, API 1.0.0, built Thu Feb 26 02:09:22 2009

        [path: C:\Program Files\Debugging Tools for Windows (x64)\WINXP\ntsdexts.dll]
0:000> .unload C:\Windows\Microsoft.NET\Framework64\v2.0.50727\sos

Unloading C:\Windows\Microsoft.NET\Framework64\v2.0.50727\sos extension DLL
and load the customer version:
0:000> .load \MyData\sos.dll
0:000> .chain

Extension DLL chain:

    \MyDatasos.dll: image 2.0.50727.5444, API 1.0.0, built Sun Feb 06 21:14:12 2011

        [path: \MyData\sos.dll]

    dbghelp: image 6.11.0001.404, API 6.1.6, built Thu Feb 26 02:10:27 2009

        [path: C:\Program Files\Debugging Tools for Windows (x64)\dbghelp.dll]

    ext: image 6.11.0001.404, API 1.0.0, built Thu Feb 26 02:10:26 2009

        [path: C:\Program Files\Debugging Tools for Windows (x64)\winext\ext.dll]

    exts: image 6.11.0001.404, API 1.0.0, built Thu Feb 26 02:10:17 2009

        [path: C:\Program Files\Debugging Tools for Windows (x64)\WINXP\exts.dll]

    uext: image 6.11.0001.404, API 1.0.0, built Thu Feb 26 02:10:20 2009

        [path: C:\Program Files\Debugging Tools for Windows (x64)\winext\uext.dll]

    ntsdexts: image 6.1.7015.0, API 1.0.0, built Thu Feb 26 02:09:22 2009

        [path: C:\Program Files\Debugging Tools for Windows (x64)\WINXP\ntsdexts.dll]
0:000> .cordll -ve -u -l

CLR DLL status: No load attempts
Then we do a load attempt:
0:000> !CLRStack

CLRDLL: C:\Windows\Microsoft.NET\Framework64\v2.0.50727\mscordacwks.dll:2.0.50727.3619 f:0

doesn't match desired version 2.0.50727.5444 f:0

CLRDLL: Unable to find mscordacwks_AMD64_AMD64_2.0.50727.5444.dll by mscorwks search

CLRDLL: Unable to find ‘mscordacwks_AMD64_AMD64_2.0.50727.5444.dll’ on the path

CLRDLL: Unable to get version info for ‘c:\mss\mscorwks.dll\4D4F0A6299d000\mscordacwks_AMD64_AMD64_2.0.50727.5444.dll’, Win32 error 0n87

CLRDLL: ERROR: Unable to load DLL mscordacwks_AMD64_AMD64_2.0.50727.5444.dll, Win32 error 0n87

Failed to load data access DLL, 0×80004005

Verify that 1) you have a recent build of the debugger (6.2.14 or newer)

            2) the file mscordacwks.dll that matches your version of mscorwks.dll is in the version directory

            3) or, if you are debugging a dump file, verify that the file mscordacwks_<arch>_<arch>_<version>.dll is on your symbol path.

            4) you are debugging on the same architecture as the dump file. For example, an IA64 dump file must be debugged on an IA64 machine.
You can also run the debugger command .cordll to control the debugger's load of mscordacwks.dll. .cordll -ve -u -l will do a verbose reload. If that succeeds, the SOS command should work on retry.
If you are debugging a minidump, you need to make sure that your executable path is pointing to mscorwks.dll as well.
We rename mscordacwks.dll to mscordacwks_AMD64_AMD64_2.0.50727.5444.dll and retry:
0:000> .cordll -ve -u -l

CLR DLL status: No load attempts
0:000> !CLRStack

CLRDLL: C:\Windows\Microsoft.NET\Framework64\v2.0.50727\mscordacwks.dll:2.0.50727.3619 f:0

doesn't match desired version 2.0.50727.5444 f:0

CLRDLL: Loaded DLL \MyData\mscordacwks_AMD64_AMD64_2.0.50727.5444.dll

OS Thread Id: 0×16e8 (0)

Child-SP         RetAddr          Call Site

00000000002fe570 000007feeaf8e378 System.Windows.Forms.Application+ComponentManager.System.Windows.Forms. UnsafeNativeMethods.IMsoComponentManager.FPushMessageLoop(Int32, Int32, Int32)

00000000002fe7c0 000007feeaf8dde5 System.Windows.Forms.Application+ThreadContext.RunMessageLoopInner(Int32, System.Windows.Forms.ApplicationContext)

00000000002fe910 000007ff002364b6 System.Windows.Forms.Application+ThreadContext.RunMessageLoop(Int32, System.Windows.Forms.ApplicationContext)

00000000002fe970 000007feee6414c2 MyApplication.Main(System.String[])
0:000> !pe

Exception object: 00000000034a13f8

Exception type: System.IO.FileNotFoundException

Message: Could not load file or assembly 'System.Windows.Forms.XmlSerializers, Version=2.0.0.0, Culture=neutral, PublicKeyToken= ...' or one of its dependencies. The system cannot find the file specified.

InnerException: System.IO.FileNotFoundException, use !PrintException 00000000034a1b28 to see more

StackTrace (generated):

    SP               IP               Function

    00000000002FD0A0 0000000000000001 mscorlib_ni!System.Reflection.Assembly._nLoad(System.Reflection.AssemblyName, System.String, System.Security.Policy.Evidence, System.Reflection.Assembly, System.Threading.StackCrawlMark ByRef, Boolean, Boolean)+0x2

    00000000002FD0A0 000007FEED7ABF61 mscorlib_ni!System.Reflection.Assembly.InternalLoad(System.Reflection.AssemblyName, System.Security.Policy.Evidence, System.Threading.StackCrawlMark ByRef, Boolean)+0x1a1

    00000000002FD130 000007FEED7E4804 mscorlib_ni!System.Reflection.Assembly.Load(System.Reflection.AssemblyName)+0x24

    00000000002FD170 000007FEE7855C0A System_Xml_ni!System.Xml.Serialization.TempAssembly.LoadGeneratedAssembly(System.Type, System.String, System.Xml.Serialization.XmlSerializerImplementation ByRef)+0x11a
StackTraceString: <none>

HResult: 80070002
0:000> !PrintException 00000000034a1b28

Exception object: 00000000034a1b28

Exception type: System.IO.FileNotFoundException

Message: Could not load file or assembly 'System.Windows.Forms.XmlSerializers, Version=2.0.0.0, Culture=neutral, PublicKeyToken=...' or one of its dependencies. The system cannot find the file specified.

InnerException: <none>

StackTrace (generated):

<none>

StackTraceString: <none>

HResult: 80070002
- Dmitry Vostokov @ DumpAnalysis.org + TraceAnalysis.org -
Posted in .NET Debugging, Crash Dump Analysis, Crash Dump Patterns, Debugging, WinDbg Tips and Tricks, x64 Windows | No Comments »
Sunday, May 8th, 2011
Learn how to analyze application, service and system crashes and freezes, navigate through memory dump space and diagnose heap corruption, memory leaks, CPU spikes, blocked threads, deadlocks, wait chains, and much more. We use a unique and innovative pattern-driven analysis approach to speed up the learning curve.
Memory Dump Analysis Services organizes a training course.
If you are registered you are allowed to optionally submit your memory dumps before the training. This will allow us in addition to the carefully constructed problems tailor extra examples to the needs of the attendees. All registrants will receive an optional pre-test before the first session and an optional test after each session.
The training consists of 2 four-hour sessions (4 hours on the first day and 4 hours on the next day). When you finish the training you additionally get:
- A full transcript in PDF format (retail price $200)
- 5 volumes of Memory Dump Analysis Anthology in PDF format (retail price $100)
- An attendance certificate (PDF format)
Prerequisites: Basic Windows troubleshooting
Session 1: August 1, 2011 2:00 PM - 6:00 PM BST
Session 2: August 2, 2011 2:00 PM - 6:00 PM BST
Price: 210 USD
Space is limited.
Reserve your remote training seat now.
- Dmitry Vostokov @ DumpAnalysis.org + TraceAnalysis.org -
Posted in Announcements, Crash Dump Analysis, Crash Dump Patterns, Memory Dump Analysis Services, Software Technical Support, Testing, Tools, Training and Seminars, Vista, WinDbg Tips and Tricks, Windows 7, Windows Server 2008, Windows System Administration, x64 Windows | No Comments »
Sunday, April 17th, 2011
I’m pleased to announce that MDAA, Volume 5 is available in PDF format:
www.dumpanalysis.org/Memory+Dump+Analysis+Anthology+Volume+5
It features:
- 25 new crash dump analysis patterns
- 11 new pattern interaction case studies (including software tracing)
- 16 new trace analysis patterns
- 7 structural memory patterns
- 4 modeling case studies for memory dump analysis patterns
- Discussion of 3 common analysis mistakes
- Malware analysis case study
- Computer independent architecture of crash analysis report service
- Expanded coverage of software narratology
- Metaphysical and theological implications of memory dump worldview
- More pictures of memory space and physicalist art
- Classification of memory visualization tools
- Memory visualization case studies
- Close reading of the stories of Sherlock Holmes: Dr. Watson’s observational patterns
- Fully cross-referenced with Volume 1, Volume 2, Volume 3, and Volume 4
Its table of contents is available here:
www.dumpanalysis.org/MDAA/MDA-Anthology-V5-TOC.pdf
Paperback and hardcover versions should be available in a week or two. I also started working on Volume 6 that should be available in November-December.
- Dmitry Vostokov @ DumpAnalysis.org + TraceAnalysis.org -
Posted in Aesthetics of Memory Dumps, Analysis Notation, Announcements, AntiPatterns, Archaeology of Computer Memory, Art, Assembly Language, Best Practices, Books, C and C++, CDF Analysis Tips and Tricks, Categorical Debugging, Citrix, Common Mistakes, Common Questions, Complete Memory Dump Analysis, Computer Forensics, Computer Science, Crash Analysis Report Environment (CARE), Crash Dump Analysis, Crash Dump De-analysis, Crash Dump Patterns, Crash Dumps for Dummies, Cyber Warfare, Debugging, Debugging Bureau, Debugging Industry, Debugging Methodology, Debugging Slang, Debugging Trends, Deep Down C++, Dr. Watson, Dublin School of Security, Education and Research, Escalation Engineering, Fun with Crash Dumps, Fun with Debugging, Fun with Software Traces, General Memory Analysis, Hermeneutics of Memory Dumps and Traces, Images of Computer Memory, Kernel Development, Malware Analysis, Mathematics of Debugging, Memiotics (Memory Semiotics), Memory Analysis Forensics and Intelligence, Memory Diagrams, Memory Dump Analysis Services, Memory Dumps in Myths, Memory Space Art, Memory Systems Language, Memory Visualization, Memory and Glitches, Metaphysics of Memory Worldview, Multithreading, Music for Debugging, New Acronyms, New Debugging School, New Words, Pattern Models, Philosophy, Physicalist Art, Publishing, Reverse Engineering, Science of Memory Dump Analysis, Science of Software Tracing, Security, Software Architecture, Software Behavior Patterns, Software Chorography, Software Chorology, Software Defect Construction, Software Engineering, Software Generalist, Software Maintenance Institute, Software Narratology, Software Technical Support, Software Trace Analysis, Software Trace Reading, Software Trace Visualization, Software Tracing for Dummies, Software Troubleshooting Patterns, Software Victimology, Structural Memory Patterns, Structural Trace Patterns, Systems Thinking, Testing, The Way of Philip Marlowe, Tools, Trace Analysis Patterns, Training and Seminars, Troubleshooting Methodology, Victimware, Vista, Webinars, WinDbg Scripting Extensions, WinDbg Scripts, WinDbg Tips and Tricks, WinDbg for GDB Users, Windows 7, Windows Server 2008, Windows System Administration, Workaround Patterns, x64 Windows | No Comments »
Tuesday, April 5th, 2011
This is a kernel space counterpart to Custom Exception Handler pattern in user space. In the following stack trace below we see that DriverA code intercepted an access violation exception resulted from dereferencing a NULL pointer and generated a custom bugcheck:
kd> !analyze -v
[...]
EXCEPTION_RECORD: fffff8801c757158 -- (.exr 0xfffff8801c757158)

ExceptionAddress: fffff88003977de1 (DriverA!foo+0x0000000000000381)

ExceptionCode: c0000005 (Access violation)

  ExceptionFlags: 00000000

NumberParameters: 2

  Parameter[0]: 0000000000000000

  Parameter[1]: 0000000000000070

Attempt to read from address 0000000000000070
TRAP_FRAME: fffff8801c757200 -- (.trap 0xfffff8801c757200)

NOTE: The trap frame does not contain all registers.

Some register values may be zeroed or incorrect.

rax=0000000000000000 rbx=0000000000000000 rcx=fffff8a00da3f3c0

rdx=0000000000000000 rsi=0000000000000000 rdi=0000000000000000

rip=fffff88003977de1 rsp=fffff8801c757390 rbp=fffffa8009a853f0

 r8=0000000000000000 r9=0000000000000000 r10=006800740020006e

r11=fffff8a00da3f3c6 r12=0000000000000000 r13=0000000000000000

r14=0000000000000000 r15=0000000000000000

iopl=0 nv up ei pl zr na po nc

DriverA!foo+0×381:

fffff880`03977de1 0fb74070 movzx eax,word ptr [rax+70h] ds:0703:0070=????

Resetting default scope
[...]
kd> kL 100

Child-SP          RetAddr           Call Site

fffff880`1c7560f8 fffff880`039498f7 nt!KeBugCheckEx

fffff880`1c756100 fffff880`039352a0 DriverA!MyBugCheckEx+0×93

fffff880`1c756140 fffff800`016f1d1c DriverA!MyExceptionFilter+0×1d0

fffff880`1c756210 fffff800`016e940d nt!_C_specific_handler+0×8c

fffff880`1c756280 fffff800`016f0a90 nt!RtlpExecuteHandlerForException+0xd

fffff880`1c7562b0 fffff800`016fd9ef nt!RtlDispatchException+0×410

fffff880`1c756990 fffff800`016c2d82 nt!KiDispatchException+0×16f

fffff880`1c757020 fffff800`016c18fa nt!KiExceptionDispatch+0xc2

fffff880`1c757200 fffff880`03977de1 nt!KiPageFault+0×23a

fffff880`1c757390 fffff880`03977754 DriverA!foo+0×381

fffff880`1c757430 fffff880`0396f006 DriverA!bar+0×74

[…]

fffff880`1c7579b0 fffff800`019a6e0a DriverA!QueryInformation+0×30b

fffff880`1c757a70 fffff800`016c2993 nt!NtQueryInformationFile+0×535

fffff880`1c757bb0 00000000`76e5fe6a nt!KiSystemServiceCopyEnd+0×13

00000000`0a08dfe8 00000000`00000000 0×76e5fe6a
kd> !exchain

24 stack frames, scanning for handlers...

Frame 0×05: nt!RtlpExecuteHandlerForException+0xd (fffff800`016e940d)

  ehandler nt!RtlpExceptionHandler (fffff800`016e93d0)

Frame 0×07: nt!KiDispatchException+0×16f (fffff800`016fd9ef)

  ehandler nt!_GSHandlerCheck_SEH (fffff800`0169aec0)

Frame 0×0b: DriverA!bar+0×74 (fffff880`03977754)

  ehandler DriverA!__GSHandlerCheck (fffff880`039a12fc)

[…]

Frame 0×14: DriverA!QueryInformation+0×30b (fffff880`039303ab)

  ehandler DriverA!_C_specific_handler (fffff880`039a1864)

Frame 0×15: nt!NtQueryInformationFile+0×535 (fffff800`019a6e0a)

  ehandler nt!_C_specific_handler (fffff800`016f1c90)

Frame 0×16: nt!KiSystemServiceCopyEnd+0×13 (fffff800`016c2993)

  ehandler nt!KiSystemServiceHandler (fffff800`016c2580)

Frame 0×17: error getting module for 0000000076e5fe6a
- Dmitry Vostokov @ DumpAnalysis.org + TraceAnalysis.org -
Posted in Crash Dump Analysis, Crash Dump Patterns, Debugging, Kernel Development, x64 Windows | No Comments »
Saturday, February 19th, 2011
This part starts the block of patterns called Semantic Structures. These structures are fragments of memory which have meaning helping us in troubleshooting and debugging. The first pattern in this block deals with PID.TID structures of the form DWORD : DWORD or QWORD : QWORD. Such memory fragments are useful for wait chain analysis, for example, by looking at the excution residue left on a raw stack to find a target or an origin of RPC or (A)LPC calls. RPC target example can be found in the post: In Search of Lost CID. Here we look at another example, this time to find the originator of an ALPC call.
A ServiceA was executing some undesired functionality and a breakpoint was set on ModuleA code to trigger it under unreproducible conditions. Then a complete memory dump was saved for offline analysis. There we see an ALPC server thread that triggered the breakpoint but don’t see the message information in the output of WinDbg !thread command that can help us finding an ALPC client thread easily:
THREAD fffffa8005e6b060  Cid 0cc0.1838  Teb: 000007fffff8e000 Win32Thread: 0000000000000000 WAIT: (Executive) KernelMode Non-Alertable

SuspendCount 1

    fffff880094ad0a0  SynchronizationEvent

Not impersonating

DeviceMap                 fffff8a001aba3c0

Owning Process            fffffa8004803b30       Image:         ServiceA.exe

Attached Process          N/A            Image:         N/A

Wait Start TickCount      1441562        Ticks: 106618 (0:00:27:43.251)

Context Switch Count      414

UserTime                  00:00:00.000

KernelTime                00:00:00.031

Win32 Start Address ntdll!TppWorkerThread (0×0000000077c88f00)

Stack Init fffff880094addb0 Current fffff880094acdb0

Base fffff880094ae000 Limit fffff880094a8000 Call 0

Priority 12 BasePriority 10 UnusualBoost 0 ForegroundBoost 0 IoPriority 2 PagePriority 5

Child-SP          RetAddr           Call Site

fffff880`094acdf0 fffff800`01678992 nt!KiSwapContext+0×7a

fffff880`094acf30 fffff800`0167acff nt!KiCommitThreadWait+0×1d2

fffff880`094acfc0 fffff800`01a150e8 nt!KeWaitForSingleObject+0×19f

fffff880`094ad060 fffff800`01a1546c nt!DbgkpQueueMessage+0×2a8

fffff880`094ad230 fffff800`019b9116 nt!DbgkpSendApiMessage+0×5c

fffff880`094ad270 fffff800`016abb96 nt! ?? ::NNGAKEGL::`string’+0×3463d

fffff880`094ad3b0 fffff800`01670d82 nt!KiDispatchException+0×316

fffff880`094ada40 fffff800`0166ebb4 nt!KiExceptionDispatch+0xc2

fffff880`094adc20 000007fe`f79365d1 nt!KiBreakpointTrap+0xf4 (TrapFrame @ fffff880`094adc20)

00000000`035ee568 000007fe`f80670b5 ModuleA+0×38611

[…]

00000000`035ee5d0 000007fe`ff4bc7f5 ModuleB!Start+0×6e1

00000000`035ee770 000007fe`ff56b62e RPCRT4!Invoke+0×65

00000000`035ee7c0 000007fe`ff4bf1f6 RPCRT4!Ndr64StubWorker+0×61b

00000000`035eed80 000007fe`ffedf223 RPCRT4!NdrStubCall3+0xb5

00000000`035eede0 000007fe`ffedfc0d ole32!CStdStubBuffer_Invoke+0×5b

00000000`035eee10 000007fe`ffedfb83 ole32!SyncStubInvoke+0×5d

00000000`035eee80 000007fe`ffd7fd60 ole32!StubInvoke+0xdb

00000000`035eef30 000007fe`ffedfa22 ole32!CCtxComChnl::ContextInvoke+0×190

00000000`035ef0c0 000007fe`ffedf76b ole32!AppInvoke+0xc2

00000000`035ef130 000007fe`ffeded6d ole32!ComInvokeWithLockAndIPID+0×52b

00000000`035ef2c0 000007fe`ff4b9c24 ole32!ThreadInvoke+0×30d

00000000`035ef360 000007fe`ff4b9d86 RPCRT4!DispatchToStubInCNoAvrf+0×14

00000000`035ef390 000007fe`ff4bc44b RPCRT4!RPC_INTERFACE::DispatchToStubWorker+0×146

00000000`035ef4b0 000007fe`ff4bc38b RPCRT4!RPC_INTERFACE::DispatchToStub+0×9b

00000000`035ef4f0 000007fe`ff4bc322 RPCRT4!RPC_INTERFACE::DispatchToStubWithObject+0×5b

00000000`035ef570 000007fe`ff4ba11d RPCRT4!LRPC_SCALL::DispatchRequest+0×422

00000000`035ef650 000007fe`ff4c7ddf RPCRT4!LRPC_SCALL::HandleRequest+0×20d

00000000`035ef780 000007fe`ff4c7995 RPCRT4!LRPC_ADDRESS::ProcessIO+0×3bf

00000000`035ef8c0 00000000`77c8b43b RPCRT4!LrpcIoComplete+0xa5

00000000`035ef950 00000000`77c8923f ntdll!TppAlpcpExecuteCallback+0×26b

00000000`035ef9e0 00000000`77a6f56d ntdll!TppWorkerThread+0×3f8

00000000`035efce0 00000000`77ca3281 kernel32!BaseThreadInitThunk+0xd

00000000`035efd10 00000000`00000000 ntdll!RtlUserThreadStart+0×1d
We inspect the raw stack starting from the first top Child-SP value for RPCRT4 subtrace and find NNN:NNN data there resembling PID:TID pair:
1: kd> dpp 00000000`035ef360 l100

[...]

00000000`035ef698  00000000`00000000

00000000`035ef6a0  00000000`00000001

00000000`035ef6a8  00000000`00000000

00000000`035ef6b0  00000000`00000000

00000000`035ef6b8  00000000`00000118

00000000`035ef6c0  00000000`0000048c

00000000`035ef6c8  00000000`00495e50 000007fe`ff57d920 RPCRT4!LRPC_ADDRESS::`vftable’

00000000`035ef6d0  00000000`00000000

[…]
We find such CID in the stack trace collection and see a wait for an ALPC message reply:
THREAD fffffa8003d49b60  Cid 0118.048c  Teb: 000007fffffaa000 Win32Thread: fffff900c01e4c30 WAIT: (WrLpcReply) UserMode Non-Alertable

    fffffa8003d49f20  Semaphore Limit 0×1

Waiting for reply to ALPC Message fffff8a000bdb6c0 : queued at port fffffa80042f8090 : owned by process fffffa8004803b30

Not impersonating

DeviceMap                 fffff8a000008600

Owning Process            fffffa8003cf15d0       Image:         ServiceB.exe

Attached Process          N/A            Image:         N/A

Wait Start TickCount      1441554        Ticks: 106626 (0:00:27:43.376)

Context Switch Count      23180                 LargeStack

UserTime                  00:00:00.468

KernelTime                00:00:03.057

Win32 Start Address ntdll!TppWorkerThread (0×0000000077c88f00)

Stack Init fffff88004ffcdb0 Current fffff88004ffc620

Base fffff88004ffd000 Limit fffff88004ff7000 Call 0

Priority 6 BasePriority 6 UnusualBoost 0 ForegroundBoost 0 IoPriority 2 PagePriority 5

Kernel stack not resident.

Child-SP          RetAddr           Call Site

fffff880`04ffc660 fffff800`01678992 nt!KiSwapContext+0×7a

fffff880`04ffc7a0 fffff800`0167acff nt!KiCommitThreadWait+0×1d2

fffff880`04ffc830 fffff800`0168fd1f nt!KeWaitForSingleObject+0×19f

fffff880`04ffc8d0 fffff800`01977ac6 nt!AlpcpSignalAndWait+0×8f

fffff880`04ffc980 fffff800`01975a50 nt!AlpcpReceiveSynchronousReply+0×46

fffff880`04ffc9e0 fffff800`01972fcb nt!AlpcpProcessSynchronousRequest+0×33d

fffff880`04ffcb00 fffff800`01670993 nt!NtAlpcSendWaitReceivePort+0×1ab

fffff880`04ffcbb0 00000000`77cc070a nt!KiSystemServiceCopyEnd+0×13 (TrapFrame @ fffff880`04ffcc20)

00000000`018ce308 000007fe`ff4caa76 ntdll!ZwAlpcSendWaitReceivePort+0xa

00000000`018ce310 000007fe`ff4bf802 RPCRT4!LRPC_CCALL::SendReceive+0×156

00000000`018ce3d0 000007fe`ffee0900 RPCRT4!I_RpcSendReceive+0×42

00000000`018ce400 000007fe`ffee05ef ole32!ThreadSendReceive+0×40

00000000`018ce450 000007fe`ffee041b ole32!CRpcChannelBuffer::SwitchAptAndDispatchCall+0xa3

00000000`018ce4f0 000007fe`ffd819c6 ole32!CRpcChannelBuffer::SendReceive2+0×11b

00000000`018ce6b0 000007fe`ffd81928 ole32!CAptRpcChnl::SendReceive+0×52

00000000`018ce780 000007fe`ffedfcf5 ole32!CCtxComChnl::SendReceive+0×68

00000000`018ce830 000007fe`ff56ba3b ole32!NdrExtpProxySendReceive+0×45

00000000`018ce860 000007fe`ffee02d0 RPCRT4!NdrpClientCall3+0×2e2

00000000`018ceb20 000007fe`ffd818a2 ole32!ObjectStublessClient+0×11d

00000000`018ceeb0 00000000`ff5afe64 ole32!ObjectStubless+0×42

[…]

00000000`018cf7a0 00000000`77c8f8eb ServiceB!Worker+0×366

00000000`018cf800 00000000`77c89d9f ntdll!RtlpTpWorkCallback+0×16b

00000000`018cf8e0 00000000`77a6f56d ntdll!TppWorkerThread+0×5ff

00000000`018cfbe0 00000000`77ca3281 kernel32!BaseThreadInitThunk+0xd

00000000`018cfc10 00000000`00000000 ntdll!RtlUserThreadStart+0×1d
Inspection of that message shows that it was directed to our server thread that triggered the breakpoint:
1: kd> !alpc /m fffff8a000bdb6c0
Message @ fffff8a000bdb6c0

  MessageID             : 0x0600 (1536)

  CallbackID            : 0x2D910D (2986253)

  SequenceNumber        : 0x0002CB50 (183120)

  Type                  : LPC_REQUEST

  DataLength            : 0x0068 (104)

  TotalLength           : 0x0090 (144)

  Canceled              : No

  Release               : No

  ReplyWaitReply        : No

  Continuation          : Yes

  OwnerPort             : fffffa8004823a80 [ALPC_CLIENT_COMMUNICATION_PORT]

  WaitingThread         : fffffa8003d49b60

  QueueType             : ALPC_MSGQUEUE_PENDING

  QueuePort             : fffffa80042f8090 [ALPC_CONNECTION_PORT]

  QueuePortOwnerProcess : fffffa8004803b30 (ServiceA.exe)

  ServerThread          : fffffa8005e6b060

  QuotaCharged          : No

  CancelQueuePort       : 0000000000000000

  CancelSequencePort    : 0000000000000000

  CancelSequenceNumber  : 0×00000000 (0)

  ClientContext         : 000000000020f0c0

  ServerContext         : 0000000000000000

  PortContext           : 0000000000416990

  CancelPortContext     : 0000000000000000

  SecurityData          : 0000000000000000

  View                  : 0000000000000000
- Dmitry Vostokov @ DumpAnalysis.org + TraceAnalysis.org -
Posted in Complete Memory Dump Analysis, Crash Dump Analysis, Crash Dump Patterns, Debugging, x64 Windows | 1 Comment »
Friday, December 31st, 2010
This is an artwork commissioned for the New Year of DeBugging 0×7DB. How many bugs can you count there? Click on the picture to expand instead of using a magnifying glass (as seen on debugging books covers):
- Dmitry Vostokov @ DumpAnalysis.org + TraceAnalysis.org -
Posted in Art, Crash Dump Analysis, Debugging, Fun with Crash Dumps, Fun with Debugging, Memory Visualization, Physicalist Art, x64 Windows | No Comments »
Thursday, December 30th, 2010
The New Year of DeBugging 0×7DB opens the DeBugging Decade. Just a few tips for the beginning:
1: kd>*

1: kd>* Virtual memory search

1: kd>*
1: kd> s-d 0 L?3FFFFFFF 7DB

00000000`777509dc 0000007db 0004c550 0005dd80 0000b610
1: kd>*

1: kd>* Physical memory search for the first 65535 pages

1: kd>*
1: kd> !search 7DB 0 0 FFFF

Searching PFNs in range 0000000000000001 - 000000000000FFFF for [00000000000007DB - 00000000000007DB]
Pfn              Offset   Hit              Va               Pte

- - - - - - - - - - - - - - - - - - - - - - - - - - - - - - - - - - - - - - - - - - - - - - - - -

000000000000041D 00000D10 000000000000075B FFFFF8A000437D10 FFFFF6FC500021B8

 fffff8a00040b000+0x2cd10 : NtFB (LargePool) -- BitmpSup.c

000000000000045F 00000090 000000000000079B FFFFF8A000439090 FFFFF6FC500021C8

 fffff8a00040b000+0x2e090 : NtFB (LargePool) -- BitmpSup.c

000000000000045F 00000B40 00000000000007CB FFFFF8A000439B40 FFFFF6FC500021C8

 fffff8a00040b000+0x2eb40 : NtFB (LargePool) -- BitmpSup.c

000000000000045F 00000D80 00000000000007D3 FFFFF8A000439D80 FFFFF6FC500021C8

 fffff8a00040b000+0x2ed80 : NtFB (LargePool) -- BitmpSup.c

0000000000000460 000000B0 00000000000007D9 FFFFF8A00043A0B0 FFFFF6FC500021D0

 fffff8a00040b000+0x2f0b0 : NtFB (LargePool) -- BitmpSup.c

0000000000000460 000000C8 00000000000007DA FFFFF8A00043A0C8 FFFFF6FC500021D0

 fffff8a00040b000+0x2f0c8 : NtFB (LargePool) -- BitmpSup.c

0000000000000460 000000E0 00000000000007DB FFFFF8A00043A0E0 FFFFF6FC500021D0

 fffff8a00040b000+0x2f0e0 : NtFB (LargePool) -- BitmpSup.c

0000000000000460 00000218 00000000000007DF FFFFF8A00043A218 FFFFF6FC500021D0

 fffff8a00040b000+0x2f218 : NtFB (LargePool) -- BitmpSup.c

0000000000000460 00000950 00000000000007FB FFFFF8A00043A950 FFFFF6FC500021D0

 fffff8a00040b000+0x2f950 : NtFB (LargePool) -- BitmpSup.c

0000000000000494 00000ED8 00000000000006DB FFFFF8A00042EED8 FFFFF6FC50002170

 fffff8a00040b000+0x23ed8 : NtFB (LargePool) -- BitmpSup.c

00000000000004D0 00000708 00000000000005DB FFFFF8A00042A708 FFFFF6FC50002150

 fffff8a00040b000+0x1f708 : NtFB (LargePool) -- BitmpSup.c

0000000000000562 000002A0 0000000000000FDB FFFFF8A00043C2A0 FFFFF6FC500021E0

 fffff8a00040b000+0x312a0 : NtFB (LargePool) -- BitmpSup.c

00000000000005C8 00000020 00000000000003DB FFFFF8A000422020 FFFFF6FC50002110

 fffff8a00040b000+0x17020 : NtFB (LargePool) -- BitmpSup.c

0000000000000A80 00000F58 00000000000017DB FFFFF8A00041AF58 FFFFF6FC500020D0

 fffff8a00040b000+0xff58 : NtFB (LargePool) -- BitmpSup.c

0000000000003411 000008E0 00000000000005DB FFFFFA80000118E0 FFFFF6FD40000088

0000000000003411 00000948 00000000000005DB FFFFFA8000011948 FFFFF6FD40000088

0000000000003413 00000D18 000000000000079B FFFFFA8000013D18 FFFFF6FD40000098

0000000000003415 00000510 000000000000079B FFFFFA8000015510 FFFFF6FD400000A8

0000000000003415 00000518 000000000000075B FFFFFA8000015518 FFFFF6FD400000A8

0000000000003416 00000CB8 00000000000007D9 FFFFFA8000016CB8 FFFFF6FD400000B0

0000000000003431 00000110 00000000000017DB FFFFFA8000031110 FFFFF6FD40000188

0000000000003431 00000D10 0000000000000FDB FFFFFA8000031D10 FFFFF6FD40000188

0000000000003449 00000118 00000000000017DB FFFFFA8000049118 FFFFF6FD40000248

0000000000003466 00000218 00000000000007CB FFFFFA8000066218 FFFFF6FD40000330

0000000000003466 000004B0 00000000000007D9 FFFFFA80000664B0 FFFFF6FD40000330

0000000000003466 00000510 000000000000075B FFFFFA8000066510 FFFFF6FD40000330

0000000000003467 00000110 00000000000007DB FFFFFA8000067110 FFFFF6FD40000338

000000000000346B 00000918 00000000000007DB FFFFFA800006B918 FFFFF6FD40000358

0000000000003473 00000260 00000000000005DB FFFFFA8000073260 FFFFF6FD40000398

000000000000349A 00000A10 00000000000007CB FFFFFA800009AA10 FFFFF6FD400004D0

000000000000349B 00000348 00000000000007FB FFFFFA800009B348 FFFFF6FD400004D8

000000000000352C 00000510 00000000000006DB FFFFFA800012C510 FFFFF6FD40000960

000000000000352C 00000AE0 00000000000007FB FFFFFA800012CAE0 FFFFF6FD40000960

0000000000003563 000001D0 00000000000007DF FFFFFA80001631D0 FFFFF6FD40000B18

000000000000356A 00000938 00000000000007DA FFFFFA800016A938 FFFFF6FD40000B50

0000000000003596 00000D10 00000000000087DB FFFFFA8000196D10 FFFFF6FD40000CB0

0000000000003599 00000D18 00000000000087DB FFFFFA8000199D18 FFFFF6FD40000CC8

00000000000035A8 00000738 00000000000007DA FFFFFA80001A8738 FFFFF6FD40000D40

000000000000369B 00000B30 00000000000027DB FFFFFA800029BB30 FFFFF6FD400014D8

00000000000036FE 00000B90 00000000000007D3 FFFFFA80002FEB90 FFFFF6FD400017F0

0000000000003710 00000D10 00000000000107DB FFFFFA8000310D10 FFFFF6FD40001880

0000000000003747 00000918 00000000000107DB FFFFFA8000347918 FFFFF6FD40001A38

00000000000037B9 000009D8 00000000000007DF FFFFFA80003B99D8 FFFFF6FD40001DC8

000000000000380D 00000640 00000000000003DB FFFFFA800040D640 FFFFF6FD40002068

00000000000038D7 00000870 0000000000000FDB FFFFFA80004D7870 FFFFF6FD400026B8

000000000000391B 00000490 0000000000000FDB FFFFFA800051B490 FFFFF6FD400028D8

0000000000003923 000003E0 000000000000075B FFFFFA80005233E0 FFFFF6FD40002918

000000000000392A 000001F0 00000000000007DB FFFFFA800052A1F0 FFFFF6FD40002950

000000000000393C 00000A30 00000000000007FB FFFFFA800053CA30 FFFFF6FD400029E0

0000000000003951 00000BE0 00000000000007D3 FFFFFA8000551BE0 FFFFF6FD40002A88

0000000000003964 00000F00 00000000000007FB FFFFFA8000564F00 FFFFF6FD40002B20

0000000000003980 000004D0 00000000000007CB FFFFFA80005804D0 FFFFF6FD40002C00

000000000000399D 00000900 00000000000007DA FFFFFA800059D900 FFFFF6FD40002CE8

0000000000003A11 00000910 00000000000207DB FFFFFA8000611910 FFFFF6FD40003088

0000000000003A16 00000118 00000000000207DB FFFFFA8000616118 FFFFF6FD400030B0

0000000000003B3E 00000570 00000000000006DB FFFFFA800073E570 FFFFF6FD400039F0

0000000000003D23 000003D0 00000000000006DB FFFFFA80009233D0 FFFFF6FD40004918

0000000000003D32 00000AF0 00000000000007FB FFFFFA8000932AF0 FFFFF6FD40004990

0000000000003D5C 00000580 00000000000007DB FFFFFA800095C580 FFFFF6FD40004AE0

0000000000003D7B 00000150 00000000000007DA FFFFFA800097B150 FFFFF6FD40004BD8

0000000000003D81 00000D20 00000000000007D9 FFFFFA8000981D20 FFFFF6FD40004C08

0000000000003DB9 000009A0 00000000000007DB FFFFFA80009B99A0 FFFFF6FD40004DC8

0000000000003DE7 00000AB0 00000000000007D3 FFFFFA80009E7AB0 FFFFF6FD40004F38

0000000000003DE8 000001D0 00000000000007D9 FFFFFA80009E81D0 FFFFF6FD40004F40

0000000000003F29 00000410 00000000000006DB FFFFFA8000B29410 FFFFF6FD40005948

0000000000003FA5 00000918 00000000000407DB FFFFFA8000BA5918 FFFFF6FD40005D28

000000000000401C 00000110 00000000000407DB FFFFFA8000C1C110 FFFFF6FD400060E0

000000000000443D 00000580 00000000000007FB FFFFFA800103D580 FFFFF6FD400081E8

0000000000004502 000006B0 000000000000079B FFFFFA80011026B0 FFFFF6FD40008810

000000000000456B 00000BF0 00000000000007DF FFFFFA800116BBF0 FFFFF6FD40008B58

0000000000004577 00000B90 000000000000075B FFFFFA8001177B90 FFFFF6FD40008BB8

00000000000046B7 00000330 00000000000007CB FFFFFA80012B7330 FFFFF6FD400095B8

0000000000004819 00000F90 00000000000007DB FFFFFA8001419F90 FFFFF6FD4000A0C8

0000000000004A62 00000930 00000000000003DB FFFFFA8001662930 FFFFF6FD4000B310

0000000000004AA2 00000C20 00000000000006DB FFFFFA80016A2C20 FFFFF6FD4000B510

0000000000004AB6 00000870 00000000000007FB FFFFFA80016B6870 FFFFF6FD4000B5B0

0000000000004ABB 000007C0 000000000000079B FFFFFA80016BB7C0 FFFFF6FD4000B5D8

0000000000004AD5 000003E0 00000000000007DA FFFFFA80016D53E0 FFFFF6FD4000B6A8

0000000000004BAA 00000560 00000000000007D3 FFFFFA80017AA560 FFFFF6FD4000BD50

0000000000004BE5 00000570 00000000000007CB FFFFFA80017E5570 FFFFF6FD4000BF28

0000000000004C18 00000510 00000000000807DB FFFFFA8001818510 FFFFF6FD4000C0C0

0000000000004C19 00000118 00000000000807DB FFFFFA8001819118 FFFFF6FD4000C0C8

0000000000004C1F 00000530 00000000000107DB FFFFFA800181F530 FFFFF6FD4000C0F8

0000000000004CAB 00000750 000000000000079B FFFFFA80018AB750 FFFFF6FD4000C558

0000000000004CB3 00000AF0 00000000000007D3 FFFFFA80018B3AF0 FFFFF6FD4000C598

0000000000005061 000002E0 000000000000075B FFFFFA8001C612E0 FFFFF6FD4000E308

0000000000005291 00000F80 00000000000006DB FFFFFA8001E91F80 FFFFF6FD4000F488

00000000000052B7 00000E70 00000000000027DB FFFFFA8001EB7E70 FFFFF6FD4000F5B8

0000000000005314 00000630 00000000000007DB FFFFFA8001F14630 FFFFF6FD4000F8A0

000000000000531D 00000630 000000000000079B FFFFFA8001F1D630 FFFFF6FD4000F8E8

0000000000005336 00000230 00000000000005DB FFFFFA8001F36230 FFFFF6FD4000F9B0

000000000000533E 00000660 00000000000006DB FFFFFA8001F3E660 FFFFF6FD4000F9F0

0000000000005343 00000550 0000000000000FDB FFFFFA8001F43550 FFFFF6FD4000FA18

0000000000005384 00000E60 00000000000007DA FFFFFA8001F84E60 FFFFF6FD4000FC20

00000000000053F1 00000820 00000000000007DA FFFFFA8001FF1820 FFFFF6FD4000FF88

00000000000053F1 00000BB0 00000000000003DB FFFFFA8001FF1BB0 FFFFF6FD4000FF88

00000000000053FF 00000C80 00000000000007D9 FFFFFA8001FFFC80 FFFFF6FD4000FFF8

0000000000005428 00000C00 00000000000007DA FFFFFA8002028C00 FFFFF6FD40010140

000000000000542D 00000DC0 00000000000007FB FFFFFA800202DDC0 FFFFF6FD40010168

0000000000005456 00000800 0000000000000FDB FFFFFA8002056800 FFFFF6FD400102B0

0000000000005459 00000CB0 00000000000006DB FFFFFA8002059CB0 FFFFF6FD400102C8

000000000000546B 00000B30 00000000000003DB FFFFFA800206BB30 FFFFF6FD40010358

000000000000547F 00000450 00000000000005DB FFFFFA800207F450 FFFFF6FD400103F8

000000000000549E 00000290 00000000000087DB FFFFFA800209E290 FFFFF6FD400104F0

000000000000551C 00000410 00000000000003DB FFFFFA800211C410 FFFFF6FD400108E0

000000000000563E 00000510 000000000000075B FFFFFA800223E510 FFFFF6FD400111F0

000000000000567C 00000FD0 00000000000007DF FFFFFA800227CFD0 FFFFF6FD400113E0

0000000000005731 000002A0 00000000000017DB FFFFFA80023312A0 FFFFF6FD40011988

000000000000575A 00000400 00000000000007FB FFFFFA800235A400 FFFFF6FD40011AD0

0000000000005847 00000400 00000000000003DB FFFFFA8003047400 FFFFF6FD40018238

000000000000588E 00000290 00000000000007D9 FFFFFA800308E290 FFFFF6FD40018470

0000000000005890 00000C60 000000000000075B FFFFFA8003090C60 FFFFF6FD40018480

0000000000005893 00000F90 00000000000005DB FFFFFA8003093F90 FFFFF6FD40018498

000000000000589B 000006D0 00000000000006DB FFFFFA800309B6D0 FFFFF6FD400184D8

00000000000058A5 000009C0 000000000000079B FFFFFA80030A59C0 FFFFF6FD40018528

00000000000058AA 000008B0 00000000000017DB FFFFFA80030AA8B0 FFFFF6FD40018550

00000000000058BC 00000400 00000000000003DB FFFFFA80030BC400 FFFFF6FD400185E0

0000000000005911 000002A0 00000000000007D3 FFFFFA80031112A0 FFFFF6FD40018888

0000000000005957 00000A40 00000000000005DB FFFFFA8003157A40 FFFFF6FD40018AB8

0000000000005995 00000E40 00000000000003DB FFFFFA8003195E40 FFFFF6FD40018CA8

000000000000599D 00000AF0 0000000000000FDB FFFFFA800319DAF0 FFFFF6FD40018CE8

00000000000059AD 000002A0 00000000000007DF FFFFFA80031AD2A0 FFFFF6FD40018D68

00000000000059B2 00000910 00000000000007DF FFFFFA80031B2910 FFFFF6FD40018D90

00000000000059D0 00000520 00000000000003DB FFFFFA80031D0520 FFFFF6FD40018E80

00000000000059E1 000003B0 00000000000007FB FFFFFA80031E13B0 FFFFF6FD40018F08

00000000000059E7 00000D10 00000000000007D3 FFFFFA80031E7D10 FFFFF6FD40018F38

00000000000059EC 00000690 00000000000007CB FFFFFA80031EC690 FFFFF6FD40018F60

00000000000059FB 000003C0 00000000000005DB FFFFFA80031FB3C0 FFFFF6FD40018FD8

00000000000059FB 00000FF0 00000000000005DB FFFFFA80031FBFF0 FFFFF6FD40018FD8

00000000000059FE 000003C0 00000000000006DB FFFFFA80031FE3C0 FFFFF6FD40018FF0

0000000000005A01 000003C0 00000000000007DA FFFFFA80032013C0 FFFFF6FD40019008

0000000000005A0A 000003F0 00000000000007D9 FFFFFA800320A3F0 FFFFF6FD40019050

0000000000005A0D 00000390 000000000000075B FFFFFA800320D390 FFFFF6FD40019068

0000000000005A0D 00000960 00000000000007FB FFFFFA800320D960 FFFFF6FD40019068

0000000000005A0D 00000F90 000000000000079B FFFFFA800320DF90 FFFFF6FD40019068

0000000000005A0E 000003B0 00000000000007FB FFFFFA800320E3B0 FFFFF6FD40019070

0000000000005A0E 00000B90 00000000000007DB FFFFFA800320EB90 FFFFF6FD40019070

0000000000005A0F 000006D0 00000000000007DF FFFFFA800320F6D0 FFFFF6FD40019078

0000000000005A11 00000080 00000000000003DB FFFFFA8003211080 FFFFF6FD40019088

0000000000005A19 000006F0 0000000000000FDB FFFFFA80032196F0 FFFFF6FD400190C8

0000000000005A31 00000930 00000000000006DB FFFFFA8003231930 FFFFF6FD40019188

0000000000005A47 00000560 00000000000017DB FFFFFA8003247560 FFFFF6FD40019238

0000000000005A7E 000002B0 00000000000017DB FFFFFA800327E2B0 FFFFF6FD400193F0

0000000000005ADC 00000480 00000000000003DB FFFFFA80032DC480 FFFFF6FD400196E0

0000000000005ADC 00000630 0000000000000FDB FFFFFA80032DC630 FFFFF6FD400196E0

0000000000005AF1 00000180 00000000000007D3 FFFFFA80032F1180 FFFFF6FD40019788

0000000000005AF5 00000B00 0000000000000FDB FFFFFA80032F5B00 FFFFF6FD400197A8

0000000000005AFA 00000630 00000000000003DB FFFFFA80032FA630 FFFFF6FD400197D0

0000000000005AFE 00000890 0000000000000FDB FFFFFA80032FE890 FFFFF6FD400197F0

0000000000005AFE 00000D10 00000000000007D9 FFFFFA80032FED10 FFFFF6FD400197F0

0000000000005B12 00000F30 00000000000007FB FFFFFA8003312F30 FFFFF6FD40019890

0000000000005B1F 00000680 00000000000007CB FFFFFA800331F680 FFFFF6FD400198F8

0000000000005B25 00000F20 00000000000003DB FFFFFA8003325F20 FFFFF6FD40019928

0000000000005B25 00000FE0 00000000000007DF FFFFFA8003325FE0 FFFFF6FD40019928

0000000000005B28 000005F0 00000000000007D3 FFFFFA80033285F0 FFFFF6FD40019940

0000000000005B33 00000DB0 000000000000075B FFFFFA8003333DB0 FFFFF6FD40019998

0000000000005B35 000005B0 00000000000006DB FFFFFA80033355B0 FFFFF6FD400199A8

0000000000005B39 00000120 000000000000075B FFFFFA8003339120 FFFFF6FD400199C8

0000000000005B3A 000006B0 00000000000007DB FFFFFA800333A6B0 FFFFF6FD400199D0

0000000000005B47 00000E50 000000000000079B FFFFFA8003347E50 FFFFF6FD40019A38

0000000000005B55 00000FE0 000000000000079B FFFFFA8003355FE0 FFFFF6FD40019AA8

0000000000005B5A 00000390 00000000000006DB FFFFFA800335A390 FFFFF6FD40019AD0

0000000000005B6B 00000310 00000000000006DB FFFFFA800336B310 FFFFF6FD40019B58

0000000000005BF4 00000200 00000000000027DB FFFFFA80033F4200 FFFFF6FD40019FA0

0000000000005CA3 00000250 00000000000007DF FFFFFA80034A3250 FFFFF6FD4001A518

0000000000005CB0 00000F90 00000000000007DA FFFFFA80034B0F90 FFFFF6FD4001A580

0000000000005CC1 00000310 00000000000003DB FFFFFA80034C1310 FFFFF6FD4001A608

0000000000005D06 00000130 00000000000005DB FFFFFA8003506130 FFFFF6FD4001A830

0000000000005D0E 00000170 00000000000003DB FFFFFA800350E170 FFFFF6FD4001A870

0000000000005D2B 00000330 00000000000007DF FFFFFA800352B330 FFFFF6FD4001A958

0000000000005D30 00000EB0 00000000000007D3 FFFFFA8003530EB0 FFFFF6FD4001A980

0000000000005D33 000003D0 00000000000007D9 FFFFFA80035333D0 FFFFF6FD4001A998

0000000000005D38 00000830 00000000000007DB FFFFFA8003538830 FFFFF6FD4001A9C0

0000000000005D3E 00000980 00000000000007CB FFFFFA800353E980 FFFFF6FD4001A9F0

0000000000005D42 00000700 000000000000075B FFFFFA8003542700 FFFFF6FD4001AA10

0000000000005D47 00000E60 00000000000007D3 FFFFFA8003547E60 FFFFF6FD4001AA38

0000000000005D4E 000002B0 00000000000007FB FFFFFA800354E2B0 FFFFF6FD4001AA70

0000000000005D4F 000008D0 00000000000007DF FFFFFA800354F8D0 FFFFF6FD4001AA78

0000000000005D55 00000030 00000000000007DB FFFFFA8003555030 FFFFF6FD4001AAA8

0000000000005D58 000002A0 00000000000007DF FFFFFA80035582A0 FFFFF6FD4001AAC0

0000000000005D67 00000060 00000000000007D3 FFFFFA8003567060 FFFFF6FD4001AB38

0000000000005D81 000006D0 000000000000075B FFFFFA80035816D0 FFFFF6FD4001AC08

0000000000005D86 00000BF0 00000000000006DB FFFFFA8003586BF0 FFFFF6FD4001AC30

0000000000005D87 00000670 00000000000005DB FFFFFA8003587670 FFFFF6FD4001AC38

0000000000005D87 00000700 00000000000007CB FFFFFA8003587700 FFFFF6FD4001AC38

0000000000005D96 00000B50 00000000000003DB FFFFFA8003596B50 FFFFF6FD4001ACB0

0000000000005DA4 00000290 00000000000005DB FFFFFA80035A4290 FFFFF6FD4001AD20

0000000000005DBF 000005C0 00000000000007D3 FFFFFA80035BF5C0 FFFFF6FD4001ADF8

0000000000005DC6 00000F10 00000000000003DB FFFFFA80035C6F10 FFFFF6FD4001AE30

0000000000005DCF 00000B20 00000000000007D3 FFFFFA80035CFB20 FFFFF6FD4001AE78

0000000000005DD6 00000CF0 00000000000007DB FFFFFA80035D6CF0 FFFFF6FD4001AEB0

0000000000005DDC 00000FF0 00000000000007DF FFFFFA80035DCFF0 FFFFF6FD4001AEE0

0000000000005DEF 00000B90 000000000000075B FFFFFA80035EFB90 FFFFF6FD4001AF78

0000000000005DF1 00000CC0 000000000000079B FFFFFA80035F1CC0 FFFFF6FD4001AF88

0000000000005E03 00000F30 00000000000005DB FFFFFA8003603F30 FFFFF6FD4001B018

0000000000005E12 00000F60 00000000000005DB FFFFFA8003612F60 FFFFF6FD4001B090

0000000000005E13 00000890 00000000000003DB FFFFFA8003613890 FFFFF6FD4001B098

0000000000005E18 00000E10 000000000000075B FFFFFA8003618E10 FFFFF6FD4001B0C0

0000000000005E1A 00000100 00000000000007CB FFFFFA800361A100 FFFFF6FD4001B0D0

0000000000005E38 00000310 000000000000075B FFFFFA8003638310 FFFFF6FD4001B1C0

0000000000005E41 00000820 00000000000007DB FFFFFA8003641820 FFFFF6FD4001B208

0000000000005E54 00000C90 00000000000005DB FFFFFA8003654C90 FFFFF6FD4001B2A0

0000000000005E63 000005D0 00000000000007CB FFFFFA80036635D0 FFFFF6FD4001B318

0000000000005E67 00000680 00000000000005DB FFFFFA8003667680 FFFFF6FD4001B338

0000000000005E73 000009E0 000000000000075B FFFFFA80036739E0 FFFFF6FD4001B398

0000000000005E7E 000007E0 00000000000007CB FFFFFA800367E7E0 FFFFF6FD4001B3F0

0000000000005E82 00000C20 00000000000007DF FFFFFA8003682C20 FFFFF6FD4001B410

0000000000005E84 00000360 00000000000007D9 FFFFFA8003684360 FFFFF6FD4001B420

0000000000005E84 00000FC0 00000000000007DB FFFFFA8003684FC0 FFFFF6FD4001B420

0000000000005E85 000002C0 00000000000006DB FFFFFA80036852C0 FFFFF6FD4001B428

0000000000005E8C 00000C70 00000000000007FB FFFFFA800368CC70 FFFFF6FD4001B460

0000000000005E8C 00000F40 00000000000007D3 FFFFFA800368CF40 FFFFF6FD4001B460

0000000000005E90 00000F90 00000000000007DA FFFFFA8003690F90 FFFFF6FD4001B480

0000000000005E91 00000530 00000000000003DB FFFFFA8003691530 FFFFF6FD4001B488

0000000000005E9B 00000190 000000000000079B FFFFFA800369B190 FFFFF6FD4001B4D8

0000000000005E9B 000003A0 000000000000075B FFFFFA800369B3A0 FFFFF6FD4001B4D8

0000000000005E9E 00000460 00000000000007DA FFFFFA800369E460 FFFFF6FD4001B4F0

0000000000005EA7 00000E50 00000000000003DB FFFFFA80036A7E50 FFFFF6FD4001B538

0000000000005EAF 00000080 00000000000005DB FFFFFA80036AF080 FFFFF6FD4001B578

0000000000005EB9 00000250 00000000000007DA FFFFFA80036B9250 FFFFF6FD4001B5C8

0000000000005EBB 000005C0 00000000000003DB FFFFFA80036BB5C0 FFFFF6FD4001B5D8

0000000000005EC4 00000770 00000000000003DB FFFFFA80036C4770 FFFFF6FD4001B620

0000000000005EC5 00000DC0 00000000000007D3 FFFFFA80036C5DC0 FFFFF6FD4001B628

0000000000005ECA 00000E60 00000000000003DB FFFFFA80036CAE60 FFFFF6FD4001B650

0000000000005ECC 000003C0 000000000000075B FFFFFA80036CC3C0 FFFFF6FD4001B660

0000000000005ECD 00000C20 00000000000007DA FFFFFA80036CDC20 FFFFF6FD4001B668

0000000000005EE9 000004F0 00000000000003DB FFFFFA80036E94F0 FFFFF6FD4001B748

0000000000005EF2 000007C0 00000000000006DB FFFFFA80036F27C0 FFFFF6FD4001B790

0000000000005F05 00000E10 00000000000007CB FFFFFA8003705E10 FFFFF6FD4001B828

0000000000005F07 00000A60 00000000000007D9 FFFFFA8003707A60 FFFFF6FD4001B838

0000000000005F08 00000150 00000000000007FB FFFFFA8003708150 FFFFF6FD4001B840

0000000000005F09 00000710 00000000000005DB FFFFFA8003709710 FFFFF6FD4001B848

0000000000005F17 00000600 00000000000005DB FFFFFA8003717600 FFFFF6FD4001B8B8

0000000000005F1D 00000990 00000000000007DF FFFFFA800371D990 FFFFF6FD4001B8E8

0000000000005F2C 00000E40 00000000000007DA FFFFFA800372CE40 FFFFF6FD4001B960

0000000000005F2D 000001D0 00000000000007DF FFFFFA800372D1D0 FFFFF6FD4001B968

0000000000005F2F 00000EA0 00000000000007D9 FFFFFA800372FEA0 FFFFF6FD4001B978

0000000000005F3F 000008F0 00000000000003DB FFFFFA800373F8F0 FFFFF6FD4001B9F8

0000000000005F57 00000860 00000000000006DB FFFFFA8003757860 FFFFF6FD4001BAB8

0000000000005F59 000001B0 00000000000007CB FFFFFA80037591B0 FFFFF6FD4001BAC8

0000000000005F59 00000A50 00000000000005DB FFFFFA8003759A50 FFFFF6FD4001BAC8

0000000000005F60 00000620 00000000000003DB FFFFFA8003760620 FFFFF6FD4001BB00

0000000000005F63 00000AD0 000000000000075B FFFFFA8003763AD0 FFFFF6FD4001BB18

0000000000005F70 00000790 00000000000007DF FFFFFA8003770790 FFFFF6FD4001BB80

0000000000005F77 000001E0 00000000000007CB FFFFFA80037771E0 FFFFF6FD4001BBB8

0000000000005F80 00000B70 000000000000079B FFFFFA8003780B70 FFFFF6FD4001BC00

0000000000005F97 00000070 00000000000007D3 FFFFFA8003797070 FFFFF6FD4001BCB8

0000000000005FDF 00000550 00000000000007CB FFFFFA80037DF550 FFFFF6FD4001BEF8

0000000000005FF4 000000D0 00000000000007D9 FFFFFA80037F40D0 FFFFF6FD4001BFA0

0000000000006008 00000410 00000000000017DB FFFFFA8003808410 FFFFF6FD4001C040

0000000000006035 00000BF0 00000000000027DB FFFFFA8003835BF0 FFFFF6FD4001C1A8

0000000000006099 00000C10 00000000000047DB FFFFFA8003899C10 FFFFF6FD4001C4C8

00000000000060B8 00000518 0000000000000FDB FFFFFA80038B8518 FFFFF6FD4001C5C0

000000000000613B 00000918 00000000000006DB FFFFFA800393B918 FFFFF6FD4001C9D8

0000000000006153 00000798 00000000000007D3 FFFFFA8003953798 FFFFF6FD4001CA98

000000000000617B 00000F30 0000000000000FDB FFFFFA800397BF30 FFFFF6FD4001CBD8

0000000000006192 00000580 00000000000007DA FFFFFA8003992580 FFFFF6FD4001CC90

0000000000006193 00000180 000000000000079B FFFFFA8003993180 FFFFF6FD4001CC98

0000000000006193 00000D50 00000000000007D9 FFFFFA8003993D50 FFFFF6FD4001CC98

0000000000006194 000009B0 00000000000007DB FFFFFA80039949B0 FFFFF6FD4001CCA0

0000000000006195 00000550 000000000000075B FFFFFA8003995550 FFFFF6FD4001CCA8

0000000000006195 00000670 00000000000007DF FFFFFA8003995670 FFFFF6FD4001CCA8

0000000000006196 00000D50 00000000000006DB FFFFFA8003996D50 FFFFF6FD4001CCB0

0000000000006197 000003B0 00000000000007FB FFFFFA80039973B0 FFFFF6FD4001CCB8

000000000000619A 00000830 00000000000007D3 FFFFFA800399A830 FFFFF6FD4001CCD0

000000000000619B 000002B0 00000000000007CB FFFFFA800399B2B0 FFFFF6FD4001CCD8

00000000000061A9 000003E0 00000000000005DB FFFFFA80039A93E0 FFFFF6FD4001CD48

00000000000061A9 00000D70 00000000000003DB FFFFFA80039A9D70 FFFFF6FD4001CD48

00000000000061B7 00000090 000000000000079B FFFFFA80039B7090 FFFFF6FD4001CDB8

00000000000061BF 00000610 00000000000003DB FFFFFA80039BF610 FFFFF6FD4001CDF8

0000000000007D32 00000EC8 00000000000003DB 000000007790BEC8 FFFFF680003BC858

0000000000009513 00000EC8 00000000000003DB 000000007790BEC8 FFFFF680003BC858

000000000000C631 00000EC8 00000000000003DB 000000007790BEC8 FFFFF680003BC858

000000000000EA70 00000E08 00000000000003DB 0000000000000000 FFFFF8A0099382D8

000000000000EBA3 00000AB0 000000000000075B 0000000000000000 FFFFF8A009938E70

000000000000ED2A 00000E20 00000000000007D9 0000000000000000 FFFFF8A009938EA8

000000000000F4B6 00000BB8 00000000000007D9 0000000000000000 FFFFF8A009938F08

000000000000FCB6 000000C0 00000000020007DB 0000000000000000 FFFFF8A009938D08

000000000000FCE6 00000CF0 00000000000005DB 0000000000000000 FFFFF8A009938E88

000000000000FDE6 00000D90 00000000000007D9 000000000CB3CD90 FFFFF680000659E0

Search done.
- Dmitry Vostokov @ DumpAnalysis.org + TraceAnalysis.org -
Posted in Announcements, Debugging, Fun with Debugging, WinDbg Tips and Tricks, x64 Windows | No Comments »
Thursday, November 25th, 2010
Posted in Announcements, Complete Memory Dump Analysis, Crash Analysis Report Environment (CARE), Crash Dump Analysis, Crash Dump De-analysis, Crash Dump Patterns, Debugging, Debugging Industry, Escalation Engineering, Kernel Development, Memory Analysis Forensics and Intelligence, Memory Dump Analysis Services, Minidump Analysis, Software Behavior Patterns, Software Engineering, Software Technical Support, Software Trace Analysis, Software Troubleshooting Patterns, Tools, Trace Analysis Patterns, Vista, Windows 7, Windows Server 2008, Windows System Administration, Workaround Patterns, x64 Windows | No Comments »