Microsoft gives sneak preview of Debugging Studio
Tuesday, April 1st, 2008This looks really cool:
http://www.microsoft.com/whdc/devstudio/default.mspx
- Dmitry Vostokov @ DumpAnalysis.org -
This looks really cool:
http://www.microsoft.com/whdc/devstudio/default.mspx
- Dmitry Vostokov @ DumpAnalysis.org -
Although the first volume has not been published yet (scheduled for 15th of April, 2008) the planning for the second volume has already begun. Preliminary information is:
Hardcover version is also planned. PDF version will be available for download too.
(*) subject to change
- Dmitry Vostokov @ DumpAnalysis.org -
Why do we need yet another book about device drivers? There are couple of reasons here:
Old books are more about developing the narrow range of legacy drivers than troubleshooting and debugging them.
New books shift towards WDF and ignore legacy drivers.
Windows Internals book is too big and something lightweight is desperately needed.
No published driver books use UML as communication device and discuss driver developement as software factory.
Existing books mostly view device drivers as hardware device drivers.
I started collecting and organizing information about Windows drivers 2 years ago and published a few selected materials so you can get an approximate flavour of what is expected in the forthcoming book scheduled for the next year:
- Dmitry Vostokov @ DumpAnalysis.org -
This is a forthcoming reference book for technical support and escalation engineers troubleshooting and debugging complex software issues. The book is also invaluable for software maintenance and development engineers debugging unmanaged, managed and native code.
- Dmitry Vostokov @ DumpAnalysis.org -
Finally release dates are set for the following two books:
DebugWare: The Art and Craft of Writing Troubleshooting and Debugging Tools
The latter book will be shorter than planned initially and will contain references to Memory Dump Analysis Anthology, Volume I and Volume II.
(*) subject to change
- Dmitry Vostokov @ DumpAnalysis.org -
It is very easy to become a publisher nowadays. Much easier than I thought. I registered myself as a publisher under the name of OpenTask which is my registered business name in Ireland. I also got the list of ISBN numbers and therefore can announce product details for the first volume of Memory Dump Analysis Anthology series:
Memory Dump Analysis Anthology, Volume 1
(*) subject to change
PDF file will be available for download too.
- Dmitry Vostokov @ DumpAnalysis.org -
The absence of crash dumps when we expect them can be considered as a pattern on its own and I call it No Process Dumps. This can happen due to variety of reasons and troubleshooting should be based on the distinction between crashes and hangs. We have 3 combinations here:
A process is visible in Task Manager and is functioning normally
A process is visible in Task Manager and has stopped functioning normally
A process is not visible in Task Manager
If a process is visible in task list and is functioning normally then the following reasons should be considered:
- Exceptions haven’t happened yet due to different code execution paths or the time has not come yet and we need to wait more
- Exceptions haven’t happened yet due to a different memory layout. This can be the instance of Changed Environment pattern.
If a process is visible in Task Manager and has stopped functioning normally then it might be hanging and waiting for some input. In such cases it is better to get process dumps proactively.
If a process is not visible in Task Manager then the following reasons should be considered:
- Debugger value for AeDebug key is invalid, missing or points to a wrong path or a command line has wrong arguments. For examples see Custom Postmortem Debuggers on Vista or NTSD on x64 Windows 2003.
- Something is wrong with exception handling mechanism or WER settings. Use Process Monitor to see what processes are launched and modules are loaded when an exception happens. Check WER settings in Control panel.
- Try LocalDumps registry key for Vista SP1 and Windows Server 2008 (this one I haven’t tried yet)
- Use live debugging techniques like attaching to a process or running a process under a debugger to monitor exceptions and saving first chance exception crash dumps.
This is very important pattern for technical support environments that rely on post-mortem analysis and I’m going to revisit it later to add more information and recommendations if necessary.
- Dmitry Vostokov @ DumpAnalysis.org -
Finally I can pre-order this 1232 page 5th edition! Looking forward to seeing it in the post.
Windows® Internals: Including Windows Server 2008 and Windows Vista, Fifth Edition (PRO-Developer)

I read all previous editions as the part of my knowledge read ahead cache. Here is my short review of the previous 4th edition.
- Dmitry Vostokov @ DumpAnalysis.org -
It appears that Microsoft decided to help customers to save full user dumps locally for later postmortem analysis. According to MSDN this is done via LocalDumps registry key starting from Vista SP1 and Windows Server 2008:
http://msdn2.microsoft.com/en-us/library/bb787181.aspx
This is a quote from the article above:
[…] Prior to application termination, the system will check the registry settings to determine whether a local dump is to be collected. The registry settings control whether a full dump is collected versus a minidump. The custom flags specified also determine which information is collected in the dump. […] You can make use of the local dump collection even if WER is disabled. The local dumps are collected even if the user cancels WER reporting at any point. […]
From my understanding it is independent from the default postmortem debugger mechanism via AeDebug registry key and might help to solve the problem with native services. I haven’t tried it yet but will do as soon as I install Vista SP1 or install Windows Server 2008 RC0. If it works then dump collection might be easier in production environments because of no need to install Debugging Tools for Windows to set up a postmortem debugger.
- Dmitry Vostokov @ DumpAnalysis.org -
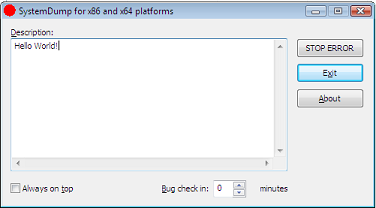
32-bit Vista
If you need to dump a running 32-bit Vista system you can do it with Citrix SystemDump tool. You just need to run it with elevated administrator rights:
right click SystemDump.exe in appropriate Computer explorer folder and choose “Run as administrator”
if you use command line options run SystemDump.exe from elevated command prompt (Start -> All Programs -> Accessories, right click Command Prompt, and then select “Run as administrator”)
Here is a screenshot before dumping my Vista and WinDbg output from saved kernel dump:
Loading Dump File [C:\Windows\MEMORY.DMP]

Kernel Summary Dump File: Only kernel address space is available

Windows Vista Kernel Version 6000 UP Free x86 compatible

Product: WinNt, suite: TerminalServer SingleUserTS

Built by: 6000.16386.x86fre.vista_rtm.061101-2205

Kernel base = 0x81800000 PsLoadedModuleList = 0x81908ab0

Debug session time: Sat Jan 27 20:13:10.917 2007 (GMT+0)

System Uptime: 0 days 1:33:13.589

Loading Kernel Symbols

Loading User Symbols

Loading unloaded module list

BugCheck E2, {cccccccc, 83286f08, 1a, 0}

Probably caused by : SystemDump.sys
64-bit Vista
Currently in order to use 64-bit SystemDump you have to disable “Driver Signature Enforcement” by:
Then you need to run SystemDump64.exe as administrator.
- Dmitry Vostokov -