Archive for the ‘Vista’ Category

I/O and Memory Priority in Vista

Sunday, January 27th, 2008

You might have noticed additional IoPriority and PagePriority values when using !thread command in kernel and complete memory dumps coming from Vista:

THREAD 8362a390  Cid 0b90.0b94  Teb: 7ffdf000 Win32Thread: ff34c848 WAIT: (WrUserRequest) UserMode Non-Alertable
    83656de0  SynchronizationEvent
Not impersonating
DeviceMap                 a7766db8
Owning Process            8362a638       Image:         explorer.exe
Wait Start TickCount      43496          Ticks: 3 (0:00:00:00.046)
Context Switch Count      14502            
UserTime                  00:00:00.436
KernelTime                00:00:00.608
Win32 Start Address Explorer!wWinMainCRTStartup (0x0052d070)
Stack Init 9e8b3000 Current 9e8b2c10 Base 9e8b3000 Limit 9e8b0000 Call 0
Priority 12 BasePriority 8 PriorityDecrement 2 IoPriority 2 PagePriority 5
ChildEBP RetAddr 
9e8b2c28 81cac9cf nt!KiSwapContext+0×26
9e8b2c64 81c293a7 nt!KiSwapThread+0×389
9e8b2cc0 8cedb8ed nt!KeWaitForSingleObject+0×414
9e8b2d1c 8cedb724 win32k!xxxRealSleepThread+0×1ad
9e8b2d38 8ced573c win32k!xxxSleepThread+0×2d
9e8b2d4c 8ced5759 win32k!xxxRealWaitMessageEx+0×12
9e8b2d5c 81c8caaa win32k!NtUserWaitMessage+0×14
9e8b2d5c 77490f34 nt!KiFastCallEntry+0×12a
000ffb94 761db5bc ntdll!KiFastSystemCallRet
000ffb98 765e07f6 USER32!NtUserWaitMessage+0xc
000ffbb0 76566f4e SHELL32!CDesktopBrowser::_MessageLoop+0×4c
000ffbbc 00529039 SHELL32!SHDesktopMessageLoop+0×24
000ffea8 0052d1e0 Explorer!wWinMain+0×447
000fff3c 75f33833 Explorer!_initterm_e+0×1b1
000fff48 7746a9bd kernel32!BaseThreadInitThunk+0xe
000fff88 00000000 ntdll!_RtlUserThreadStart+0×23

These are new thread priorities added to Vista kernel and explained in the following articles:

Inside the Windows Vista Kernel: Part 1 (I/O Priority section)
Inside the Windows Vista Kernel: Part 2 (Memory Priorities section)

You can change it for any process according to blogs.technet.com/vitalipro/archive/2007/02/16/645675.aspx

I changed values for notepad.exe and it works: 

[HKEY_LOCAL_MACHINE\SOFTWARE\Microsoft\Windows NT\CurrentVersion\Image File Execution Options\notepad.exe\PerfOptions]
"IoPriority"=dword:00000001
"PagePriority"=dword:00000001

THREAD 838edd78  Cid 0378.0d3c  Teb: 7ffdf000 Win32Thread: fed7e848 WAIT: (WrUserRequest) UserMode Non-Alertable
    838c84a0  SynchronizationEvent
Not impersonating
DeviceMap                 a7766db8
Owning Process            838e25a0       Image:         notepad.exe
Wait Start TickCount      12967          Ticks: 30532 (0:00:07:56.302)
Context Switch Count      490            
UserTime                  00:00:00.000
KernelTime                00:00:00.109
Win32 Start Address notepad!WinMainCRTStartup (0x003631f8)
Stack Init a691b000 Current a691ab68 Base a691b000 Limit a6918000 Call 0
Priority 12 BasePriority 8 PriorityDecrement 2 IoPriority 1 PagePriority 1
Kernel stack not resident.
ChildEBP RetAddr 
a691ab80 81cac9cf nt!KiSwapContext+0×26
a691abbc 81c293a7 nt!KiSwapThread+0×389
a691ac18 8cedb8ed nt!KeWaitForSingleObject+0×414
a691ac74 8cedb724 win32k!xxxRealSleepThread+0×1ad
a691ac90 8ced9976 win32k!xxxSleepThread+0×2d
a691ace8 8cedd983 win32k!xxxRealInternalGetMessage+0×4a4
a691ad4c 81c8caaa win32k!NtUserGetMessage+0×3f
a691ad4c 77490f34 nt!KiFastCallEntry+0×12a
0006f6d0 761e199a ntdll!KiFastSystemCallRet
0006f6d4 761e19cd USER32!NtUserGetMessage+0xc
0006f6f0 0036149c USER32!GetMessageW+0×33
0006f730 00361971 notepad!WinMain+0xec
0006f7c0 75f33833 notepad!_initterm_e+0×1a1
0006f7cc 7746a9bd kernel32!BaseThreadInitThunk+0xe
0006f80c 00000000 ntdll!_RtlUserThreadStart+0×23

- Dmitry Vostokov @ DumpAnalysis.org -

New edition of Windows® Internals

Sunday, January 20th, 2008

Finally I can pre-order this 1232 page 5th edition! Looking forward to seeing it in the post.

Windows® Internals: Including Windows Server 2008 and Windows Vista, Fifth Edition (PRO-Developer)

Buy from Amazon

I read all previous editions as the part of my knowledge read ahead cache. Here is my short review of the previous 4th edition.

- Dmitry Vostokov @ DumpAnalysis.org -

How to distinguish between 1st and 2nd chances

Wednesday, January 2nd, 2008

Sometimes we look for Early Crash Dump pattern but information about whether an exception was first-chance or second-chance is missing from a crash dump file name or in a crash dump itself, for example:

This dump file has an exception of interest stored in it.
The stored exception information can be accessed via .ecxr.
(1254.1124): Access violation - code c0000005 (first/second chance not available)
TestDefaultDebugger64!CTestDefaultDebuggerDlg::OnBnClickedButton1:
00000000`00401570 c704250000000000000000 mov dword ptr [0],0 ds:00000000`00000000=????????

If we recall that first-chance exceptions don’t leave any traces on user space thread stacks (see Interrupts and Exceptions Explained, Part 6 for details) then we won’t see any exception codes on thread raw stack:

0:000> !teb
TEB at 000007fffffde000
    ExceptionList:        0000000000000000
    StackBase:            0000000000130000
    StackLimit:           000000000012b000

    SubSystemTib:         0000000000000000
    FiberData:            0000000000001e00
    ArbitraryUserPointer: 0000000000000000
    Self:                 000007fffffde000
    EnvironmentPointer:   0000000000000000
    ClientId:             0000000000001254 . 0000000000001124
    RpcHandle:            0000000000000000
    Tls Storage:          000007fffffde058
    PEB Address:          000007fffffd5000
    LastErrorValue:       0
    LastStatusValue:      c0000034
    Count Owned Locks:    0
    HardErrorMode:        0

0:000> s -d 000000000012b000 0000000000130000 c0000005

However, we would definitely see it on raw stack in second-chance exception crash dump: 

0:000> s -d 000000000012b000 0000000000130000 c0000005 
00000000`0012f000  c0000005 00000000 00000000 00000000  .

Using raw stack observations we can even tell when a crash dump was saved from a debugger handling a second-chance exception or saved by some postmortem debugger afterwards. For example, on my Vista x64 I see the following difference:

raw stack from a crash dump saved from WinDbg after receiving second-chance exception:

00000000`0012e278  00000000`00000000
00000000`0012e280  00000000`00000000
00000000`0012e288  00000000`7790032c kernel32!IsDebugPortPresent+0×2c
00000000`0012e290  00000000`00000000
00000000`0012e298  00000000`00000000
00000000`0012e2a0  00000000`00000000
00000000`0012e2a8  00000000`7790032c kernel32!IsDebugPortPresent+0×2c
00000000`0012e2b0  00000001`00010000
00000000`0012e2b8  00000000`00000000
00000000`0012e2c0  00000000`00000000
00000000`0012e2c8  00000000`77b63c94 ntdll! ?? ::FNODOBFM::`string’+0xbd14
00000000`0012e2d0  00000000`00000000
00000000`0012e2d8  00000000`0012e420
00000000`0012e2e0  00000000`77b63cb0 ntdll! ?? ::FNODOBFM::`string’+0xbd30
00000000`0012e2e8  00000000`7793cf47 kernel32!UnhandledExceptionFilter+0xb7
00000000`0012e2f0  ffffffff`ffffffff
00000000`0012e2f8  00000000`00000000
00000000`0012e300  00000000`00000000
00000000`0012e308  00000000`00000000
00000000`0012e310  00000000`00318718
00000000`0012e318  00000000`7799eb89 user32!ImeWndProcWorker+0×331
00000000`0012e320  00000000`00000000
00000000`0012e328  00000000`00000000
00000000`0012e330  00000000`00000000
00000000`0012e338  00000000`004189b0 TestDefaultDebugger64!_getptd_noexit+0×80
00000000`0012e340  00000000`01fb4b90
00000000`0012e348  00000000`0012e928
00000000`0012e350  00000000`00000000
00000000`0012e358  00000000`00418a50 TestDefaultDebugger64!_getptd+0×80
00000000`0012e360  00000000`01fb4b90
00000000`0012e368  00000000`0041776d TestDefaultDebugger64!_XcptFilter+0×1d
00000000`0012e370  00000000`0012e4f0
00000000`0012e378  00000000`77aa3cfa ntdll!RtlDecodePointer+0×2a
00000000`0012e380  00000000`00436fc4 TestDefaultDebugger64!__rtc_tzz+0×1f8c
00000000`0012e388  00000000`00000001
00000000`0012e390  00000000`0012f000
00000000`0012e398  00000000`77a60000 ntdll!`string’ <PERF> (ntdll+0×0)
00000000`0012e3a0  00000000`0004c6e1
00000000`0012e3a8  00000000`00000001
00000000`0012e3b0  00000000`0012ff90
00000000`0012e3b8  00000000`77afb1b5 ntdll!RtlUserThreadStart+0×95
00000000`0012e3c0  00000000`0012e420
00000000`0012e3c8  00000000`d4b99e6f
00000000`0012e3d0  00000000`00000000
00000000`0012e3d8  00000000`00000001
00000000`0012e3e0  00000000`0012e4f0
00000000`0012e3e8  00000000`77a8ae4b ntdll!_C_specific_handler+0×8c

raw stack from a crash dump saved by CDB installed as a default postmortem debugger (WER was used to launch it):

0:000> dqs 00000000`0012e278 00000000`0012e3e8
00000000`0012e278  00000000`00000000
00000000`0012e280  00000000`00000000
00000000`0012e288  00000000`00000000
00000000`0012e290  ffffffff`ffffffff
00000000`0012e298  00000000`779257ef kernel32!WerpReportExceptionInProcessContext+0×9f
00000000`0012e2a0  00000000`00000000
00000000`0012e2a8  00000000`0012ff90
00000000`0012e2b0  00000000`0012e420
00000000`0012e2b8  00000000`0041f4dc TestDefaultDebugger64!__CxxUnhandledExceptionFilter+0×5c
00000000`0012e2c0  00000000`00000000
00000000`0012e2c8  00000000`7a8b477b
00000000`0012e2d0  00000000`00000000
00000000`0012e2d8  fffff980`01000000
00000000`0012e2e0  00000000`00000001
00000000`0012e2e8  00000000`7793d07e kernel32!UnhandledExceptionFilter+0×1ee
00000000`0012e2f0  00000000`77b63cb0 ntdll! ?? ::FNODOBFM::`string’+0xbd30
00000000`0012e2f8  000007fe`00000000
00000000`0012e300  00000000`00000000
00000000`0012e308  00000000`00000001
00000000`0012e310  00000000`00000000
00000000`0012e318  00000000`00000000
00000000`0012e320  000007ff`00000000
00000000`0012e328  00000000`00000000
00000000`0012e330  00000000`00000000
00000000`0012e338  00000000`004189b0 TestDefaultDebugger64!_getptd_noexit+0×80
00000000`0012e340  00000000`023f4b90
00000000`0012e348  00000000`77ab8cf8 ntdll!RtlpFindNextActivationContextSection+0xaa
00000000`0012e350  00000000`00000000
00000000`0012e358  00000000`00418a50 TestDefaultDebugger64!_getptd+0×80
00000000`0012e360  00000000`023f4b90
00000000`0012e368  00000000`0041776d TestDefaultDebugger64!_XcptFilter+0×1d
00000000`0012e370  00000000`0012e4f0
00000000`0012e378  00000000`77aa3cfa ntdll!RtlDecodePointer+0×2a
00000000`0012e380  00000000`00436fc4 TestDefaultDebugger64!__rtc_tzz+0×1f8c
00000000`0012e388  00000000`00000001
00000000`0012e390  00000000`0012f000
00000000`0012e398  00000000`77a60000 ntdll!`string’ <PERF> (ntdll+0×0)
00000000`0012e3a0  00000000`0004c6e1
00000000`0012e3a8  00000000`00000001
00000000`0012e3b0  00000000`0012ff90
00000000`0012e3b8  00000000`77afb1b5 ntdll!RtlUserThreadStart+0×95
00000000`0012e3c0  00000000`0012e420
00000000`0012e3c8  00000000`7a8b477b
00000000`0012e3d0  00000000`00000000
00000000`0012e3d8  00000000`00000001
00000000`0012e3e0  00000000`0012e4f0
00000000`0012e3e8  00000000`77a8ae4b ntdll!_C_specific_handler+0×8c

- Dmitry Vostokov @ DumpAnalysis.org -

Windows Internals book

Monday, November 19th, 2007

Scheduled to be updated with Windows Vista and Windows Server 2008 details:

Windows® Internals, Fifth Edition

- Dmitry Vostokov @ DumpAnalysis.org

Crash Dump Analysis Patterns (Part 34)

Tuesday, November 6th, 2007

Although crash dumps are static in nature they contain Historical Information about past system dynamics that might give clues to a problem and help with troubleshooting and debugging.

For example, IRP flow between user processes and drivers is readily available in any kernel or complete memory dump. WinDbg !irpfind command will show the list of currently present I/O request packets. !irp command will give individual packet details. 

Recent Driver Verifier improvements in Vista and Windows Server 2008 allow to embed stack traces associated with IRP allocation, completion and cancellation. For information please look at the following document:

http://www.microsoft.com/whdc/devtools/tools/vistaverifier.mspx

Other information that can be included in process, kernel and complete memory dumps may reveal some history of function calls beyond the current snapshot of thread stacks:

- Dmitry Vostokov @ DumpAnalysis.org -

Local crash dumps on Vista

Thursday, October 18th, 2007

It appears that Microsoft decided to help customers to save full user dumps locally for later postmortem analysis. According to MSDN this is done via LocalDumps registry key starting from Vista SP1 and Windows Server 2008:

http://msdn2.microsoft.com/en-us/library/bb787181.aspx

This is a quote from the article above:

[…] Prior to application termination, the system will check the registry settings to determine whether a local dump is to be collected. The registry settings control whether a full dump is collected versus a minidump. The custom flags specified also determine which information is collected in the dump. […] You can make use of the local dump collection even if WER is disabled. The local dumps are collected even if the user cancels WER reporting at any point. […]

From my understanding it is independent from the default postmortem debugger mechanism via AeDebug registry key and might help to solve the problem with native services. I haven’t tried it yet but will do as soon as I install Vista SP1 or install Windows Server 2008 RC0. If it works then dump collection might be easier in production environments because of no need to install Debugging Tools for Windows to set up a postmortem debugger.

- Dmitry Vostokov @ DumpAnalysis.org -

Windows service crash dumps in Vista

Monday, October 1st, 2007

I was playing with Vista Platform SDK samples to create the minimal native Windows service that crashes to test various postmortem debugger configurations, Windows Error Reporting (WER) options and conditions under which crash dumps are available. Initially I put a NULL pointer dereference into the service control handler processing service stop command and although the service crashed under WinDbg I couldn’t get CDB or NTSD configured as a default postmortem debugger to save the crash dump automatically. I tested under x64 Vista and Windows Server 2003 x64 both 32-bit and 64-bit versions of my service.

Here is the source code and stack trace from WinDbg when we attach it to the running service and then try to stop it:

//
// FUNCTION: service_ctrl
//
// PURPOSE: This function is called by the SCM whenever
// ControlService() is called on this service.
//
// PARAMETERS:
// dwCtrlCode - type of control requested
//
// RETURN VALUE:
// none
//
// COMMENTS:
//
VOID WINAPI service_ctrl(DWORD dwCtrlCode)
{
  // Handle the requested control code.
  //
  switch (dwCtrlCode)
  {
  case SERVICE_CONTROL_STOP:
    *(int *)NULL = 0;
    ReportStatusToSCMgr(SERVICE_STOP_PENDING, NO_ERROR, 0);
    ServiceStop();
    return;

  // Update the service status.
  //
  case SERVICE_CONTROL_INTERROGATE:
    break;

  // invalid control code
  //
  default:
    break;

}

ReportStatusToSCMgr(ssStatus.dwCurrentState, NO_ERROR, 0);
}

0:000> r
rax=0000000000000001 rbx=00000000001e36d0 rcx=0000000000000001
rdx=000000000a9ff32c rsi=0000000000000000 rdi=0000000000401aa0
rip=0000000000401ab9 rsp=000000000012fab0 rbp=00000000001e36d0
 r8=0000000000400000  r9=0000000077b3f990 r10=00000000004000d8
r11=00000000004000d8 r12=0000000000000000 r13=000000000a9ff32c
r14=00000000001e36e8 r15=000000000012fc20
iopl=0 nv up ei pl zr na po nc
cs=0033  ss=002b  ds=002b  es=002b  fs=0053  gs=002b  efl=00010246
simple!service_ctrl+0x19:
00000000`00401ab9 c704250000000000000000 mov dword ptr [0],0 ds:00000000`00000000=????????

0:000> k
Child-SP          RetAddr           Call Site
00000000`0012fab0 000007fe`fe276cee simple!service_ctrl+0x19
00000000`0012faf0 000007fe`fe2cea5d ADVAPI32!ScDispatcherLoop+0x54c
00000000`0012fbf0 00000000`004019f5 ADVAPI32!StartServiceCtrlDispatcherA+0x8d
00000000`0012fe70 00000000`00408b8c simple!main+0x155
00000000`0012fec0 00000000`0040895e simple!__tmainCRTStartup+0x21c
00000000`0012ff30 00000000`7792cdcd simple!mainCRTStartup+0xe
00000000`0012ff60 00000000`77a7c6e1 kernel32!BaseThreadInitThunk+0xd
00000000`0012ff90 00000000`00000000 ntdll!RtlUserThreadStart+0x1d

If we put while(1); code instead of NULL pointer dereference the process will be interrupted via breakpoint and then terminated. There is no postmortem dump saved too. Therefore it looks like any fault inside the service main thread is not allowed to execute the potentially blocking operation of unhandled exception filter perhaps to avoid blocking the service control manager (SCM) communicating with service dispatcher code.

On Vista if Windows Error Reporting service is running and WER is configured in Control Panel to allow a user to choose reporting settings we get the following familiar dialog but without Debug option to attach a postmortem debugger and save a crash dump:

If we choose the recommended option we get the following dialog showing the path where a minidump file was temporarily stored:


We need to leave this dialog open if we want to open the crash dump or copy it to another location otherwise report files will be removed as soon as we dismiss the dialog box (they may be stored temporarily in another location - check Problem Reports and Solutions\View Problem History in Control Panel). If we open the crash dump using WinDbg we get the same stack trace that we got previously during live debugging:

Loading Dump File [C:\ProgramData\Microsoft\Windows\WER\ReportQueue\Report19527353 \WER7346.tmp.mdmp]
User Mini Dump File: Only registers, stack and portions of memory are available

Symbol search path is: srv*c:\mss*http://msdl.microsoft.com/download/symbols
Executable search path is:
Windows Vista Version 6000 MP (2 procs) Free x64
Product: WinNt, suite: SingleUserTS
Debug session time: Fri Sep 28 16:36:38.000 2007 (GMT+1)
System Uptime: 2 days 1:42:22.810
Process Uptime: 0 days 0:00:10.000
.....
This dump file has an exception of interest stored in it.
The stored exception information can be accessed via .ecxr.
(13b0.d54): Access violation - code c0000005 (first/second chance not available)
*** WARNING: Unable to verify checksum for simple.exe
simple!service_ctrl+0x19:
00000000`00401ab9 c704250000000000000000 mov dword ptr [0],0 ds:00000000`00000000=????????
0:000> k
Child-SP          RetAddr           Call Site
00000000`0012fab0 000007fe`fe276cee simple!service_ctrl+0x19
00000000`0012faf0 000007fe`fe2cea5d advapi32!ScDispatcherLoop+0x54c
00000000`0012fbf0 00000000`004019f5 advapi32!StartServiceCtrlDispatcherA+0x8d
00000000`0012fe70 00000000`00408b8c simple!main+0x155
00000000`0012fec0 00000000`0040895e simple!__tmainCRTStartup+0x21c
00000000`0012ff30 00000000`7792cdcd simple!mainCRTStartup+0xe
00000000`0012ff60 00000000`77a7c6e1 kernel32!BaseThreadInitThunk+0xd
00000000`0012ff90 00000000`00000000 ntdll!RtlUserThreadStart+0x1d

Fault in any other service thread, for example, the one that SCM starts per every SERVICE_TABLE_ENTRY in dispatch table results in a default postmortem debugger saving a crash dump on Windows Server 2003 x64 but not on Vista x64 or Vista x86 (32-bit):

void __cdecl main(int argc, char **argv)
{
  SERVICE_TABLE_ENTRY dispatchTable[] =
  {
  { TEXT(SZSERVICENAME), (LPSERVICE_MAIN_FUNCTION)service_main},
  { NULL, NULL}
  };
  ...
  ...
  ...
  if (!StartServiceCtrlDispatcher(dispatchTable))
    AddToMessageLog(TEXT("StartServiceCtrlDispatcher failed."));
}

void WINAPI service_main(DWORD dwArgc, LPTSTR *lpszArgv)
{
  // register our service control handler:
  //
  sshStatusHandle = RegisterServiceCtrlHandler( TEXT(SZSERVICENAME), service_ctrl);

  if (!sshStatusHandle)
    goto cleanup;

  // SERVICE_STATUS members that don't change in example
  //
  ssStatus.dwServiceType = SERVICE_WIN32_OWN_PROCESS;
  ssStatus.dwServiceSpecificExitCode = 0;

  // report the status to the service control manager.
  //
  if (!ReportStatusToSCMgr(
      SERVICE_START_PENDING, // service state
      NO_ERROR, // exit code
      3000)) // wait hint
    goto cleanup;
  *(int *)NULL = 0;
  …
  …
  …
}

Seems the only way to get a crash mindump for analysis is to copy it from the report data like I explained above:

Loading Dump File [C:\ProgramData\Microsoft\Windows\WER\ReportQueue\Report0fa05f9d \WER5F42.tmp.mdmp]
User Mini Dump File: Only registers, stack and portions of memory are available

Symbol search path is: srv*c:\mss*http://msdl.microsoft.com/download/symbols
Executable search path is:
Windows Vista Version 6000 MP (2 procs) Free x64
Product: WinNt, suite: SingleUserTS
Debug session time: Fri Sep 28 17:50:06.000 2007 (GMT+1)
System Uptime: 0 days 0:30:59.495
Process Uptime: 0 days 0:00:04.000
.....
This dump file has an exception of interest stored in it.
The stored exception information can be accessed via .ecxr.
(d6c.fcc): Access violation - code c0000005 (first/second chance not available)
*** WARNING: Unable to verify checksum for simple.exe
simple!service_main+0x60:
00000000`00401aa0 c704250000000000000000 mov dword ptr [0],0 ds:00000000`00000000=????????
0:001> ~*k

   0  Id: d6c.cf4 Suspend: 0 Teb: 000007ff`fffdd000 Unfrozen
Child-SP          RetAddr           Call Site
00000000`0012f978 00000000`777026da ntdll!NtReadFile+0xa
00000000`0012f980 000007fe`feb265aa kernel32!ReadFile+0x8a
00000000`0012fa10 000007fe`feb262e3 advapi32!ScGetPipeInput+0x4a
00000000`0012faf0 000007fe`feb7ea5d advapi32!ScDispatcherLoop+0x9a
00000000`0012fbf0 00000000`004019f5 advapi32!StartServiceCtrlDispatcherA+0x8d
00000000`0012fe70 00000000`00408bac simple!main+0x155
00000000`0012fec0 00000000`0040897e simple!__tmainCRTStartup+0x21c
00000000`0012ff30 00000000`7770cdcd simple!mainCRTStartup+0xe
00000000`0012ff60 00000000`7792c6e1 kernel32!BaseThreadInitThunk+0xd
00000000`0012ff90 00000000`00000000 ntdll!RtlUserThreadStart+0x1d

#  1  Id: d6c.fcc Suspend: 0 Teb: 000007ff`fffdb000 Unfrozen
Child-SP          RetAddr           Call Site
00000000`008eff00 000007fe`feb24bf5 simple!service_main+0x60
00000000`008eff30 00000000`7770cdcd advapi32!ScSvcctrlThreadW+0x25
00000000`008eff60 00000000`7792c6e1 kernel32!BaseThreadInitThunk+0xd
00000000`008eff90 00000000`00000000 ntdll!RtlUserThreadStart+0x1d

Spawning a custom thread with NULL pointer access violation doesn’t result in a crash dump on my Vista x86 and x64 too. Therefore it appears that there are no automatic postmortem crash dumps saved for native Window services in Vista unless there is some setting that I missed. This might create some problems for traditional 3rd party Technical Support procedures especially if Windows Server 2008 (Longhorn) will have the same behavior.   

- Dmitry Vostokov @ DumpAnalysis.org -

Jeffrey Richter updates his classic book

Thursday, August 30th, 2007

Jeffrey Richter updates his book “Programming Applications for Microsoft Windows” to include information about Windows XP and Vista. The new book title is ”Windows via C/C++”. Looking forward to reading this classic book again. 

Buy from Amazon

- Dmitry Vostokov @ DumpAnalysis.org -

Visualizing Memory Dumps

Saturday, August 4th, 2007

As the first step towards Memory Dump Tomography I created a small program that interprets a memory dump as a picture. You can visualize crash dumps with it. The tool is available for free download:

Download Dump2Picture

Simply run it from the command prompt and specify full paths to a dump file and an output BMP file. The memory dump file will be converted by default into true color, 32 bits-per-pixel bitmap. You can specify other values: 8, 16 and 24.

C:\Dump2Picture>Dump2Picture.exe

Dump2Picture version 1.0
Written by Dmitry Vostokov, 2007

Usage: Dump2Picture dumpfile bmpfile [8|16|24|32]

For example:

C:\Dump2Picture>Dump2Picture.exe MEMORY.DMP MEMORY.BMP 8

Dump2Picture version 1.0
Written by Dmitry Vostokov, 2007

MEMORY.BMP
MEMORY.DMP
        1 file(s) copied.

Below are some screenshots of bitmap files created by the tool. Think about them as visualized kernel or user address spaces. 

Vista kernel memory dump (8 bits-per-pixel):

Vista kernel memory dump (16 bits-per-pixel):

Vista kernel memory dump (24 bits-per-pixel):

Vista kernel memory dump (32 bits-per-pixel):

Notepad process user memory dump (8 bits-per-pixel):

Notepad process user memory dump (16 bits-per-pixel):

Notepad process user memory dump (24 bits-per-pixel):

Notepad process user memory dump (32 bits-per-pixel):

Mspaint process user memory dump (32 bits-per-pixel):

Mspaint process user memory dump after loading “Toco Toucan.jpg” from Vista Sample Pictures folder (32 bits-per-pixel):

Citrix ICA client process (wfica32.exe) user memory dump (32 bits-per-pixel):

Enjoy :-)

- Dmitry Vostokov @ DumpAnalysis.org -

When a process dies silently

Thursday, June 28th, 2007

There are cases when default postmortem debugger doesn’t save a dump file. This is because the default postmortem debugger is called from the crashed application thread on Windows prior to Vista and if a thread stack is exhausted or critical thread data is corrupt there is no user dump.  On Vista the default postmorten debugger is called from WER (Windows Error Reporting) process WerFault.exe so there is a chance that it can save a user dump. During my experiments today on Windows 2003 (x64) I found that if we have a stack overflow inside a 64-bit process then the process silently dies. This doesn’t happen for 32-bit processes on the same server on a native 32-bit OS. Here is the added code from the modified default Win32 API project created in Visual Studio 2005:

...
volatile DWORD dwSupressOptimization;
...
void SoFunction();
...
LRESULT CALLBACK WndProc(HWND hWnd, UINT message, WPARAM wParam, LPARAM lParam)
{
...
  case WM_PAINT:
     hdc = BeginPaint(hWnd, &ps);
     SoFunction();
     EndPaint(hWnd, &ps);
     break;
...
}
...
void SoFunction()
{
  if (++dwSupressOptimization)
  {
     SoFunction();
     WndProc(0,0,0,0);
  }
}

Adding WndProc call to SoFunction is done to eliminate an optimization in Release build when a recursion call is transformed into a loop:

void SoFunction()
{
  if (++dwSupressOptimization)
  {
     SoFunction();
  }
}

0:001> uf SoFunction
00401300 mov     eax,1
00401305 jmp     StackOverflow!SoFunction+0x10 (00401310)
00401310 add     dword ptr [StackOverflow!dwSupressOptimization (00403374)],eax
00401316 mov     ecx,dword ptr [StackOverflow!dwSupressOptimization (00403374)]
0040131c jne     StackOverflow!SoFunction+0x10 (00401310)
0040131e ret

Therefore without WndProc added or more complicated SoFunction there is no stack overflow but a loop with 4294967295 (0xFFFFFFFF) iterations.

If we compile an x64 project with WndProc call included in SoFunction and run it we would never get a dump from any default postmortem debugger although TestDefaultDebugger64 tool crashes with a dump. I also observed a strange behavior that the application disappears only during the second window repaint although it shall crash immediately when we launch it and the main window is shown. What I have seen is when I launch the application it is running and the main window is visible. When I force it to repaint by minimizing and then maximizing, for example, only then it disappears from the screen and the process list.

If we launch 64-bit WinDbg, load and run our application we would hit the first chance exception:

0:000> g
(159c.fc4): Stack overflow - code c00000fd (first chance)
First chance exceptions are reported before any exception handling.
This exception may be expected and handled.
StackOverflow!SoFunction+0x22:
00000001`40001322 e8d9ffffff call StackOverflow!SoFunction (00000001`40001300)

Stack trace looks like normal stack overflow:

0:000> k
Child-SP          RetAddr           Call Site
00000000`00033fe0 00000001`40001327 StackOverflow!SoFunction+0x22
00000000`00034020 00000001`40001327 StackOverflow!SoFunction+0x27
00000000`00034060 00000001`40001327 StackOverflow!SoFunction+0x27
00000000`000340a0 00000001`40001327 StackOverflow!SoFunction+0x27
00000000`000340e0 00000001`40001327 StackOverflow!SoFunction+0x27
00000000`00034120 00000001`40001327 StackOverflow!SoFunction+0x27
00000000`00034160 00000001`40001327 StackOverflow!SoFunction+0x27
00000000`000341a0 00000001`40001327 StackOverflow!SoFunction+0x27
00000000`000341e0 00000001`40001327 StackOverflow!SoFunction+0x27
00000000`00034220 00000001`40001327 StackOverflow!SoFunction+0x27
00000000`00034260 00000001`40001327 StackOverflow!SoFunction+0x27
00000000`000342a0 00000001`40001327 StackOverflow!SoFunction+0x27
00000000`000342e0 00000001`40001327 StackOverflow!SoFunction+0x27
00000000`00034320 00000001`40001327 StackOverflow!SoFunction+0x27
00000000`00034360 00000001`40001327 StackOverflow!SoFunction+0x27
00000000`000343a0 00000001`40001327 StackOverflow!SoFunction+0x27
00000000`000343e0 00000001`40001327 StackOverflow!SoFunction+0x27
00000000`00034420 00000001`40001327 StackOverflow!SoFunction+0x27
00000000`00034460 00000001`40001327 StackOverflow!SoFunction+0x27
00000000`000344a0 00000001`40001327 StackOverflow!SoFunction+0x27

RSP was inside stack guard page during the CALL instruction.

0:000> r
rax=0000000000003eed rbx=00000000000f26fe rcx=0000000077c4080a
rdx=0000000000000000 rsi=000000000000000f rdi=0000000000000000
rip=0000000140001322 rsp=0000000000033fe0 rbp=00000001400035f0
 r8=000000000012fb18 r9=00000001400035f0 r10=0000000000000000
r11=0000000000000246 r12=000000000012fdd8 r13=000000000012fd50
r14=00000000000f26fe r15=0000000000000000
iopl=0 nv up ei pl nz na po nc
cs=0033 ss=002b ds=002b es=002b fs=0053 gs=002b efl=00010206
StackOverflow!SoFunction+0×22:
00000001`40001322 e8d9ffffff call StackOverflow!SoFunction (00000001`40001300)

0:000> uf StackOverflow!SoFunction
00000001`40001300 sub     rsp,38h
00000001`40001304 mov     rax,qword ptr [StackOverflow!__security_cookie (00000001`40003000)]
00000001`4000130b xor     rax,rsp
00000001`4000130e mov     qword ptr [rsp+20h],rax
00000001`40001313 add     dword ptr [StackOverflow!dwSupressOptimization (00000001`400035e4)],1
00000001`4000131a mov     eax,dword ptr [StackOverflow!dwSupressOptimization (00000001`400035e4)]
00000001`40001320 je      StackOverflow!SoFunction+0×37 (00000001`40001337)
00000001`40001322 call    StackOverflow!SoFunction (00000001`40001300)
00000001`40001327 xor     r9d,r9d
00000001`4000132a xor     r8d,r8d
00000001`4000132d xor     edx,edx
00000001`4000132f xor     ecx,ecx
00000001`40001331 call    qword ptr [StackOverflow!_imp_DefWindowProcW (00000001`40002198)]
00000001`40001337 mov     rcx,qword ptr [rsp+20h]
00000001`4000133c xor     rcx,rsp
00000001`4000133f call    StackOverflow!__security_check_cookie (00000001`40001360)
00000001`40001344 add     rsp,38h
00000001`40001348 ret

However this guard page is not the last stack page as can be seen from TEB and the current RSP address (0×33fe0):

0:000> !teb
TEB at 000007fffffde000
    ExceptionList:        0000000000000000
    StackBase:            0000000000130000
    StackLimit:           0000000000031000
    SubSystemTib:         0000000000000000
    FiberData:            0000000000001e00
    ArbitraryUserPointer: 0000000000000000
    Self:                 000007fffffde000
    EnvironmentPointer:   0000000000000000
    ClientId:             000000000000159c . 0000000000000fc4
    RpcHandle:            0000000000000000
    Tls Storage:          0000000000000000
    PEB Address:          000007fffffd5000
    LastErrorValue:       0
    LastStatusValue:      c0000135
    Count Owned Locks:    0
    HardErrorMode:        0

If we continue execution and force the main application window to invalidate (repaint) itself we get another first chance exception instead of second chance:

0:000> g
(159c.fc4): Access violation - code c0000005 (first chance)
First chance exceptions are reported before any exception handling.
This exception may be expected and handled.
StackOverflow!SoFunction+0x22:
00000001`40001322 call StackOverflow!SoFunction (00000001`40001300)

What we see now is that RSP is outside the valid stack region (stack limit) 0×31000:

0:000> k
Child-SP          RetAddr           Call Site
00000000`00030ff0 00000001`40001327 StackOverflow!SoFunction+0×22
00000000`00031030 00000001`40001327 StackOverflow!SoFunction+0×27
00000000`00031070 00000001`40001327 StackOverflow!SoFunction+0×27
00000000`000310b0 00000001`40001327 StackOverflow!SoFunction+0×27
00000000`000310f0 00000001`40001327 StackOverflow!SoFunction+0×27
00000000`00031130 00000001`40001327 StackOverflow!SoFunction+0×27
00000000`00031170 00000001`40001327 StackOverflow!SoFunction+0×27
00000000`000311b0 00000001`40001327 StackOverflow!SoFunction+0×27
00000000`000311f0 00000001`40001327 StackOverflow!SoFunction+0×27
00000000`00031230 00000001`40001327 StackOverflow!SoFunction+0×27
00000000`00031270 00000001`40001327 StackOverflow!SoFunction+0×27
00000000`000312b0 00000001`40001327 StackOverflow!SoFunction+0×27
00000000`000312f0 00000001`40001327 StackOverflow!SoFunction+0×27
00000000`00031330 00000001`40001327 StackOverflow!SoFunction+0×27
00000000`00031370 00000001`40001327 StackOverflow!SoFunction+0×27
00000000`000313b0 00000001`40001327 StackOverflow!SoFunction+0×27
00000000`000313f0 00000001`40001327 StackOverflow!SoFunction+0×27
00000000`00031430 00000001`40001327 StackOverflow!SoFunction+0×27
00000000`00031470 00000001`40001327 StackOverflow!SoFunction+0×27
00000000`000314b0 00000001`40001327 StackOverflow!SoFunction+0×27
0:000> r
rax=0000000000007e98 rbx=00000000000f26fe rcx=0000000077c4080a
rdx=0000000000000000 rsi=000000000000000f rdi=0000000000000000
rip=0000000140001322 rsp=0000000000030ff0 rbp=00000001400035f0
 r8=000000000012faa8  r9=00000001400035f0 r10=0000000000000000
r11=0000000000000246 r12=000000000012fd68 r13=000000000012fce0
r14=00000000000f26fe r15=0000000000000000
iopl=0 nv up ei pl nz na pe nc
cs=0033 ss=002b ds=002b es=002b fs=0053 gs=002b efl=00010202
StackOverflow!SoFunction+0×22:
00000001`40001322 call    StackOverflow!SoFunction (00000001`40001300)

Therefore we expect the second chance exception at the same address here and we get it indeed when we continue execution:

0:000> g
(159c.fc4): Access violation - code c0000005 (!!! second chance !!!)
StackOverflow!SoFunction+0x22:
00000001`40001322 call    StackOverflow!SoFunction (00000001`40001300)

Now we see why the process died silently. There was no stack space left for exception dispatch handler functions and therefore for the default unhandled exception filter that launches the default postmortem debugger to save a process dump. So it looks like on x64 Windows when our process had first chance stack overflow exception there was no second chance exception afterwards and after handling first chance stack overflow exception process execution resumed and finally hit its thread stack limit. This doesn’t happen with 32-bit processes even on x64 Windows where unhandled first chance stack overflow exception results in immediate second chance stack overflow exception at the same stack address and therefore there is a sufficient room for the local variables for exception handler and filter functions.

This is an example of what happened before exception handling changes in Vista.

- Dmitry Vostokov @ DumpAnalysis.org -

ASLR: Address Space Layout Randomization

Tuesday, May 22nd, 2007

From Writing Secure Code for Windows Vista book written by Michael Howard and David LeBlanc I learnt that Vista has the new ASLR feature:

  • Load address randomization (/dynamicbase linker option)
  • Stack address randomization (/dynamicbase linker option)
  • Heap randomization

The first randomization changes addresses across Vista reboots. The second randomization happens every time you launch an application linked with /dynamicbase option. The third randomization happens every time you launch an application linked with or without /dynamicbase option as we will see below.

The book shows some source code that prints addresses of various modules, functions and local parameters to show the feature. I decided to check that using more direct route by attaching WinDbg to calc, notepad and pre-Vista application TestDefaultDebugger. Obviously native Vista applications use ASLR.

Comparison between two calc.exe processes inspected separately before and after reboot shows that the main module and system dlls have different load addresses:

0:000> lm start end module name 009f0000 00a1e000 calc 74710000 748a4000 comctl32 75b10000 75bba000 msvcrt … … … 76f00000 76fbf000 ADVAPI32 770d0000 771a8000 kernel32 771b0000 7724e000 USER32 77250000 7736e000 ntdll

0:000> lm start end module name 00470000 0049e000 calc … … … 743e0000 74574000 comctl32 … 75730000 757da000 msvcrt 757e0000 7589f000 ADVAPI32 … 75e20000 75ebe000 USER32 … 76cf0000 76dc8000 kernel32 76dd0000 76eee000 ntdll …

Main module address has different 3rd byte across reboots. I don’t believe that 0×00 is allowed because then we would have 0×00000000 load address. Therefore we have 255 unique load addresses chosen randomly.

Stack addresses are different:

0:000> k
ChildEBP RetAddr
000ffc8c 771d199a ntdll!KiFastSystemCallRet
000ffc90 771d19cd USER32!NtUserGetMessage+0xc
000ffcac 009f24e8 USER32!GetMessageW+0×33
000ffd08 00a02588 calc!WinMain+0×278
000ffd98 77113833 calc!_initterm_e+0×1a1
000ffda4 7728a9bd kernel32!BaseThreadInitThunk+0xe
000ffde4 00000000 ntdll!_RtlUserThreadStart+0×23

0:000> k
ChildEBP RetAddr
0007fbe4 75e4199a ntdll!KiFastSystemCallRet
0007fbe8 75e419cd USER32!NtUserGetMessage+0xc
0007fc04 004724e8 USER32!GetMessageW+0×33
0007fc60 00482588 calc!WinMain+0×278
0007fcf0 76d33833 calc!_initterm_e+0×1a1
0007fcfc 76e0a9bd kernel32!BaseThreadInitThunk+0xe
0007fd3c 00000000 ntdll!_RtlUserThreadStart+0×23

Because module base addresses are different return addresses on call stacks are different too.

Heap base addresses are different:

0:000> !heap
Index Address
1: 00120000
2: 00010000
3: 00760000
4: 00990000
5: 00700000
6: 00670000
7: 01320000

0:000> !heap
Index Address
1: 001b0000
2: 00010000
3: 00a00000
4: 009c0000
5: 00400000
6: 00900000
7: 01260000

PEB and environment addresses are different:

notepad.exe (PID 1248):

0:000> !peb
PEB at 7ffd4000
...
Environment: 000507e8

notepad.exe (PID 1370):

0:000> !peb
PEB at 7ffd9000
...
Environment: 003a07e8

If we look inside TEB we would see that pointers to exception handler list are different and stack bases are different too:

notepad.exe (PID 1248):

TEB at 7ffdf000 ExceptionList: 0023ff34   StackBase: 00240000   StackLimit: 0022f000   SubSystemTib: 00000000   FiberData: 00001e00   ArbitraryUserPointer: 00000000   Self: 7ffdf000   EnvironmentPointer: 00000000   ClientId: 00001248 . 000004e0   RpcHandle: 00000000   Tls Storage: 7ffdf02c   PEB Address: 7ffd4000   LastErrorValue: 0   LastStatusValue: c0000034   Count Owned Locks: 0   HardErrorMode: 0

notepad.exe (PID 1370):

0:000> !teb TEB at 7ffdf000 ExceptionList: 001ffa00   StackBase: 00200000   StackLimit: 001ef000   SubSystemTib: 00000000   FiberData: 00001e00   ArbitraryUserPointer: 00000000   Self: 7ffdf000   EnvironmentPointer: 00000000   ClientId: 00001370 . 00001454   RpcHandle: 00000000   Tls Storage: 7ffdf02c   PEB Address: 7ffd9000   LastErrorValue: 5   LastStatusValue: c0000008   Count Owned Locks: 0   HardErrorMode: 0

However if we look at old applications that weren’t linked with /dynamicbase option we would see that the main module and old dll base addresses are the same:

0:000> lm
start end module name
00400000 00435000 TestDefaultDebugger
20000000 2000d000 LvHook

To summarize different alternatives I created the following table where

“New” column - processes linked with /dynamicbase option, no reboot
“New/Reboot” column - processes linked with /dynamicbase option, reboot
“Old” column - old processes, no reboot
“Old/Reboot” column - old processes, reboot

Randomization   | New/Reboot | New | Old/Reboot | Old
------------------------------------------------------
Module          |      +     |  -  |      -     |  -
------------------------------------------------------
System DLLs     |      +     |  -  |      +     |  -
------------------------------------------------------
Stack           |      +     |  +  |      -     |  -
------------------------------------------------------
Heap            |      +     |  +  |      +     |  +
------------------------------------------------------
PEB             |      +     |  +  |      +     |  +
------------------------------------------------------
Environment     |      +     |  +  |      +     |  +
------------------------------------------------------
ExceptionList   |      +     |  +  |      -     |  -

From PEB and process heap base addresses we can see that environment addresses are always correlated with the heap:

0:000> !heap Index Address Name Debugging options enabled   1: 005f0000

0:000> !peb PEB at 7ffd7000 ... ... ...   ProcessHeap: 005f0000   ProcessParameters: 005f1540   Environment: 005f07e8

I think the reason why Microsoft didn’t enable ASLR by default is to prevent Changed Environment pattern from appearing.

- Dmitry Vostokov -

Custom postmortem debuggers on Vista

Sunday, May 20th, 2007

Motivated by the previous post I decided to try better alternatives because on new Vista installation you don’t have either drwtsn32.exe or NTSD.

Any application that can attach to a process based on its PID and save its memory state in a dump will do. The first obvious candidate is userdump.exe which actually can setup itself in the registry properly. Here is the detailed instruction. If you already have the latest version of userdump.exe you can skip the first two steps:

1. Download the latest User Mode Process Dumper from Microsoft. At the time of this writing it has version 8.1

2. Run the downloaded executable file and it will prompt to unzip. By default the current version unzips to c:\kktools\userdump8.1. Do not run setup afterwards because it is not needed for our purposes.

3. Create kktools folder in system32 folder

4. Create the folder where userdump will save your dumps; I use c:\UserDumps in my example

5. Copy dbghelp.dll and userdump.exe from x86 or x64 folder depending on the version of Windows you use to system32\kktools folder you created in step 3.

6. Run the elevated command prompt and enter the following command:

C:\Windows\System32\kktools>userdump -I -d c:\UserDumps
User Mode Process Dumper (Version 8.1.2929.5)
Copyright (c) Microsoft Corp. All rights reserved.
Userdump set up Aedebug registry key.

7. Check the following registry key:

HKEY_LOCAL_MACHINE\SOFTWARE\Microsoft\Windows NT\CurrentVersion\AeDebug
Debugger=C:\Windows\system32\kktools\userdump -E %ld %ld -D c:\UserDumps\
Auto=0

You can set Auto to 1 if you want to see the following dialog every time you have a crash:

8. Test the new settings by using TestDefaultDebugger

9. When you have a crash userdump.exe will show a window on top of your screen while saving the dump file:

Of course, you can setup userdump.exe as the postmortem debugger on other Windows platforms. The problem with userdump.exe is that it overwrites the previous process dump because it uses the module name for the dump file name, for example, TestDefaultDebugger.dmp, so you need to rename or save the dump if you have multiple crashes for the same application.

Other programs can be setup instead of userdump.exe. One of them is WinDbg. Here is the article I wrote about WinDbg so I won’t repeat its content here, except the registry key I tested on Vista:

HKEY_LOCAL_MACHINE\SOFTWARE\Microsoft\Windows NT\CurrentVersion\AeDebug
Debugger="C:\Program Files\Debugging Tools for Windows\windbg.exe" -p %ld -e %ld -g -c '.dump /o /ma /u c:\UserDumps\new.dmp; q' -Q -QS -QY -QSY

Finally you can use command line CDB user mode debugger from Debugging Tools for Windows. Here is the registry key:

HKEY_LOCAL_MACHINE\SOFTWARE\Microsoft\Windows NT\CurrentVersion\AeDebug
Debugger="C:\Program Files\Debugging Tools for Windows\cdb.exe" -p %ld -e %ld -g -c ".dump /o /ma /u c:\UserDumps\new.dmp; q"

When you have a crash cdb.exe will be launched and the following console window will appear:

The advantage of using CDB or WinDbg is that you can omit q from the -c command line option and leave your debugger window open for further process inspection.

- Dmitry Vostokov -

Resurrecting Dr. Watson on Vista

Saturday, May 19th, 2007

Feeling nostalgic about pre-Vista times I recalled that one month before upgrading my Windows XP to Vista I saved the copy of Dr. Watson (drwtsn32.exe). Of course, during upgrade, drwtsn32.exe was removed from system32 folder. Now I copied it back and set it as the default postmortem debugger from the elevated command prompt:

When I looked at the registry I found the correctly set key values:

HKEY_LOCAL_MACHINE\SOFTWARE\Microsoft\Windows NT\CurrentVersion\AeDebug
Debugger=drwtsn32 -p %ld -e %ld -g
Auto=1

Auto=1 means do not show the error message box, just go ahead and dump the process. Actually with Auto=0 Dr. Watson doesn’t work on my Vista.

Also I configured Dr. Watson to store the log and full user dump in c:\DrWatson folder by running drwtsn32.exe from the same elevated command prompt:

Next I launched TestDefaultDebugger and hit the big crash button. Access violation happened and I saw familiar “Program Error” message box:

The log was created and the user dump was saved in the specified folder. All subsequent crashes were appended to the log and user.dmp was updated. When I opened the dump in WinDbg I got the following output:

Loading Dump File [C:DrWatsonuser.dmp]
User Mini Dump File with Full Memory: Only application data is available
Comment: ‘Dr. Watson generated MiniDump’
Symbol search path is: SRV*c:\websymbols*http://msdl.microsoft.com/download/symbols
Executable search path is:
Windows Vista Version 6000 UP Free x86 compatible
Product: WinNt, suite: SingleUserTS
Debug session time: Sat May 19 20:52:23.000 2007 (GMT+1)
System Uptime: 5 days 20:00:04.062
Process Uptime: 0 days 0:00:03.000
This dump file has an exception of interest stored in it.
The stored exception information can be accessed via .ecxr.
(1f70.1e0c): Access violation - code c0000005 (first/second chance not available)
eax=00000000 ebx=00000001 ecx=0012fe70 edx=00000000 esi=00425ae8 edi=0012fe70
eip=004014f0 esp=0012f8a8 ebp=0012f8b4 iopl=0 nv up ei ng nz ac pe cy
cs=001b ss=0023 ds=0023 es=0023 fs=003b gs=0000 efl=00010297
TestDefaultDebugger!CTestDefaultDebuggerDlg::OnBnClickedButton1:
004014f0 c7050000000000000000 mov dword ptr ds:[0],0 ds:0023:00000000=???????

Therefore I believe that if I saved ntsd.exe before upgrading to Vista I would have been able to set it as a default postmortem debugger too.

- Dmitry Vostokov -

Inside Vista Error Reporting (Part 1)

Saturday, May 19th, 2007

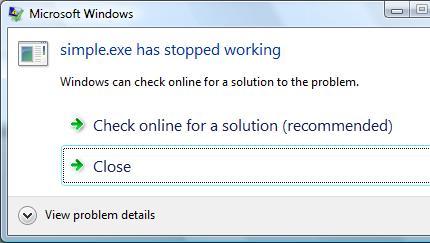
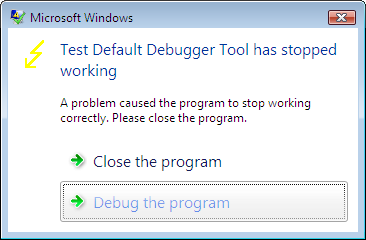
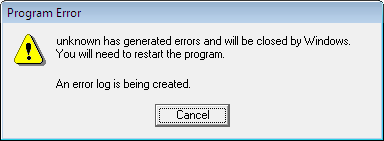
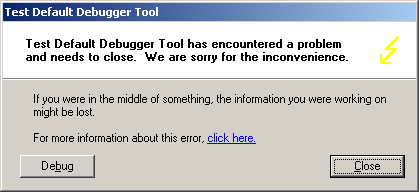
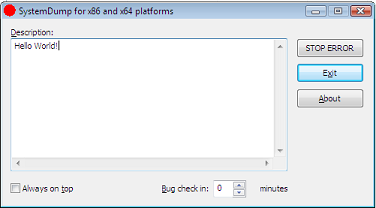
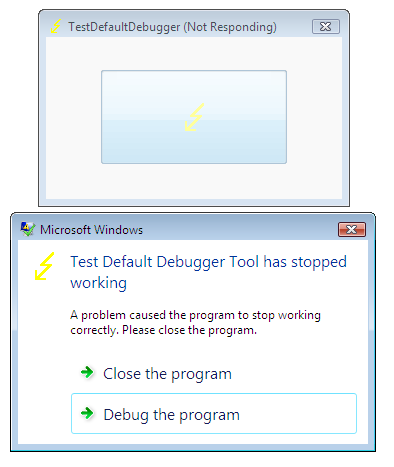
This is a follow up to the post about postmortem debuggers on Windows XP/W2K3. Now we look inside the same mechanism on Vista. After launching TestDefaultDebugger and pushing its crash button we get the following Windows error reporting dialog:

If we attach WinDbg to our TestDefaultDebugger process we would no longer see our default unhandled exception filter waiting for the error reporting process:

Windows XP

0:000> k
ChildEBP RetAddr
0012d318 7c90e9ab ntdll!KiFastSystemCallRet
0012d31c 7c8094e2 ntdll!ZwWaitForMultipleObjects+0xc
0012d3b8 7c80a075 kernel32!WaitForMultipleObjectsEx+0×12c
0012d3d4 6945763c kernel32!WaitForMultipleObjects+0×18
0012dd68 694582b1 faultrep!StartDWException+0×5df

0012eddc 7c8633e9 faultrep!ReportFault+0×533
0012f47c 00411eaa kernel32!UnhandledExceptionFilter+0×587
0012f8a4 00403263 TestDefaultDebugger!CTestDefaultDebuggerDlg::OnBnClickedButton1
0012f8b4 00403470 TestDefaultDebugger!_AfxDispatchCmdMsg+0×43


0012fff0 00000000 kernel32!BaseProcessStart+0×23

Windows Vista

0:001> ~*kL 100
0 Id: 120c.148c Suspend: 1 Teb: 7ffdf000 Unfrozen
ChildEBP RetAddr
0012f8a4 00403263 TestDefaultDebugger!CTestDefaultDebuggerDlg::OnBnClickedButton1
0012f8b4 00403470 TestDefaultDebugger!_AfxDispatchCmdMsg+0×43
0012f8e4 00402a27 TestDefaultDebugger!CCmdTarget::OnCmdMsg+0×118
0012f908 00408e69 TestDefaultDebugger!CDialog::OnCmdMsg+0×1b
0012f958 004098d9 TestDefaultDebugger!CWnd::OnCommand+0×90
0012f9f4 00406258 TestDefaultDebugger!CWnd::OnWndMsg+0×36
0012fa14 0040836d TestDefaultDebugger!CWnd::WindowProc+0×22
0012fa7c 004083f4 TestDefaultDebugger!AfxCallWndProc+0×9a
0012fa9c 77b71a10 TestDefaultDebugger!AfxWndProc+0×34
0012fac8 77b71ae8 USER32!InternalCallWinProc+0×23
0012fb40 77b7286a USER32!UserCallWinProcCheckWow+0×14b
0012fb80 77b72bba USER32!SendMessageWorker+0×4b7
0012fba0 7504e5cc USER32!SendMessageW+0×7c
0012fbc0 7504e583 COMCTL32!Button_NotifyParent+0×3d
0012fbdc 7504e680 COMCTL32!Button_ReleaseCapture+0×112
0012fc34 77b71a10 COMCTL32!Button_WndProc+0xa4b
0012fc60 77b71ae8 USER32!InternalCallWinProc+0×23
0012fcd8 77b72a47 USER32!UserCallWinProcCheckWow+0×14b
0012fd3c 77b72a98 USER32!DispatchMessageWorker+0×322
0012fd4c 77b6120c USER32!DispatchMessageW+0xf
0012fd70 0040568b USER32!IsDialogMessageW+0×586
0012fd80 004065d8 TestDefaultDebugger!CWnd::IsDialogMessageW+0×2e
0012fd88 00402a07 TestDefaultDebugger!CWnd::PreTranslateInput+0×29
0012fd98 00408041 TestDefaultDebugger!CDialog::PreTranslateMessage+0×96
0012fda8 00403ae3 TestDefaultDebugger!CWnd::WalkPreTranslateTree+0×1f
0012fdbc 00403c1e TestDefaultDebugger!AfxInternalPreTranslateMessage+0×3b
0012fdc4 00403b29 TestDefaultDebugger!CWinThread::PreTranslateMessage+0×9
0012fdcc 00403c68 TestDefaultDebugger!AfxPreTranslateMessage+0×15
0012fddc 00407920 TestDefaultDebugger!AfxInternalPumpMessage+0×2b
0012fe00 004030a1 TestDefaultDebugger!CWnd::RunModalLoop+0xca
0012fe4c 0040110d TestDefaultDebugger!CDialog::DoModal+0×12c
0012fef8 004206fb TestDefaultDebugger!CTestDefaultDebuggerApp::InitInstance+0xdd
0012ff08 0040e852 TestDefaultDebugger!AfxWinMain+0×47
0012ffa0 77603833 TestDefaultDebugger!__tmainCRTStartup+0×176
0012ffac 779ea9bd kernel32!BaseThreadInitThunk+0xe
0012ffec 00000000 ntdll!_RtlUserThreadStart+0×23
# 1 Id: 120c.17e4 Suspend: 1 Teb: 7ffde000 Unfrozen
ChildEBP RetAddr
011cff70 77a3f0a9 ntdll!DbgBreakPoint
011cffa0 77603833 ntdll!DbgUiRemoteBreakin+0×3c
011cffac 779ea9bd kernel32!BaseThreadInitThunk+0xe
011cffec 00000000 ntdll!_RtlUserThreadStart+0×23

Let’s look at the faulting thread’s raw stack data:

0:001> ~0 s
eax=00000000 ebx=00000001 ecx=0012fe70 edx=00000000 esi=00425ae8 edi=0012fe70
eip=004014f0 esp=0012f8a8 ebp=0012f8b4 iopl=0 nv up ei ng nz ac pe cy
cs=001b ss=0023 ds=0023 es=0023 fs=003b gs=0000 efl=00010297
TestDefaultDebugger!CTestDefaultDebuggerDlg::OnBnClickedButton1:
004014f0 mov dword ptr ds:[0],0 ds:0023:00000000=????????
0:000> !teb
TEB at 7ffdf000
ExceptionList: 0012f9e8
StackBase: 00130000
StackLimit: 0012d000
SubSystemTib: 00000000
FiberData: 00001e00
ArbitraryUserPointer: 00000000
Self: 7ffdf000
EnvironmentPointer: 00000000
ClientId: 0000120c . 0000148c
RpcHandle: 00000000
Tls Storage: 7ffdf02c
PEB Address: 7ffda000
LastErrorValue: 0
LastStatusValue: c000008a
Count Owned Locks: 0
HardErrorMode: 0
0:000>dds 0012d000 00130000


0012f368 0012f3c0
0012f36c 7760fb01 kernel32!GetApplicationRecoveryCallback+0×33
0012f370 ffffffff
0012f374 0012f380
0012f378 00000001
0012f37c 00000000
0012f380 00000000
0012f384 00000000
0012f388 00000000
0012f38c 00000000
0012f390 00000000
0012f394 00000000
0012f398 00000000
0012f39c 00000000
0012f3a0 00000000
0012f3a4 00000000
0012f3a8 00000000
0012f3ac 00000000
0012f3b0 00000000
0012f3b4 00000000
0012f3b8 00000000
0012f3bc 00000000
0012f3c0 0012f410
0012f3c4 7767aa88 kernel32!WerpReportExceptionInProcessContext+0×82
0012f3c8 ffffffff
0012f3cc 0012f3ec
0012f3d0 00000000
0012f3d4 00000000
0012f3d8 7767aab7 kernel32!WerpReportExceptionInProcessContext+0xa7
0012f3dc 001257b9
0012f3e0 00000001
0012f3e4 00000000
0012f3e8 0012f4c8
0012f3ec 00000000
0012f3f0 00000000
0012f3f4 00000000
0012f3f8 0012f3dc
0012f3fc ffffffff
0012f400 0012f488
0012f404 775d5ac9 kernel32!_except_handler4
0012f408 77670969 kernel32!Internal_NotifyUILanguageChange+0×4a6
0012f40c fffffffe
0012f410 7767aab7 kernel32!WerpReportExceptionInProcessContext+0xa7
0012f414 77655b41 kernel32!UnhandledExceptionFilter+0×1b2
0012f418 77655cbd kernel32!UnhandledExceptionFilter+0×32e
0012f41c 00125731
0012f420 00000000
0012f424 0012f4c8
0012f428 00000000
0012f42c 00000000
0012f430 00000000
0012f434 00000000
0012f438 00000000
0012f43c 00000800
0012f440 00000000
0012f444 00000000
0012f448 00000000
0012f44c 00000000
0012f450 00000000
0012f454 00000005
0012f458 994ac7c4
0012f45c 00000011
0012f460 00000000
0012f464 0012f5c0
0012f468 775d5ac9 kernel32!_except_handler4
0012f46c 00000001
0012f470 00000000
0012f474 77655cbd kernel32!UnhandledExceptionFilter+0×32e
0012f478 00000000
0012f47c 00000000
0012f480 0012f41c
0012f484 00000024
0012f488 0012f4f4
0012f48c 775d5ac9 kernel32!_except_handler4
0012f490 7765ff59 kernel32!PEWriteResource<_IMAGE_NT_HEADERS>+0×50a
0012f494 fffffffe
0012f498 77655cbd kernel32!UnhandledExceptionFilter+0×32e
0012f49c 77a29f8e ntdll!_RtlUserThreadStart+0×6f
0012f4a0 00000000
0012f4a4 779b8dd4 ntdll!_EH4_CallFilterFunc+0×12
0012f4a8 00000000
0012f4ac 0012ffec
0012f4b0 779ff108 ntdll! ?? ::FNODOBFM::`string’+0xb6e
0012f4b4 0012f4dc
0012f4b8 779b40e4 ntdll!_except_handler4+0xcc
0012f4bc 00000000
0012f4c0 00000000
0012f4c4 00000000
0012f4c8 0012f5c0
0012f4cc 0012f5dc
0012f4d0 779ff118 ntdll! ?? ::FNODOBFM::`string’+0xb7e
0012f4d4 00000001
0012f4d8 0112f5c0
0012f4dc 0012f500
0012f4e0 77a11039 ntdll!ExecuteHandler2+0×26
0012f4e4 fffffffe
0012f4e8 0012ffdc
0012f4ec 0012f5dc
0012f4f0 0012f59c
0012f4f4 0012f9e8
0012f4f8 77a1104d ntdll!ExecuteHandler2+0×3a
0012f4fc 0012ffdc
0012f500 0012f5a8
0012f504 77a1100b ntdll!ExecuteHandler+0×24
0012f508 0012f5c0
0012f50c 0012ffdc
0012f510 0012fe70
0012f514 0012f59c
0012f518 779b8bf2 ntdll!_except_handler4
0012f51c 00000000
0012f520 0012f5c0
0012f524 0012f538
0012f528 779b94e3 ntdll!RtlCallVectoredContinueHandlers+0×15
0012f52c 0012f5c0
0012f530 0012f5dc
0012f534 77a754c0 ntdll!RtlpCallbackEntryList
0012f538 0012f5a8
0012f53c 779b94c1 ntdll!RtlDispatchException+0×11f
0012f540 0012f5c0
0012f544 0012f5dc
0012f548 00425ae8 TestDefaultDebugger!CTestDefaultDebuggerApp::`vftable’+0×154
0012f54c 00000000
0012f550 00000502
0012f554 00000000
0012f558 00a460e0
0012f55c 00000000
0012f560 00000000
0012f564 00000070
0012f568 ffffffff
0012f56c ffffffff
0012f570 77b60dba USER32!UserCallDlgProcCheckWow+0×5f
0012f574 77b60e63 USER32!UserCallDlgProcCheckWow+0×16e
0012f578 0000006c
0012f57c 00000000
0012f580 00000000
0012f584 00000000
0012f588 00000000
0012f58c 0000004e
0012f590 00000000
0012f594 0012f634
0012f598 77bb76cc USER32!_except_handler4
0012f59c 0012f634
0012f5a0 00130000
0012f5a4 00000000
0012f5a8 0012f8b4
0012f5ac 77a10060 ntdll!NtRaiseException+0xc
0012f5b0 77a10eb2 ntdll!KiUserExceptionDispatcher+0×2a
0012f5b4 0012f5c0


It shows the presence of kernel32!UnhandledExceptionFilter calls. Let’s open TestDefaultDebugger.exe in WinDbg, put breakpoint on UnhandledExceptionFilter and trace the execution. We have to change the return value of IsDebugPortPresent to simulate the normal fault handling logic when no active debugger is attached:

0:000> bp kernel32!UnhandledExceptionFilter
0:000> g
(fb0.1190): Access violation - code c0000005 (first chance)
First chance exceptions are reported before any exception handling.
This exception may be expected and handled.
eax=00000000 ebx=00000001 ecx=0012fe70 edx=00000000 esi=00425ae8 edi=0012fe70
eip=004014f0 esp=0012f8a8 ebp=0012f8b4 iopl=0 nv up ei ng nz ac pe cy
cs=001b ss=0023 ds=0023 es=0023 fs=003b gs=0000 efl=00010297
TestDefaultDebugger!CTestDefaultDebuggerDlg::OnBnClickedButton1:
004014f0 mov dword ptr ds:[0],0 ds:0023:00000000=????????
0:000> g
Breakpoint 0 hit
eax=0042ae58 ebx=00000000 ecx=0042ae58 edx=0042ae58 esi=003b07d8 edi=c0000005
eip=77655984 esp=0012f478 ebp=0012f494 iopl=0 nv up ei pl zr na pe nc
cs=001b ss=0023 ds=0023 es=0023 fs=003b gs=0000 efl=00000246
kernel32!UnhandledExceptionFilter:
77655984 push 5Ch
0:000> g $$ skip first chance exception
Breakpoint 0 hit
eax=77655984 ebx=00000000 ecx=0012f404 edx=77a10f34 esi=0012f4c8 edi=00000000
eip=77655984 esp=0012f49c ebp=0012ffec iopl=0 nv up ei pl nz na pe nc
cs=001b ss=0023 ds=0023 es=0023 fs=003b gs=0000 efl=00000206
kernel32!UnhandledExceptionFilter:
77655984 push 5Ch
0:000> p
eax=77655984 ebx=00000000 ecx=0012f404 edx=77a10f34 esi=0012f4c8 edi=00000000
eip=77655986 esp=0012f498 ebp=0012ffec iopl=0 nv up ei pl nz na pe nc
cs=001b ss=0023 ds=0023 es=0023 fs=003b gs=0000 efl=00000206
kernel32!UnhandledExceptionFilter+0×2:
77655986 push offset kernel32!strcat_s+0×128d (77655cf0)


0:000> p
eax=00000000 ebx=0012f4c8 ecx=776558e5 edx=77a10f34 esi=00000000 edi=00000000
eip=77655a33 esp=0012f41c ebp=0012f498 iopl=0 nv up ei pl nz ac po cy
cs=001b ss=0023 ds=0023 es=0023 fs=003b gs=0000 efl=00000213
kernel32!UnhandledExceptionFilter+0xa5:
77655a33 call kernel32!IsDebugPortPresent (7765594c)
0:000> p
eax=00000001 ebx=0012f4c8 ecx=0012f3f4 edx=77a10f34 esi=00000000 edi=00000000
eip=77655a38 esp=0012f41c ebp=0012f498 iopl=0 nv up ei pl nz na po nc
cs=001b ss=0023 ds=0023 es=0023 fs=003b gs=0000 efl=00000202
kernel32!UnhandledExceptionFilter+0xaa:
77655a38 test eax,eax
0:000> r eax=0
0:000> p
eax=00000000 ebx=0012f4c8 ecx=0012f3f4 edx=77a10f34 esi=00000000 edi=00000000
eip=77655a3a esp=0012f41c ebp=0012f498 iopl=0 nv up ei pl zr na pe nc
cs=001b ss=0023 ds=0023 es=0023 fs=003b gs=0000 efl=00000246
kernel32!UnhandledExceptionFilter+0xac:
77655a3a jne kernel32!UnhandledExceptionFilter+0×22 (776559a6) [br=0]

Next, we continue to step over using p command until we see WerpReportExceptionInProcessContext function and step into it:

0:000> p
eax=c0000022 ebx=0012f4c8 ecx=0012f400 edx=77a10f34 esi=00000000 edi=00000001
eip=77655b3c esp=0012f418 ebp=0012f498 iopl=0 nv up ei pl nz na po nc
cs=001b ss=0023 ds=0023 es=0023 fs=003b gs=0000 efl=00000202
kernel32!UnhandledExceptionFilter+0×1ad:
77655b3c call kernel32!WerpReportExceptionInProcessContext (7767aa06)
0:000> t
eax=c0000022 ebx=0012f4c8 ecx=0012f400 edx=77a10f34 esi=00000000 edi=00000001
eip=7767aa06 esp=0012f414 ebp=0012f498 iopl=0 nv up ei pl nz na po nc
cs=001b ss=0023 ds=0023 es=0023 fs=003b gs=0000 efl=00000202
kernel32!WerpReportExceptionInProcessContext:
7767aa06 push 14h

At this point if we look at the stack trace we would see:

0:000> kL 100
ChildEBP RetAddr
0012f410 77655b41 kernel32!WerpReportExceptionInProcessContext
0012f498 77a29f8e kernel32!UnhandledExceptionFilter+0×1b2
0012f4a0 779b8dd4 ntdll!_RtlUserThreadStart+0×6f
0012f4b4 779b40f0 ntdll!_EH4_CallFilterFunc+0×12
0012f4dc 77a11039 ntdll!_except_handler4+0×8e
0012f500 77a1100b ntdll!ExecuteHandler2+0×26
0012f5a8 77a10e97 ntdll!ExecuteHandler+0×24
0012f5a8 004014f0 ntdll!KiUserExceptionDispatcher+0xf
0012f8a4 00403263 TestDefaultDebugger!CTestDefaultDebuggerDlg::OnBnClickedButton1
0012f8b4 00403470 TestDefaultDebugger!_AfxDispatchCmdMsg+0×43


After that we step over again and find that the code flow returns from all exception handlers until KiUserExceptionDispatcher raises exception again via ZwRaiseException call.

So it looks that the default unhandled exception filter in Vista only reports the exception and doesn’t launch the error reporting process that displays the error box, WerFault.exe.

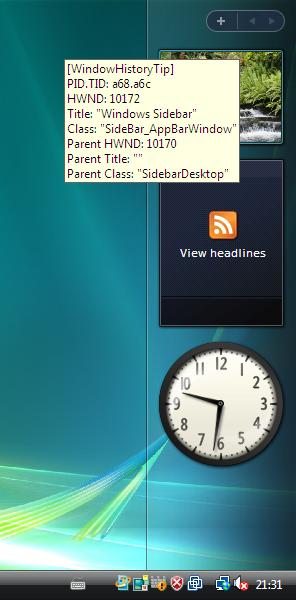
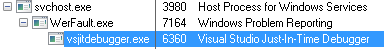
If we click on Debug button on the error reporting dialog to launch the postmortem debugger (I have Visual Studio Just-In-Time Debugger configured in AeDebug\Debugger registry key) and look at its parent process by using Process Explorer for example, we would see it is WerFault.exe which in turn has svchost.exe as its parent.

Now we quit WinDbg and launch TestDefaultDebugger again, push its big crash button and when the error reporting dialog appears we attach another instance of WinDbg to svchost.exe process hosting Windows Error Reporting Service (wersvc.dll).
We see the following threads:

0:000> ~*k
. 0 Id: f8c.f90 Suspend: 1 Teb: 7ffdf000 Unfrozen
ChildEBP RetAddr
0008f5b4 77a10080 ntdll!KiFastSystemCallRet
0008f5b8 7760853f ntdll!ZwReadFile+0xc
0008f630 7709ffe2 kernel32!ReadFile+0×20e
0008f65c 7709fdfb ADVAPI32!ScGetPipeInput+0×2a
0008f6c4 7709bdd2 ADVAPI32!ScDispatcherLoop+0×6c
0008f93c 004a241d ADVAPI32!StartServiceCtrlDispatcherW+0xce
0008f944 004a2401 svchost!SvcHostMain+0×12
0008f948 004a2183 svchost!wmain+0×5
0008f98c 77603833 svchost!_initterm_e+0×163
0008f998 779ea9bd kernel32!BaseThreadInitThunk+0xe
0008f9d8 00000000 ntdll!_RtlUserThreadStart+0×23
1 Id: f8c.fa4 Suspend: 1 Teb: 7ffdd000 Unfrozen
ChildEBP RetAddr
0086f6d0 77a10690 ntdll!KiFastSystemCallRet
0086f6d4 779cb65b ntdll!ZwWaitForMultipleObjects+0xc
0086f870 77603833 ntdll!TppWaiterpThread+0×294
0086f87c 779ea9bd kernel32!BaseThreadInitThunk+0xe
0086f8bc 00000000 ntdll!_RtlUserThreadStart+0×23
2 Id: f8c.fa8 Suspend: 1 Teb: 7ffdc000 Unfrozen
ChildEBP RetAddr
0031f81c 77a0f2c0 ntdll!KiFastSystemCallRet
0031f820 71cb1545 ntdll!NtAlpcSendWaitReceivePort+0xc
0031fd3c 71cb63c4 wersvc!CWerService::LpcServerThread+0×9c
0031fd44 77603833 wersvc!CWerService::StaticLpcServerThread+0xd
0031fd50 779ea9bd kernel32!BaseThreadInitThunk+0xe
0031fd90 00000000 ntdll!_RtlUserThreadStart+0×23
3 Id: f8c.2cc Suspend: 1 Teb: 7ffde000 Unfrozen
ChildEBP RetAddr
00f8f768 77a106a0 ntdll!KiFastSystemCallRet
00f8f76c 776077d4 ntdll!NtWaitForSingleObject+0xc
00f8f7dc 77607742 kernel32!WaitForSingleObjectEx+0xbe
00f8f7f0 71cb6f4b kernel32!WaitForSingleObject+0×12
00f8f858 71cb6803 wersvc!CWerService::ReportCrashKernelMsg+0×256
00f8fb7c 71cb6770 wersvc!CWerService::DispatchPortRequestWorkItem+0×70a
00f8fb90 779c1fbb wersvc!CWerService::StaticDispatchPortRequestWorkItem+0×17
00f8fbb4 77a1a2b8 ntdll!TppSimplepExecuteCallback+0×10c
00f8fcdc 77603833 ntdll!TppWorkerThread+0×522
00f8fce8 779ea9bd kernel32!BaseThreadInitThunk+0xe
00f8fd28 00000000 ntdll!_RtlUserThreadStart+0×23
4 Id: f8c.1b38 Suspend: 1 Teb: 7ffdb000 Unfrozen
ChildEBP RetAddr
00d3fe08 77a10850 ntdll!KiFastSystemCallRet
00d3fe0c 77a1a1b4 ntdll!NtWaitForWorkViaWorkerFactory+0xc
00d3ff34 77603833 ntdll!TppWorkerThread+0×1f6
00d3ff40 779ea9bd kernel32!BaseThreadInitThunk+0xe
00d3ff80 00000000 ntdll!_RtlUserThreadStart+0×23

First, it looks like some LPC notification mechanism is present here (CWerService::LpcServerThread).
Next, if we look at CWerService::ReportCrashKernelMsg code we would see it calls CWerService::ReportCrash which in turn loads faultrep.dll

0:000> .asm no_code_bytes
Assembly options: no_code_bytes
0:000> uf wersvc!CWerService::ReportCrashKernelMsg


wersvc!CWerService::ReportCrashKernelMsg+0×226:
71cb6f13 lea  eax,[ebp-20h]
71cb6f16 push eax
71cb6f17 push dword ptr [ebp-34h]
71cb6f1a push dword ptr [ebp-2Ch]
71cb6f1d call dword ptr [wersvc!_imp__GetCurrentProcessId (71cb1120)]
71cb6f23 push eax
71cb6f24 mov  ecx,dword ptr [ebp-38h]
71cb6f27 call wersvc!CWerService::ReportCrash (71cb7008)
71cb6f2c mov  dword ptr [ebp-1Ch],eax
71cb6f2f cmp  eax,ebx
71cb6f31 jl   wersvc!CWerService::ReportCrashKernelMsg+0×279 (71cb6a10)


0:000> uf wersvc!CWerService::ReportCrash


wersvc!CWerService::ReportCrash+0×3d:
71cb7045 mov  dword ptr [ebp-4],edi
71cb7048 push offset wersvc!`string’ (71cb711c)
71cb704d call dword ptr [wersvc!_imp__LoadLibraryW (71cb1144)]

71cb7053 mov  dword ptr [ebp-2Ch],eax
71cb7056 cmp  eax,edi
71cb7058 je   wersvc!CWerService::ReportCrash+0×52 (71cb9b47)

wersvc!CWerService::ReportCrash+0×88:
71cb705e push offset wersvc!`string’ (71cb7100)
71cb7063 push eax
71cb7064 call dword ptr [wersvc!_imp__GetProcAddress (71cb1140)]

71cb706a mov  ebx,eax
71cb706c cmp  ebx,edi
71cb706e je   wersvc!CWerService::ReportCrash+0×9a (71cb9b7d)


0:000> du 71cb711c
71cb711c “faultrep.dll”
0:000> da 71cb7100
71cb7100 “WerpInitiateCrashReporting”

If we attach a new instance of WinDbg to WerFault.exe and inspect its threads we would see:

0:003> ~*k
0 Id: 1bfc.16c4 Suspend: 1 Teb: 7ffdf000 Unfrozen
ChildEBP RetAddr
0015de60 77a10690 ntdll!KiFastSystemCallRet
0015de64 77607e09 ntdll!ZwWaitForMultipleObjects+0xc
0015df00 77b6c4b7 kernel32!WaitForMultipleObjectsEx+0×11d
0015df54 77b68b83 USER32!RealMsgWaitForMultipleObjectsEx+0×13c
0015df70 6d46d90d USER32!MsgWaitForMultipleObjects+0×1f
0015dfc0 6d4acd77 wer!UtilMsgWaitForMultipleObjects+0×8a
0015dff4 6d4a7694 wer!CInitialConsentUI::Show+0×133
0015e040 6d4a9a69 wer!CEventUI::GetInitialDialogSelection+0xc6
0015e104 6d46df18 wer!CEventUI::Start+0×32
0015e39c 6d46b743 wer!CWatson::ReportProblem+0×438
0015e3ac 6d46b708 wer!WatsonReportSend+0×1e
0015e3c8 6d46b682 wer!CDWInstance::WatsonReportStub+0×17
0015e3ec 6d472a7f wer!CDWInstance::SubmitReport+0×21e
0015e410 730b6d0d wer!WerReportSubmit+0×5d
0015f33c 730b73c1 faultrep!CCrashWatson::GenerateCrashReport+0×5c4
0015f5d4 730b4de1 faultrep!CCrashWatson::ReportCrash+0×374
0015fad4 009bd895 faultrep!WerpInitiateCrashReporting+0×304
0015fb0c 009b60cd WerFault!UserCrashMain+0×14e
0015fb30 009b644a WerFault!wmain+0xbf
0015fb74 77603833 WerFault!_initterm_e+0×163
1 Id: 1bfc.894 Suspend: 1 Teb: 7ffde000 Unfrozen
ChildEBP RetAddr
024afbf8 77a10690 ntdll!KiFastSystemCallRet
024afbfc 77607e09 ntdll!ZwWaitForMultipleObjects+0xc
024afc98 77b6c4b7 kernel32!WaitForMultipleObjectsEx+0×11d
024afcec 74fa161a USER32!RealMsgWaitForMultipleObjectsEx+0×13c
024afd0c 74fa2cb6 DUser!CoreSC::Wait+0×59
024afd34 74fa2c55 DUser!CoreSC::WaitMessage+0×54
024afd44 77b615c0 DUser!MphWaitMessageEx+0×22
024afd60 77a10e6e USER32!__ClientWaitMessageExMPH+0×1e
024afd7c 77b6b5bc ntdll!KiUserCallbackDispatcher+0×2e
024afd80 77b61598 USER32!NtUserWaitMessage+0xc
024afdb4 77b61460 USER32!DialogBox2+0×202
024afddc 77b614a2 USER32!InternalDialogBox+0xd0
024afdfc 77b61505 USER32!DialogBoxIndirectParamAorW+0×37
024afe1c 75036c51 USER32!DialogBoxIndirectParamW+0×1b
024afe40 75036beb comctl32!SHFusionDialogBoxIndirectParam+0×2d
024afe74 6d4a65a4 comctl32!CTaskDialog::Show+0×100
024afebc 6d4acb72 wer!IsolationAwareTaskDialogIndirect+0×64
024aff4c 6d4acc39 wer!CInitialConsentUI::InitialDlgThreadRoutine+0×369
024aff54 77603833 wer!CInitialConsentUI::Static_InitialDlgThreadRoutine+0xd
024aff60 779ea9bd kernel32!BaseThreadInitThunk+0xe
2 Id: 1bfc.1a04 Suspend: 1 Teb: 7ffdc000 Unfrozen
ChildEBP RetAddr
012bf998 77a10690 ntdll!KiFastSystemCallRet
012bf99c 77607e09 ntdll!ZwWaitForMultipleObjects+0xc
012bfa38 77b6c4b7 kernel32!WaitForMultipleObjectsEx+0×11d
012bfa8c 74fa161a USER32!RealMsgWaitForMultipleObjectsEx+0×13c
012bfaac 74fa1642 DUser!CoreSC::Wait+0×59
012bfae0 74fac442 DUser!CoreSC::xwProcessNL+0xaa
012bfb00 74fac3a2 DUser!GetMessageExA+0×44
012bfb54 779262b6 DUser!ResourceManager::SharedThreadProc+0xb6
012bfb8c 779263de msvcrt!_endthreadex+0×44
012bfb94 77603833 msvcrt!_endthreadex+0xce
012bfba0 779ea9bd kernel32!BaseThreadInitThunk+0xe
012bfbe0 00000000 ntdll!_RtlUserThreadStart+0×23
# 3 Id: 1bfc.14a4 Suspend: 1 Teb: 7ffdb000 Unfrozen
ChildEBP RetAddr
02a1fc40 77a3f0a9 ntdll!DbgBreakPoint
02a1fc70 77603833 ntdll!DbgUiRemoteBreakin+0×3c
02a1fc7c 779ea9bd kernel32!BaseThreadInitThunk+0xe
02a1fcbc 00000000 ntdll!_RtlUserThreadStart+0×23

Next, we put a breakpoint on CreateProcess, push Debug button on the error reporting dialog and upon the breakpoint hit inspect CreateProcess parameters:

0:003> .asm no_code_bytes
Assembly options: no_code_bytes
0:003> bp kernel32!CreateProcessW
0:003> g
Breakpoint 0 hit
eax=00000000 ebx=00000000 ecx=7ffdf000 edx=0015db30 esi=00000001 edi=00000000
eip=775c1d27 esp=0015dfe0 ebp=0015e408 iopl=0 nv up ei pl nz na po nc
cs=001b ss=0023 ds=0023 es=0023 fs=003b gs=0000 efl=00000202
kernel32!CreateProcessW:
775c1d27 mov edi,edi
0:000> ddu esp+8 l1
0015dfe8 008b0000 “”C:\WINDOWS\system32\vsjitdebugger.exe” -p 8064 -e 312″

ESP points to return address, ESP+4 points to the first CreateProcess parameter and ESP+8 points to the second parameter. The thread stack now involves faultrep.dll:

0:000> k
ChildEBP RetAddr
0020dde0 730bb2b5 kernel32!CreateProcessW
0020e20c 730b6dae faultrep!WerpLaunchAeDebug+0×384
0020f140 730b73c1 faultrep!CCrashWatson::GenerateCrashReport+0×665
0020f3d8 730b4de1 faultrep!CCrashWatson::ReportCrash+0×374
0020f8d8 009bd895 faultrep!WerpInitiateCrashReporting+0×304
0020f910 009b60cd WerFault!UserCrashMain+0×14e
0020f934 009b644a WerFault!wmain+0xbf
0020f978 77603833 WerFault!_initterm_e+0×163
0020f984 779ea9bd kernel32!BaseThreadInitThunk+0xe
0020f9c4 00000000 ntdll!_RtlUserThreadStart+0×23

Therefore it looks like calls to faultrep.dll module to report faults and launch the posmortem debugger were moved from UnhandledExceptionFilter to WerFault.exe in Vista.

Finally, let’s go back to our UnhandledExceptionFilter. If we disassemble it we would see that it can call kernel32!WerpLaunchAeDebug too:

0:000> .asm no_code_bytes
Assembly options: no_code_bytes
0:000> uf kernel32!UnhandledExceptionFilter


kernel32!UnhandledExceptionFilter+0×2d0:
77655c5f push dword ptr [ebp-28h]
77655c62 push dword ptr [ebp-1Ch]
77655c65 push dword ptr [ebx+4]
77655c68 push dword ptr [ebx]
77655c6a push 0FFFFFFFEh
77655c6c call kernel32!GetCurrentProcess (775e9145)
77655c71 push eax
77655c72 call kernel32!WerpLaunchAeDebug (7767baaf)
77655c77 test eax,eax
77655c79 jge  kernel32!UnhandledExceptionFilter+0×2f3 (77655c82)


kernel32!UnhandledExceptionFilter+0×303:
77655c92 mov  eax,dword ptr [ebx]
77655c94 push dword ptr [eax]
77655c96 push 0FFFFFFFFh
77655c98 call dword ptr [kernel32!_imp__NtTerminateProcess (775c14bc)]

If we look at WerpLaunchAeDebug code we would see that it calls CreateProcess too and the code is the same as in faultrep.dll. This could mean that faultrep.dll imports that function from kernel32.dll. So some postmortem debugger launching code is still present in the default unhandled exception filter perhaps for compatibility or in case WER doesn’t work or disabled.

High-level description of the differences between Windows XP and Vista application crash support is present in the recent Mark Russinovich’s article:

Inside the Windows Vista Kernel: Part 3 (Enhanced Crash Support)

- Dmitry Vostokov -

Process and Thread Startup in Vista

Saturday, May 19th, 2007

If you looked at process dumps from Vista or did live debugging you might have noticed that there are no longer kernel32 functions BaseProcessStart on the main thread stack and BaseThreadStart on subsequent thread stacks. In Vista we have ntdll!_RtlUserThreadStart which calls kernel32!BaseThreadInitThunk for both main and secondary threads:

0:002> ~*k
0 Id: 13e8.1348 Suspend: 1 Teb: 7ffdf000 Unfrozen
ChildEBP RetAddr
0009f8d8 77b7199a ntdll!KiFastSystemCallRet
0009f8dc 77b719cd USER32!NtUserGetMessage+0xc
0009f8f8 006b24e8 USER32!GetMessageW+0x33
0009f954 006c2588 calc!WinMain+0x278
0009f9e4 77603833 calc!_initterm_e+0x1a1
0009f9f0 779ea9bd kernel32!BaseThreadInitThunk+0xe
0009fa30 00000000 ntdll!_RtlUserThreadStart+0×23

1 Id: 13e8.534 Suspend: 1 Teb: 7ffde000 Unfrozen
ChildEBP RetAddr
0236f9d8 77a106a0 ntdll!KiFastSystemCallRet
0236f9dc 776077d4 ntdll!NtWaitForSingleObject+0xc
0236fa4c 77607742 kernel32!WaitForSingleObjectEx+0xbe
0236fa60 006b4958 kernel32!WaitForSingleObject+0×12
0236fa78 77603833 calc!WatchDogThread+0×21
0236fa84 779ea9bd kernel32!BaseThreadInitThunk+0xe
0236fac4 00000000 ntdll!_RtlUserThreadStart+0×23

# 2 Id: 13e8.1188 Suspend: 1 Teb: 7ffdd000 Unfrozen
ChildEBP RetAddr
0078fec8 77a3f0a9 ntdll!DbgBreakPoint
0078fef8 77603833 ntdll!DbgUiRemoteBreakin+0×3c
0078ff04 779ea9bd kernel32!BaseThreadInitThunk+0xe
0078ff44 00000000 ntdll!_RtlUserThreadStart+0×23

0:000> .asm no_code_bytes
Assembly options: no_code_bytes
0:000> uf ntdll!_RtlUserThreadStart
...
...
...
ntdll!_RtlUserThreadStart:
779ea996 push 14h
779ea998 push offset ntdll! ?? ::FNODOBFM::`string'+0xb6e (779ff108)
779ea99d call ntdll!_SEH_prolog4 (779f47d8)
779ea9a2 and  dword ptr [ebp-4],0
779ea9a6 mov  eax,dword ptr [ntdll!Kernel32ThreadInitThunkFunction (77a752a0)]
779ea9ab push dword ptr [ebp+0Ch]
779ea9ae test eax,eax
779ea9b0 je   ntdll!_RtlUserThreadStart+0x32 (779c6326)
...
...
...
0:000> dds ntdll!Kernel32ThreadInitThunkFunction l1
77a752a0 77603821 kernel32!BaseThreadInitThunk

- Dmitry Vostokov -

Who calls the postmortem debugger?

Monday, April 30th, 2007

I was trying to understand who calls dwwin.exe, the part of Windows Error Reporting on my Windows XP system when the crash happens. To find an answer I launched TestDefaultDebugger application and after pushing its crash button the following familiar WER dialog box appeared:

I repeated the same when running ProcessHistory in the background and looking at its log I found that the parent process for dwwin.exe and postmortem debugger (if we click on Debug button) was TestDefaultDebugger.exe. In my case the default postmortem debugger was drwtsn32.exe. To look inside I attached WinDbg to TestDefaultDebugger process when WER dialog box above was displayed and got the following stack trace:

0:000> k
ChildEBP RetAddr
0012d318 7c90e9ab ntdll!KiFastSystemCallRet
0012d31c 7c8094e2 ntdll!ZwWaitForMultipleObjects+0xc
0012d3b8 7c80a075 kernel32!WaitForMultipleObjectsEx+0x12c
0012d3d4 6945763c kernel32!WaitForMultipleObjects+0x18
0012dd68 694582b1 faultrep!StartDWException+0×5df
0012eddc 7c8633e9 faultrep!ReportFault+0×533
0012f47c 00411eaa kernel32!UnhandledExceptionFilter+0×587
0012f49c 0040e879 TestDefaultDebugger+0×11eaa
0012ffc0 7c816fd7 TestDefaultDebugger+0xe879
0012fff0 00000000 kernel32!BaseProcessStart+0×23

The combination of StartDWException and WaitForMultipleObjects suggests that dwwin.exe process is started there. Indeed, when I disassembled StartDWException function I saw CreateProcess call just before the wait call:

0:000> uf faultrep!StartDWException
...
...
...
69457585 8d8568f7ffff    lea     eax,[ebp-898h]
6945758b 50              push    eax
6945758c 8d8524f7ffff    lea     eax,[ebp-8DCh]
69457592 50              push    eax
69457593 8d85d4fbffff    lea     eax,[ebp-42Ch]
69457599 50              push    eax
6945759a 33c0            xor     eax,eax
6945759c 50              push    eax
6945759d 6820000004      push    4000020h
694575a2 6a01            push    1
694575a4 50              push    eax
694575a5 50              push    eax
694575a6 ffb5a4f7ffff    push    dword ptr [ebp-85Ch]
694575ac 50              push    eax
694575ad ff1558114569    call    dword ptr [faultrep!_imp__CreateProcessW (69451158)]


The second parameter of CreateProcess, [ebp-85Ch], is the address of the process command line and we know EBP value from the call stack above, 0012dd68. Just to remind that parameters for Win32 API functions are pushed from right to left. So we get the command line straight away:

0:000> dpu 0012dd68-85Ch l1
0012d50c  0012d3ec "C:\WINDOWS\system32\dwwin.exe -x -s 208"

If we dismiss WER dialog by clicking on Debug button then the postmortem debugger starts. Also it starts without WER dialog displayed if we rename faultrep.dll beforehand. So it looks like the obvious place to look for postmortem debugger launch is UnhandledExceptionFilter. Indeed, we see it there:

0:000> uf kernel32!UnhandledExceptionFilter
...
...
...
7c8636a8 8d850cfaffff    lea     eax,[ebp-5F4h]
7c8636ae 50              push    eax
7c8636af 8d857cf9ffff    lea     eax,[ebp-684h]
7c8636b5 50              push    eax
7c8636b6 33c0            xor     eax,eax
7c8636b8 50              push    eax
7c8636b9 50              push    eax
7c8636ba 50              push    eax
7c8636bb 6a01            push    1
7c8636bd 50              push    eax
7c8636be 50              push    eax
7c8636bf 53              push    ebx
7c8636c0 50              push    eax
7c8636c1 e86cecf9ff      call    kernel32!CreateProcessW (7c802332)


Because this is the code that yet to be executed we need to put a breakpoint at 7c8636c1, continue execution, and when the breakpoint is hit dump the second parameter to CreateProcess that is the memory EBX points to:

0:000> bp 7c8636c1
0:000> g
Breakpoint 0 hit
eax=00000000 ebx=0012ed78 ecx=0012ec70 edx=7c90eb94 esi=0000003a edi=00000000
eip=7c8636c1 esp=0012ed50 ebp=0012f47c iopl=0 nv up ei pl zr na pe nc
cs=001b  ss=0023  ds=0023  es=0023  fs=003b  gs=0000 efl=00000246
kernel32!UnhandledExceptionFilter+0x84b:
7c8636c1 e86cecf9ff      call    kernel32!CreateProcessW (7c802332)
0:000> du @ebx
0012ed78  “c:\drwatson\drwtsn32 -p 656 -e 1″
0012edb8  “72 -g”

You see that UnhandledExceptionFilter is about to launch my custom Dr. Watson postmortem debugger.  

If you look further at UnhandledExceptionFilter disassembled code you would see that after creating postmortem debugger process and waiting for it to finish saving the process dump the function calls NtTerminateProcess.

Therefore all error reporting, calling the postmortem debugger and final process termination are done in the same process that had the exception. The latter two parts are also described in Matt Pietrek’s article as I found afterwards.

One addition to that article written in 1997: starting from Windows XP UnhandledExceptionFilter locates and loads faultrep.dll which launches dwwin.exe to report an error:

kernel32!UnhandledExceptionFilter+0x4f7:
7c863359 8d85acfaffff    lea     eax,[ebp-554h]
7c86335f 50              push    eax
7c863360 8d8570faffff    lea     eax,[ebp-590h]
7c863366 50              push    eax
7c863367 56              push    esi
7c863368 56              push    esi
7c863369 e8fbacfaff      call    kernel32!LdrLoadDll (7c80e069)
0:000> dt _UNICODE_STRING 0012f47c-590
 "C:\WINDOWS\system32\faultrep.dll"
   +0x000 Length           : 0x40
   +0x002 MaximumLength    : 0x100
   +0x004 Buffer           : 0x0012f360  "C:\WINDOWS\system32\faultrep.dll"

You can also see that all processing is done using the same thread stack. So if something is wrong with that stack then you have silent process termination and no error is reported. In Vista there are some improvements that I’m going to cover in detail in a separate post.

- Dmitry Vostokov -

Bugchecks: KMODE_EXCEPTION_NOT_HANDLED

Wednesday, April 25th, 2007

This bugcheck (0×1E) is essentially the same as KERNEL_MODE_EXCEPTION_NOT_HANDLED (0×8E) although parameters are different:

KMODE_EXCEPTION_NOT_HANDLED (1e)
This is a very common bugcheck. Usually the exception address pinpoints the driver/function that caused the problem. Always note this address as well as the link date of the driver/image that contains this address.
Arguments:
Arg1: c0000005, The exception code that was not handled
Arg2: 8046ce72, The address that the exception occurred at
Arg3: 00000000, Parameter 0 of the exception
Arg4: 00000000, Parameter 1 of the exception

KERNEL_MODE_EXCEPTION_NOT_HANDLED (8e)
This is a very common bugcheck. Usually the exception address pinpoints the driver/function that caused the problem. Always note this address as well as the link date of the driver/image that contains this address. Some common problems are exception code 0×80000003. This means a hard coded breakpoint or assertion was hit, but this system was booted /NODEBUG. This is not supposed to happen as developers should never have hardcoded breakpoints in retail code, but … If this happens, make sure a debugger gets connected, and the system is booted /DEBUG. This will let us see why this breakpoint is happening.
Arguments:
Arg1: c0000005, The exception code that was not handled
Arg2: 808cbb8d, The address that the exception occurred at
Arg3: f5a84638, Trap Frame
Arg4: 00000000

Bugcheck 0×1E is called from the same routine KiDispatchException on x64 W2K3 and on x86 W2K whereas 0×8E is called on x86 W2K3 and Vista platforms. I haven’t checked this with x64 Vista. Here is the modified UML diagram showing both bugchecks:


- Dmitry Vostokov -

WindowHistory 4.0

Thursday, February 15th, 2007

I’ve added tool tips showing window information when pointing at any window. Here are some screenshots:

This works inside Citrix seamless ICA sessions too. Additionally the new version tracks client window rectangle and its changes (this was missing in the previous versions).

It works on Vista (doesn’t require elevation):

32-bit version can be downloaded from Citrix support web site.

64-bit version, which tracks changes for both 32-bit and 64-bit windows on x64 Windows platform, can also be downloaded from Citrix support web site.

- Dmitry Vostokov @ DumpAnalysis.org -

Dumping Vista

Sunday, February 4th, 2007

32-bit Vista

If you need to dump a running 32-bit Vista system you can do it with Citrix SystemDump tool. You just need to run it with elevated administrator rights:

  • right click SystemDump.exe in appropriate Computer explorer folder and choose “Run as administrator”

  • if you use command line options run SystemDump.exe from elevated command prompt (Start -> All Programs -> Accessories, right click Command Prompt, and then select “Run as administrator”)

Here is a screenshot before dumping my Vista and WinDbg output from saved kernel dump:

Loading Dump File [C:\Windows\MEMORY.DMP]
Kernel Summary Dump File: Only kernel address space is available
Windows Vista Kernel Version 6000 UP Free x86 compatible
Product: WinNt, suite: TerminalServer SingleUserTS
Built by: 6000.16386.x86fre.vista_rtm.061101-2205
Kernel base = 0x81800000 PsLoadedModuleList = 0x81908ab0
Debug session time: Sat Jan 27 20:13:10.917 2007 (GMT+0)
System Uptime: 0 days 1:33:13.589
Loading Kernel Symbols
Loading User Symbols
Loading unloaded module list
BugCheck E2, {cccccccc, 83286f08, 1a, 0}
Probably caused by : SystemDump.sys

64-bit Vista

Currently in order to use 64-bit SystemDump you have to disable “Driver Signature Enforcement” by:

  • F8 Advanced Boot Option
  • command line tool BCDedit
  • attaching an active kernel debugger

Then you need to run SystemDump64.exe as administrator.

- Dmitry Vostokov -

Unhandled exception handling changes in Vista

Tuesday, December 26th, 2006

Microsoft describes the reason behind these changes: silent process death if thread stack is corrupt. In Vista such crashes will be reported to MS via Windows Error Reporting mechanism.

Presentation, Reliability and Recovery, slide 42

- Dmitry Vostokov -