Archive for the ‘Vista’ Category
Saturday, September 26th, 2009
DumpAnalysis.org accepts hardware such as laptops for reviewing in relation to their suitability for extreme debugging, virtualization, trace analysis, computer forensics, memory dump analysis, visualization and auralization. If you work for a H/W company like HP, Apple, Dell, Acer, Sony or any other respectable manufacturer please don’t hesitate to forward this post to your management: it could be your company brand or laptop model that debugging and software technical support community chooses next time of upgrade or for T&D / R&D! H/W reviews will be posted on the main portal page which currently has an audience of more than 200,000 unique visitors per year from more than 30,000 network locations (*).
If your company is interested please don’t hesitate to use this contact form:
http://www.dumpanalysis.org/contact
(*) From Google Analytics report.
- Dmitry Vostokov @ DumpAnalysis.org -
Posted in Announcements, Crash Dump Analysis, Debugging, Hardware, Memory Analysis Forensics and Intelligence, Memory Auralization, Memory Visualization, Security, Software Engineering, Software Technical Support, Software Trace Analysis, Testing, Tools, Virtualization, Vista, Visual Dump Analysis, Windows 7, Windows Server 2008, Windows System Administration | No Comments »
Saturday, August 8th, 2009
The digital version of the book is finally available:
x64 Windows Debugging: Practical Foundations
Paperback should be available in 1-2 weeks on Amazon and other stores. When working on the book I fixed errors in the previous x86 version. Errata file for it should be available tomorrow.
- Dmitry Vostokov @ DumpAnalysis.org -
Posted in Announcements, Assembly Language, Books, C and C++, Certification, Code Reading, Crash Dump Analysis, Debugging, Education and Research, Memory Dump Analysis Jobs, Publishing, Security, Software Engineering, Software Technical Support, Testing, Tools, Training and Seminars, Vista, Windows 7, Windows Server 2008 | No Comments »
Friday, July 17th, 2009
I resumed this week my reading notebook on Software Generalist blog with a top priority book to read every working day: Windows Internals, 5th edition. In reading notes I put what I find interesting for me (at this time) or related to Windows memory dump analysis or debugging and troubleshooting in general. For the latter case, sometimes I put additional references or even WinDbg examples from user, kernel and complete memory dumps in full color. Hope you find these notes useful too.
- Dmitry Vostokov @ DumpAnalysis.org -
Posted in Announcements, Books, Crash Dump Analysis, Debugging, Kernel Development, Reading Notebook, Software Architecture, Software Technical Support, Tools, Vista, Windows Server 2008 | No Comments »
Saturday, July 4th, 2009
Got it in the post yesterday shipped via courier from Amazon:
Windows® Internals: Including Windows Server 2008 and Windows Vista, Fifth Edition (PRO-Developer)

I originally expected it to be a paperback book but as a publisher myself I welcome the final MS Press decision to make it a hardcover. It is more solid. I plan to read it from cover to cover again, starting from tomorrow. I would like to thank authors for including the reference to www.dumpanalysis.org in the conclusion part of the last chapter 14 dedicated to crash dump analysis. This came as a nice surprise for me and I’m going to install a special plaque in the office and put its picture later on my blog.
- Dmitry Vostokov @ DumpAnalysis.org -
Posted in Announcements, Books, Certification, Crash Dump Analysis, Debugging, Software Architecture, Software Technical Support, Tools, Vista, Windows Server 2008, Windows System Administration | 4 Comments »
Friday, April 24th, 2009
I looked at thread raw stack in a process dump from Windows Server 2008 and found ntdll!FinalExceptionHandler symbol:
Loading Dump File [App.dmp]

User Mini Dump File with Full Memory: Only application data is available

Windows Server 2008/Windows Vista Version 6001 (Service Pack 1) MP (4 procs) Free x86 compatible
0:000> !teb
TEB at 7ffde000
ExceptionList: 0022fdd8
StackBase: 00230000
StackLimit: 00225000
SubSystemTib: 00000000
FiberData: 00001e00
ArbitraryUserPointer: 00000000
Self: 7ffde000
EnvironmentPointer: 00000000
ClientId: 00002458 . 00002478
RpcHandle: 00000000
Tls Storage: 7ffde02c
PEB Address: 7ffdf000
LastErrorValue: 0
LastStatusValue: c0000035
Count Owned Locks: 0
HardErrorMode: 0
0:000> dds 00225000 00230000

[...]

0022ff7c  00000000

0022ff80  00000000

0022ff84  00000000

0022ff88  0022ff94

0022ff8c  76744911 kernel32!BaseThreadInitThunk+0xe

0022ff90  7ffdf000

0022ff94  0022ffd4

0022ff98  77b5e4b6 ntdll!__RtlUserThreadStart+0x23

0022ff9c  7ffdf000

0022ffa0  2497b80a

0022ffa4  00000000

0022ffa8  00000000

0022ffac  7ffdf000

0022ffb0  00000000

0022ffb4  00000000

0022ffb8  00000000

0022ffbc  0022ffa0

0022ffc0  00000000

0022ffc4  0022ffe4

0022ffc8  77b29834 ntdll!_except_handler4

0022ffcc  530d7826

0022ffd0  00000000

0022ffd4  0022ffec

0022ffd8  77b5e489 ntdll!_RtlUserThreadStart+0x1b

0022ffdc  00401110 App+0x1110

0022ffe0  7ffdf000

0022ffe4  ffffffff

0022ffe8  77bc75de ntdll!FinalExceptionHandler

0022ffec  00000000

0022fff0  00000000

0022fff4  00401110 App+0×1110

0022fff8  7ffdf000

0022fffc  00000000

00230000  78746341
Search on Internet led me to this very interesting review article about Windows memory protection mechanisms:
http://taossa.com/archive/bh08sotirovdowd.pdf
It also explains this new “Final” exception mechanism in W2K8.
I couldn’t find this in raw stack traces on Windows 7 so it might be the case that it is not enabled by default there like in Windows Vista.
- Dmitry Vostokov @ DumpAnalysis.org -
Posted in Crash Dump Analysis, Security, Vista, Windows 7, Windows Server 2008 | 3 Comments »
Friday, March 20th, 2009
In Windows Vista and Server 2008 LPC is implemented using undocumented Advanced Local Procedure Calls (ALPC) and the new formatting of the !process 0 ff output shows the owner of the port:
THREAD fffffa801afae6f0  Cid 033c.3c40  Teb: 000007fffffa0000 Win32Thread: 0000000000000000 WAIT: (WrLpcReply) UserMode Non-Alertable

    fffffa801afaea80  Semaphore Limit 0x1

Waiting for reply to ALPC Message fffff8800f4cc950 : queued at port fffffa8017dbb060 : owned by process fffffa801807b8f0
Instead of !lpc we should use !alpc extension command:
0: kd> !lpc message fffff8800f4cc950

LPC is now emulated over ALPC. Use !alpc

Arguments:
   /?                   - Print help

   /P [/V] PortAddress  - Dump the ALPC port information

   /M [/V] MsgAddress   - Searches the message and dumps the message information

   /R [/V] ResAddress   - Dumps the information regarding resources

   /G [/V]              - Dumps the global information
0: kd> !alpc /M fffff8800f4cc950
Message @ fffff8800f4cc950

  MessageID             : 0x0BFC (3068)

  CallbackID            : 0x1FEF27 (2092839)

  SequenceNumber        : 0x0004D4D4 (316628)

  Type                  : LPC_REQUEST

  DataLength            : 0x0068 (104)

  TotalLength           : 0x0090 (144)

  Canceled              : No

  Release               : No

  ReplyWaitReply        : No

  Continuation          : Yes

  OwnerPort             : fffffa8018a95e60 [ALPC_CLIENT_COMMUNICATION_PORT]

  WaitingThread         : fffffa801afae6f0

  QueueType             : ALPC_MSGQUEUE_PENDING

  QueuePort             : fffffa8017dbb060 [ALPC_CONNECTION_PORT]

  QueuePortOwnerProcess : fffffa801807b8f0 (svchost.exe)

  ServerThread          : fffffa801aeec060

  QuotaCharged          : No

  CancelQueuePort       : 0000000000000000

  CancelSequencePort    : 0000000000000000

  CancelSequenceNumber  : 0×00000000 (0)

  ClientContext         : 00000000025599e0

  ServerContext         : 0000000000000000

  PortContext           : 000000000030d640

  CancelPortContext     : 0000000000000000

  SecurityData          : 0000000000000000

  View                  : 0000000000000000
- Dmitry Vostokov @ DumpAnalysis.org -
Posted in Crash Dump Analysis, Crash Dump Patterns, Debugging, Vista, WinDbg Tips and Tricks, Windows Server 2008 | 1 Comment »
Thursday, March 19th, 2009
Looking at one kernel memory dump from x64 Windows Server 2008 I noticed this API call (shown in blue):
0: kd> kL 100

Child-SP          RetAddr           Call Site

fffffa60`138f4720 fffff800`01875f8a nt!KiSwapContext+0x7f

fffffa60`138f4860 fffff800`0187776a nt!KiSwapThread+0x2fa

fffffa60`138f48d0 fffff800`01ab16d6 nt!KeWaitForSingleObject+0x2da

fffffa60`138f4960 fffff800`01ab1667 nt!FsRtlCancellableWaitForMultipleObjects+0x62

fffffa60`138f49c0 fffffa60`06c515e0 nt!FsRtlCancellableWaitForSingleObject+0x27

fffffa60`138f4a00 fffffa60`06c611dc rdbss!RxWaitForStableCondition+0x11c

fffffa60`138f4a40 fffffa60`06c61c07 rdbss!RxFindOrCreateConnections+0x44c

fffffa60`138f4b20 fffffa60`06c56840 rdbss!RxConstructVirtualNetRoot+0xb7

fffffa60`138f4bc0 fffffa60`06c6381a rdbss!RxFindOrConstructVirtualNetRoot+0x594

fffffa60`138f4d30 fffffa60`06c54c42 rdbss!RxCreateTreeConnect+0x13e

fffffa60`138f4dc0 fffffa60`06c2fbf6 rdbss!RxCommonCreate+0x20a

fffffa60`138f4e80 fffffa60`06c5191a rdbss!RxFsdCommonDispatch+0x786

fffffa60`138f4f70 fffffa60`07e4f21f rdbss!RxFsdDispatch+0x21a

fffffa60`138f4fe0 fffffa60`011e05f5 mrxsmb!MRxSmbFsdDispatch+0xbf

fffffa60`138f5020 fffffa60`011e0130 mup!MupiCallUncProvider+0x159

fffffa60`138f5090 fffffa60`011e17af mup!MupStateMachine+0x120

fffffa60`138f50e0 fffffa60`00d200b4 mup!MupCreate+0x2c3

fffffa60`138f5160 fffffa60`06d332d6 fltmgr!FltpCreate+0xa4

[...]

3rd party filter drivers

[...]

fffffa60`138f55a0 fffff800`01aefa59 nt!IopParseDevice+0x5e3

fffffa60`138f5740 fffff800`01af3944 nt!ObpLookupObjectName+0x5eb

fffffa60`138f5850 fffff800`01affee0 nt!ObOpenObjectByName+0x2f4

fffffa60`138f5920 fffff800`01b00a0c nt!IopCreateFile+0x290

fffffa60`138f59c0 fffff800`0186fdf3 nt!NtCreateFile+0x78

fffffa60`138f5a50 fffff800`01870300 nt!KiSystemServiceCopyEnd+0x13

fffffa60`138f5c58 fffffa60`06c91a5e nt!KiServiceLinkage

fffffa60`138f5c60 fffff800`018913d1 dfsc!DfscConnOpenIpcConnectionCallout+0xbe

fffffa60`138f5d20 fffffa60`06c91d08 nt!KeExpandKernelStackAndCalloutEx+0×2e1

fffffa60`138f5db0 fffffa60`06c9bbcc dfsc!DfscGetIpcConnection+0×1f0

fffffa60`138f5e30 fffffa60`06c9bb21 dfsc!DfscRmGetReferral+0×78

fffffa60`138f5ea0 fffffa60`06c91470 dfsc!DfscGetDomainDCReferral+0×31

fffffa60`138f5ef0 fffffa60`06c917ec dfsc!DfscRmValidateDomainIterate+0×5c

fffffa60`138f5f40 fffffa60`06c915f5 dfsc!DfscValidateReferral+0xa0

fffffa60`138f5fb0 fffffa60`06c917ec dfsc!DfscRmValidateRootGetParent+0×75

fffffa60`138f5fe0 fffffa60`06c90825 dfsc!DfscValidateReferral+0xa0

fffffa60`138f6050 fffffa60`06c93905 dfsc!DfscCmValidateState+0×79

fffffa60`138f6090 fffffa60`06c9e759 dfsc!DfscSurrogateCreate+0×7d

fffffa60`138f6100 fffffa60`011e03ab dfsc!DfscSurrogatePreProcess+0xb9

fffffa60`138f6130 fffffa60`011e014f mup!MupCallSurrogatePrePost+0×10b

fffffa60`138f6190 fffffa60`011e17af mup!MupStateMachine+0×13f

fffffa60`138f61e0 fffffa60`00d200b4 mup!MupCreate+0×2c3

fffffa60`138f6260 fffffa60`06d332d6 fltmgr!FltpCreate+0xa4

[…]

3rd party filter drivers

[…]

fffffa60`138f6610 fffff800`01aefa59 nt!IopParseDevice+0×5e3

fffffa60`138f67b0 fffff800`01af3944 nt!ObpLookupObjectName+0×5eb

fffffa60`138f68c0 fffff800`01ac22f1 nt!ObOpenObjectByName+0×2f4

fffffa60`138f6990 fffff800`0186fdf3 nt!NtQueryAttributesFile+0×134

fffffa60`138f6c20 00000000`77285e4a nt!KiSystemServiceCopyEnd+0×13
This API is mentioned in the following presentation and document and can also be found in WDK:
PPT: Windows Memory Management Advances
DOC: Advances in Memory Management
KeExpandKernelStackAndCallout
Its 3rd parameter is the stack size and we can see it used in disassembly where r8d register is used for 3rd parameter according to x64 calling convention and rcx is used for the first parameter, a function procedure to be executed with a guaranteed kernel stack size:
0: kd> kv 100

Child-SP          RetAddr           : Args to Child                                                           : Call Site

[...]

fffffa60`138f5c60 fffff800`018913d1 : 00000000`00000000 fffff880`10d6d3f8 00000000`00000000 00000000`00000000 : dfsc!DfscConnOpenIpcConnectionCallout+0xbe

fffffa60`138f5d20 fffffa60`06c91d08 : fffffa60`06c919a0 fffffa60`138f5df0 fffff880`102128d0 fffffa60`138f5f10 : nt!KeExpandKernelStackAndCalloutEx+0×2e1

fffffa60`138f5db0 fffffa60`06c9bbcc : 00000000`00000000 fffff880`10d6d3f8 00000000`00000000 fffff880`10d6d460 : dfsc!DfscGetIpcConnection+0×1f0

[…]
0: kd> ub fffffa60`06c91d08

dfsc!DfscGetIpcConnection+0×1c6:

fffffa60`06c91cde xor     r9d,r9d

fffffa60`06c91ce1 mov     qword ptr [rsp+50h],rax

fffffa60`06c91ce6 mov     rax,qword ptr [dfsc!DfscGlobalData+0×138 (fffffa60`06c8d758)]

fffffa60`06c91ced mov     r8d,6000h

fffffa60`06c91cf3 mov     qword ptr [rsp+40h],rdi

fffffa60`06c91cf8 mov     byte ptr [rsp+58h],r11b

fffffa60`06c91cfd mov     qword ptr [rsp+20h],rax

fffffa60`06c91d02 call    qword ptr [dfsc!_imp_KeExpandKernelStackAndCalloutEx (fffffa60`06c8b0d0)]
0: kd> ub fffffa60`06c91cde

dfsc!DfscGetIpcConnection+0x199:

fffffa60`06c91cb1 488b88b8000000  mov     rcx,qword ptr [rax+0B8h]

fffffa60`06c91cb8 0fba61100a      bt      dword ptr [rcx+10h],0Ah

fffffa60`06c91cbd 450f42df        cmovb   r11d,r15d

fffffa60`06c91cc1 488b4338        mov     rax,qword ptr [rbx+38h]

fffffa60`06c91cc5 488d542440      lea     rdx,[rsp+40h]

fffffa60`06c91cca 488d0dcffcffff  lea     rcx,[dfsc!DfscConnOpenIpcConnectionCallout (fffffa60`06c919a0)]

fffffa60`06c91cd1 4889442448      mov     qword ptr [rsp+48h],rax

fffffa60`06c91cd6 488d842490000000 lea     rax,[rsp+90h]
It is good sign to see it used in file system stacks because in the past the fixed kernel stacks resulted in stack overflows and double faults:
Stack Overflow Pattern (kernel mode)
- Dmitry Vostokov @ DumpAnalysis.org -
Posted in Assembly Language, Crash Dump Analysis, Debugging, Kernel Development, Vista, Windows Server 2008 | No Comments »
Saturday, March 7th, 2009
I’m sorry to announce that the book has been delayed and the publication date has been changed to 30th of November, 2009. I promise this delay is the last one and kindly ask you to be patient. As a bonus or compensation for it, the book will also cover Windows 7.
- Dmitry Vostokov @ DumpAnalysis.org -
Posted in Announcements, Books, Crash Dump Analysis, Minidump Analysis, Publishing, Software Technical Support, Testing, Tools, Training and Seminars, Vista, Windows 7, Windows Server 2008, Windows System Administration | No Comments »
Friday, February 20th, 2009
One of the good outcomes of the previously announced restructuring: the book Crash Dump Analysis for System Administrators (Windows edition) has been prioritized to be published on 30th of November, 2009 due to the overwhelming demand. The book will soon be available for pre-orders.
- Dmitry Vostokov @ DumpAnalysis.org -
Posted in Announcements, Books, Crash Dump Analysis, Minidump Analysis, Publishing, Software Technical Support, Testing, Tools, Training and Seminars, Vista, Windows 7, Windows Server 2008, Windows System Administration | No Comments »
Friday, January 16th, 2009
DumpAnalysis.org accepts hardware such as laptops for reviewing in relation to their suitability for extreme debugging, computer forensics, crash dump analysis and memory visualization. If you work for a H/W company like HP, Apple, Dell, Acer, Sony or any other respectable manufacturer please don’t hesitate to forward this post to your management: it could be your company brand or laptop model that debugging and software technical support community chooses next time of upgrade or for T&D / R&D! H/W reviews will be posted on the main portal page which currently has an audience of more than a hundred thousand unique visitors per year from more than 20,000 network locations (*).
If your company is interested please don’t hesitate to use this contact form:
http://www.dumpanalysis.org/contact
(*) From Google Analytics report.
- Dmitry Vostokov @ DumpAnalysis.org -
Posted in Announcements, Crash Dump Analysis, Debugging, Hardware, Memory Analysis Forensics and Intelligence, Memory Visualization, Vista, Windows Server 2008 | No Comments »
Tuesday, December 23rd, 2008
The following book is planned for publication during the 1st quarter of 2009:
Title: Reference Stack Traces: Windows Server® 2008 and Windows Vista™
ISBN-13: 978-1-906717-23-0
It features visual separation between kernel and user space in thread stack traces and useful footnotes for IRP and modules. Its publishing was delayed by a few months but fortunately my editing just got new breath by introducing thread stackprint images for kernel stacks (12Kb bitmaps):
Sample pages 13 and 96
Thread stackprints were generated from a complete memory dump using WinDbg scripts and Dump2Picture.
- Dmitry Vostokov @ DumpAnalysis.org -
Posted in Announcements, Books, Crash Dump Analysis, Crash Dump Patterns, Debugging, Fun with Crash Dumps, Memory Visualization, Publishing, Software Technical Support, Stack Trace Collection, Tools, Vista, Windows Server 2008 | No Comments »
Tuesday, November 25th, 2008
As one of the new initiatives for the Year of Debugging DumpAnalysis Portal will publish bimonthly full color 16 page publication called:
Debugged! MZ/PE: MagaZine for/from Practicing Engineers
The only serial publication dedicated entirely to Windows® debugging
The first issue is planned for March, 2009 and will have ISBN-13: 978-1-906717-38-4. If it goes well I’m planning to have ISSN number assigned to it too. More details will be announced soon.
- Dmitry Vostokov @ DumpAnalysis.org -
Posted in Announcements, Assembly Language, Books, Bugchecks Depicted, CDA Pattern Classification, Citrix, Common Mistakes, Crash Dump Analysis, Crash Dump Patterns, Crash Dumps for Dummies, Data Recovery, Debugged! MZ/PE, Debugging, IDA for WinDbg Users, Kernel Development, Memory Analysis Forensics and Intelligence, Memory Visualization, Minidump Analysis, Philosophy, Publishing, Security, Software Technical Support, Testing, Tools, Training and Seminars, Troubleshooting Methodology, Vista, WinDbg Scripts, WinDbg Tips and Tricks, WinDbg for GDB Users, Windows Server 2008 | 4 Comments »
Wednesday, November 19th, 2008
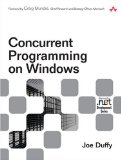
Got this book yesterday in the post and started reading. Table of contents is amazing for its practical depth and breadth. If you want me to provide a review in a language of concurrency (I’m reading many books in parallel) I would simply say one word:
Priority!
It simply means priority reading for any Windows software developer and maintainer. Invaluable for any engineer debugging complex software problems and analyzing Windows crash dumps. Simply because Microsoft OS and CLR developers use all this concurrent stuff and best practices described in the book so it is vital to be able recognize them in memory dumps. After reading this book you also get priority boost in your understanding of process and thread dynamics and your ability to plan, architect, design and implement concurrent applications and services.
Concurrent Programming on Windows (Microsoft .NET Development Series)
- Dmitry Vostokov @ DumpAnalysis.org -
Posted in Books, Code Reading, Crash Dump Analysis, Debugging, Software Architecture, Vista, Windows Server 2008 | 3 Comments »
Friday, November 7th, 2008
CtxHideEx32 tool has been updated to the version 1.1 and can be downloaded from Citrix support. It now allows a substring search for a window title or class, for example:
CtxHideEx32.exe HIDE "*error" "" OK
As by-product coupled with an optional command line I discovered that it allows to automatically dump any process displaying a message box with an error message in its window title. Here is an example using TestDefaultDebugger64 to simulate an application fault message where the following instance of CtxHideEx32 was setup to dump a process showing WER dialog on Vista:
CtxHideEx32.exe NONE "*Microsoft Windows" "" "C:\kktools\userdump8.1\x64\userdump.exe %d"
We click on a big lightning button:
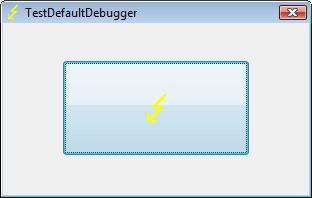
and then WER dialog appears:
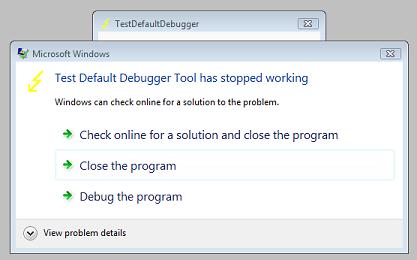
Immediately CtxHideEx32 kicks in and starts dumping the owner process incessantly so you better to dismiss this dialog by choosing something:
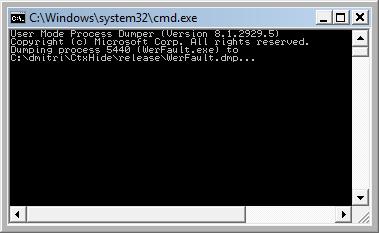
We see it was WerFault.exe.
Note: I think I have to amend CtxHideEx32 to make it wait until the spawned command line interpreter finishes its job. Stay tuned.
- Dmitry Vostokov @ DumpAnalysis.org -
Posted in Announcements, Citrix, Crash Dump Analysis, Debugging, Fun with Crash Dumps, Software Technical Support, Vista, Windows Server 2008 | 1 Comment »
Wednesday, November 5th, 2008
Matthieu Suiche has released the new version of win32dd tool with the ability to save physical memory in a WinDbg-compliant memory dump file including pages that normally are not saved in a complete memory dump.
- Dmitry Vostokov @ DumpAnalysis.org -
Posted in Announcements, Crash Dump Analysis, Data Recovery, Debugging, Memory Analysis Forensics and Intelligence, Security, Software Technical Support, Tools, Vista, Windows Server 2008 | No Comments »
Friday, October 31st, 2008
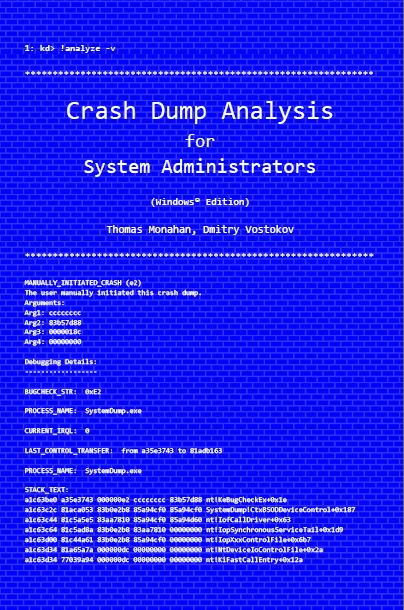
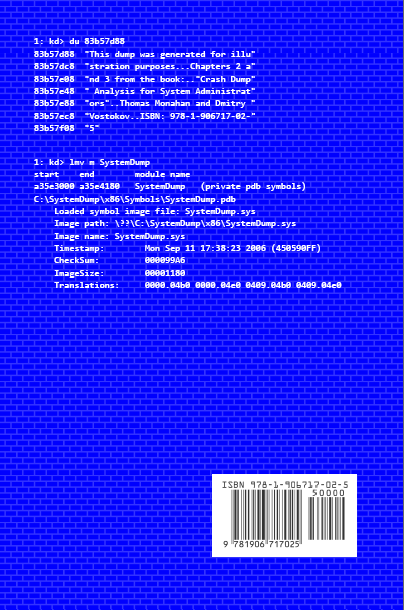
Previously announced book Crash Dump Analysis for System Administrators and Support Engineers (Windows Edition) has got its draft cover featuring WinDbg output from a kernel memory dump forced by Citrix SystemDump tool.
Front:
Back:
- Dmitry Vostokov @ DumpAnalysis.org -
Posted in Announcements, Books, Citrix, Crash Dump Analysis, Crash Dumps for Dummies, Minidump Analysis, Publishing, Security, Software Technical Support, Testing, Tools, Training and Seminars, Vista, WinDbg Tips and Tricks, Windows Server 2008 | No Comments »
Saturday, October 18th, 2008
Paperback edition of Memory Dump Analysis Anthology, Volume 2 is finally available on Amazon and Barnes & Noble. Search Inside is also available on Amazon. In addition, I updated the list of recommended books:
Listmania! Crash Dump Analysis and Debugging
Hardcover edition will be available on Amazon and B&N in 2-3 weeks.
- Dmitry Vostokov @ DumpAnalysis.org -
Posted in Announcements, Assembly Language, Books, Bugchecks Depicted, CDF Analysis Tips and Tricks, Certification, Citrix, Common Mistakes, Crash Dump Analysis, Crash Dump Patterns, Crash Dumps for Dummies, Data Recovery, DebugWare Patterns, Debugging, Fun with Crash Dumps, Hardware, Kernel Development, Memory Analysis Forensics and Intelligence, Memory Dump Analysis Jobs, Memory Visualization, Minidump Analysis, Music for Debugging, New Words, Philosophy, Publishing, Science of Memory Dump Analysis, Security, Software Architecture, Software Technical Support, Stack Trace Collection, Testing, Tools, Training and Seminars, Troubleshooting Methodology, Virtualization, Vista, WinDbg Scripts, WinDbg Tips and Tricks, WinDbg for GDB Users, Windows Server 2008 | No Comments »
Friday, October 3rd, 2008
“Everything is memory dump.”
I’m very excited to announce that Volume 2 is available in paperback, hardcover and digital editions:
Memory Dump Analysis Anthology, Volume 2
In one or two weeks paperback edition should also appear on Amazon and other bookstores. Amazon hardcover edition is planned to be available by the end of October.
I’m often asked when Volume 3 is available and I currently plan to release it in October - November, 2009. In the mean time I’m planning to concentrate on other publishing projects.
- Dmitry Vostokov @ DumpAnalysis.org -
Posted in Announcements, Assembly Language, Books, Bugchecks Depicted, CDF Analysis Tips and Tricks, Citrix, Common Mistakes, Crash Dump Analysis, Crash Dump Patterns, Crash Dumps for Dummies, Data Recovery, DebugWare Patterns, Debugging, Fun with Crash Dumps, Kernel Development, Memory Analysis Forensics and Intelligence, Memory Dump Analysis Jobs, Memory Visualization, Minidump Analysis, Music for Debugging, New Words, Philosophy, Publishing, Science of Memory Dump Analysis, Security, Software Architecture, Software Technical Support, Stack Trace Collection, Testing, Tools, Training and Seminars, Troubleshooting Methodology, Virtualization, Vista, WinDbg Scripts, WinDbg Tips and Tricks, WinDbg for GDB Users, Windows Server 2008 | No Comments »
Wednesday, October 1st, 2008
The book is nearly finished and here is the final TOC:
Memory Dump Analysis Anthology, Volume 2: Table of Contents
- Dmitry Vostokov @ DumpAnalysis.org -
Posted in Announcements, Assembly Language, Books, Bugchecks Depicted, CDF Analysis Tips and Tricks, Citrix, Common Mistakes, Crash Dump Analysis, Crash Dump Patterns, Crash Dumps for Dummies, Data Recovery, DebugWare Patterns, Debugging, Fun with Crash Dumps, Kernel Development, Memory Dump Analysis Jobs, Memory Visualization, Minidump Analysis, Music for Debugging, Publishing, Science of Memory Dump Analysis, Security, Software Technical Support, Stack Trace Collection, Tools, Troubleshooting Methodology, Virtualization, Vista, WinDbg Scripts, WinDbg Tips and Tricks, WinDbg for GDB Users, Windows Server 2008 | No Comments »