Archive for the ‘Trace Analysis Patterns’ Category
Sunday, October 18th, 2015
Sometimes we need to know about client-server interaction between components, threads, or processes in order to find out where the problem started. For example, if we have Error Message or Discontinuity in one PID Adjoint Thread of Activity, and we know that that process uses API from another PID, we can look at the latter PID Adjoint Thread to see if there are any Error Messages or other problems. The failure in the server can propagate to the client as illustrated in the following diagram:
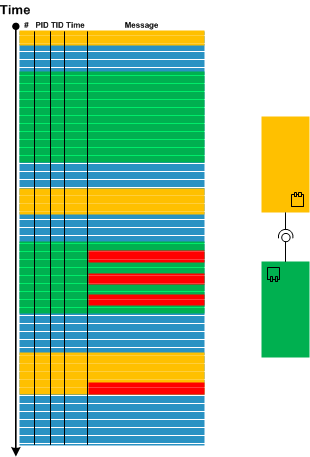
We call this pattern Coupled Activities similar to Coupled Processes memory analysis pattern. It can help in Intra- and Inter-Correlation analysis, for example in choosing adjoint threads from Sheaf of Activities.
- Dmitry Vostokov @ DumpAnalysis.org + TraceAnalysis.org -
Posted in Crash Dump Patterns, Software Trace Analysis, Trace Analysis Patterns, Tracing and Design Patterns | No Comments »
Monday, October 12th, 2015
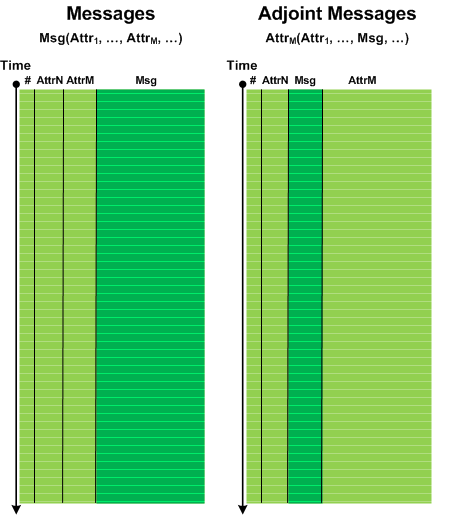
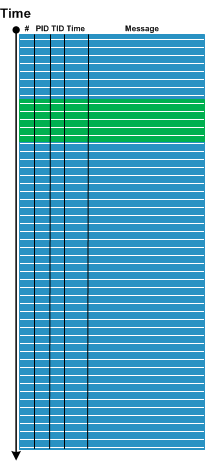
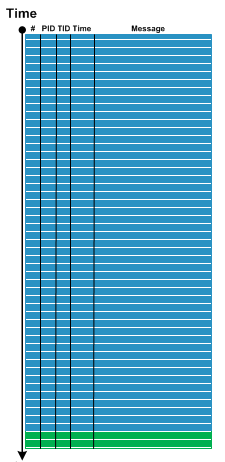
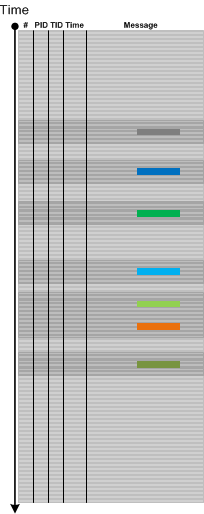
By analogy with Adjoint Thread of Activity we introduce Adjoint Message analysis pattern. Most if not all analysis patterns focus on log message text and consider TID, PID, Module, source file and function as its attributes. However, we can choose one of attributes and consider it as a message in its own right with the original message text consigned now as another attribute. Then we can analyze the structure of the trace from the perspective of that newly selected message:
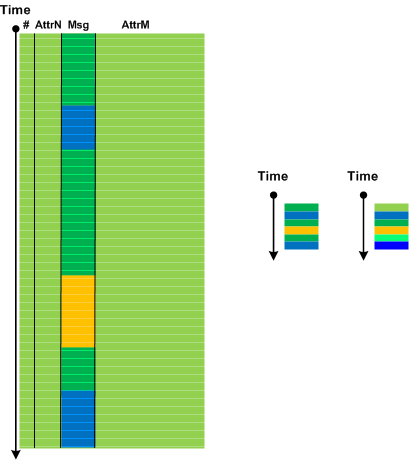
Since the number of different message values now is smaller (for example, module names) compared to normal trace messages we can use them in protein-like encoding and structure analysis schemes (see Software Trace and Logs as Proteins). We metaphorically name Adjoint Messages as Amino-acid-Messages (A-Messages). We can also compress same message sequences into one message which may be useful for pattern matching (and even use different color intensities to represent message cardinalities):
- Dmitry Vostokov @ DumpAnalysis.org + TraceAnalysis.org -
Posted in Software Trace Analysis, Software Trace Analysis and Proteomics, Software Trace Reading, Software Trace Visualization, Trace Analysis Patterns | No Comments »
Wednesday, September 30th, 2015
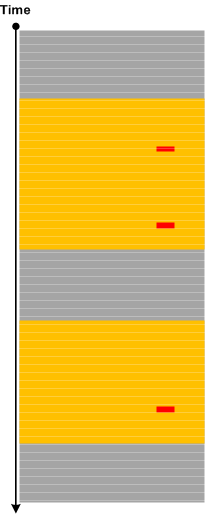
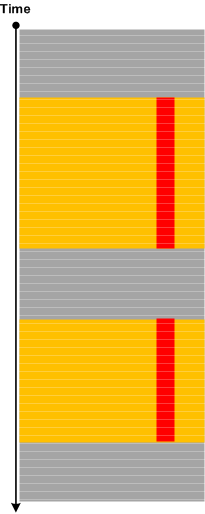
Sometimes we have Periodic Message Blocks of a few adjacent messages, for example, when flags are translated into separate messages per bit. Then we may have a pattern of Sequence Repeat Anomaly when one of several message blocks have missing or added messages compared to the more numerous number of expected identical message blocks. Then Missing Message Message Context may be explored further. The following diagram illustrates the pattern:
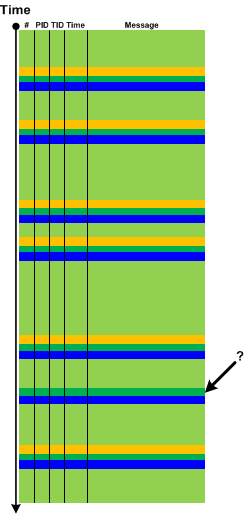
The name of the pattern comes from the notion of repeated DNA sequences.
- Dmitry Vostokov @ DumpAnalysis.org + TraceAnalysis.org -
Posted in CDF Analysis Tips and Tricks, Log Analysis, Software Trace Analysis, Software Trace Analysis and Genetics, Software Trace Analysis and Genomics, Software Trace Reading, Trace Analysis Patterns | No Comments »
Saturday, September 12th, 2015
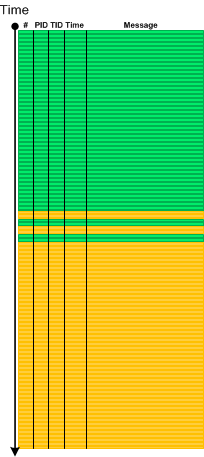
Recently we analyzed a few logs which ended with a specialized Activity Region from a subsystem that sets operational parameters. The problem description stated that the system became unresponsive after changing parameters in a certain sequence. Usually, for that system, when we stop logging (even after setting parameters) we end up with messages from some Background Components since some time passes between the end of setting parameters activity and the time the operator sends stop logging request:
However, in the problem case we see message flow stops right in the middle of parameter setting activity:
So we advised to check for any crashes or hangs, and, indeed, it was found that the system was actually experiencing system crashes, and we got memory dumps for analysis where we found Top Module from a 3rd-party vendor related to parameter setting activity.
Please also note an analogy here between normal thread stack traces from threads that are waiting most of the time and Spiking Thread stack trace caught up in the middle of some function.
We call this pattern Ruptured Trace after a ruptured computation.
Note, that if it is possible to restart the system and resume the same tracing we may get an instance of Blackout analysis pattern.
- Dmitry Vostokov @ DumpAnalysis.org + TraceAnalysis.org -
Posted in Core Dump Analysis, Crash Dump Analysis, Crash Dump Patterns, Log Analysis, Software Trace Analysis, Software Trace Analysis Tips and Tricks, Trace Analysis Patterns | No Comments »
Thursday, July 9th, 2015
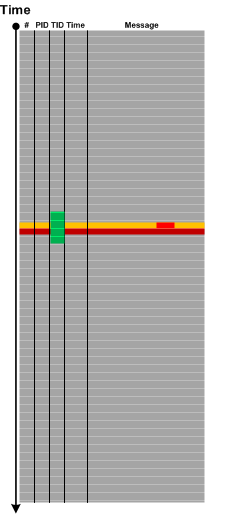
Sometimes a few Error Messages or Periodic Errors with low Statement Density for specific Activity Regions or Adjoint Threads of Activity (for specific component, file or function) may constitute Activity Disruption. If the particular functionality was no longer available at the logging time then its unavailability may not be explained by such disruptions, and such messages may be considered False Positive Errors in relation to the reported problem:
But, if we have Periodic Message Blocks containing only Periodic Errors, Activity Region or Adjoint Thread Discontinuity, or simply No Activity, then we may have the complete cease of activity that may correlate with the unavailable functionality:
- Dmitry Vostokov @ DumpAnalysis.org + TraceAnalysis.org -
Posted in Log Analysis, Software Trace Analysis, Trace Analysis Patterns | No Comments »
Monday, July 6th, 2015
Sometimes we have messages that report about error but do not give exact details. For example, “Communication error. Problem at the server side” or “Access denied error”. This may be the case of Translated Messages. Such messages are plain language descriptions or reinterpretations of flags, error and status codes contained in another log message. These descriptions may be coming from system API, for example, FormatMessage from Windows API, or may be from custom formatting code. Since the code translating the message is in close proximity to the original message both messages usually follow each other with zero or very small Time Delta, come from the same component, file, function, and belong to the same Thread of Activity:
This pattern is different from Gossip because the latter messages come from different modules, and, although they reflect some underlying event, they are independent from each.
- Dmitry Vostokov @ DumpAnalysis.org + TraceAnalysis.org -
Posted in CDF Analysis Tips and Tricks, Software Trace Analysis, Software Trace Reading, Trace Analysis Patterns | No Comments »
Tuesday, June 30th, 2015
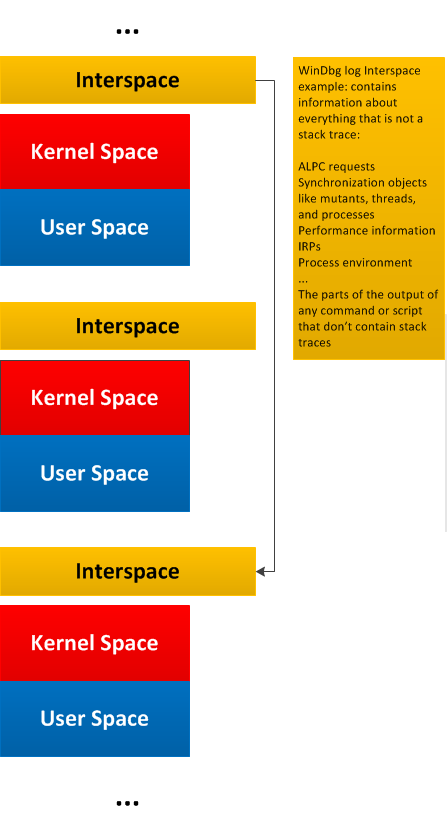
General traces and logs may have Message Space regions “surrounded” by the so-called Interspace. Such Interspace regions may link individual Message Space regions like in this diagram generalizing WinDbg !process 0 3f command output:
- Dmitry Vostokov @ DumpAnalysis.org + TraceAnalysis.org -
Posted in Debugging, Log Analysis, Software Trace Analysis, Software Trace Reading, Software Trace Visualization, Trace Analysis Patterns | No Comments »
Monday, June 29th, 2015
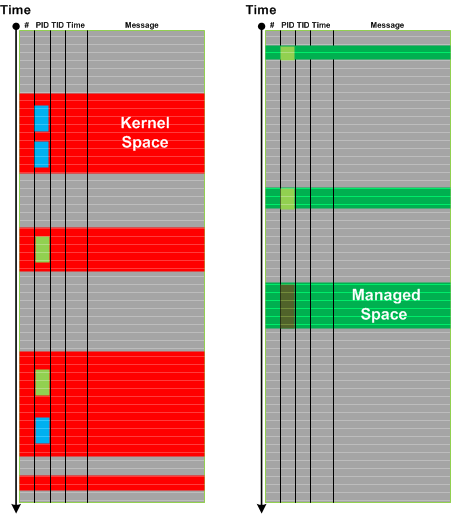
Message stream can be considered as a union of Message Spaces. A message space is an ordered set of messages preserving the structure of the overall trace. Such messages may be selected based on a memory space they came from or can be selected by some other general attribute, or a combination of attributes and facts. The differences from Message Set is that Message Space is usually much larger (with large scale structure) with various Message Sets extracted from it later for fine grained analysis. This pattern also fits nicely with Adjoint Spaces. Here’s an example of kernel and managed spaces in the same CDF / ETW trace from Windows platform where we see that kernel space messages came not only from System process but also from other process contexts:
In the context of general traces and logs such as debugger logs separate Message Space regions may be linked (or “surrounded”) by Interspace.
- Dmitry Vostokov @ DumpAnalysis.org + TraceAnalysis.org -
Posted in CDF Analysis Tips and Tricks, Software Trace Analysis, Software Trace Reading, Software Trace Visualization, Structural Trace Patterns, Trace Analysis Patterns | No Comments »
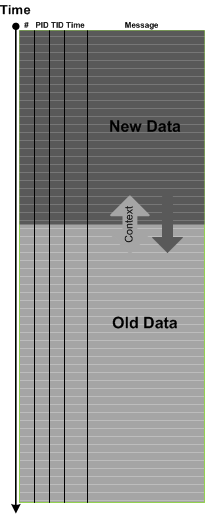
Wednesday, May 13th, 2015
Palimpsest Messages are messages where some part or all of their content was erased or overwritten.
The name of this pattern comes from palimpsest manuscript scrolls. Such messages may be a part of malnarratives or result from Circular Tracing or trace buffer corruption. Sometimes, not all relevant data is erased and by using Intra- and Inter-Correlation, and via the analysis of Message Invariants it is possible to recover the original data. Also, as in Recovered Messages pattern it may be possible to use Message Context to infer some partial content.
- Dmitry Vostokov @ DumpAnalysis.org + TraceAnalysis.org -
Posted in Malnarratives, Malware Analysis, Software Trace Analysis, Trace Analysis Patterns, Trace and Log Forensics | No Comments »
Sunday, May 3rd, 2015
If you analyze ETW-based traces such as CDF you may frequently encounter No Trace Metafile pattern especially after product updates and fixes. This complicates pattern analysis because we may not be able to see Significant Events, Anchor Messages, and Error Messages. In some cases we can recover messages by comparing Message Context for unknown messages. If we have source code access this may also help. Both approaches are illustrated in the following diagram:
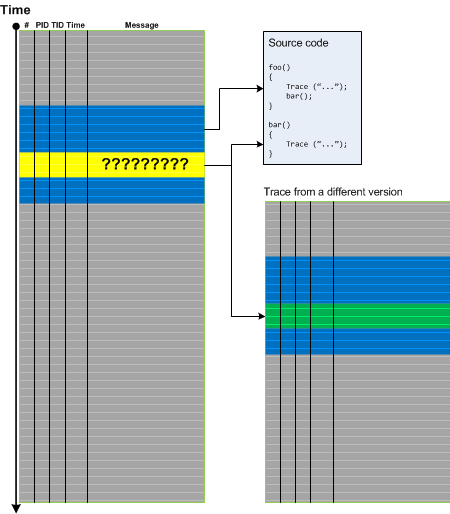
The same approach may also be applied for a different kind of trace artifacts when some messages are corrupt. In such cases it is possible to recover diagnostic evidence and, therefore, we call this pattern Recovered Messages.
- Dmitry Vostokov @ DumpAnalysis.org + TraceAnalysis.org -
Posted in CDF Analysis Tips and Tricks, Software Trace Analysis, Software Trace Analysis Tips and Tricks, Software Trace Reading, Trace Analysis Patterns | No Comments »
Tuesday, April 28th, 2015
Sometimes we notice that data values are in a different order than expected. We call this pattern Data Reversal. By data values we mean some variable parts of a specific repeated message such the address of some structure or object. Data Reversal may happen for one message type:
But it can also happen for some message types and not for others. Typical example here are Enter/Leave trace messages for nested synchronization objects such as monitors and critical sections:
Since we talk about the same message type (the same Message Invariant) this pattern is different from Event Sequence Order pattern.
In rare cases we may observe Data Reversal inside one message with several variable parts but this may also be a case of Data Association.
- Dmitry Vostokov @ DumpAnalysis.org + TraceAnalysis.org -
Posted in Debugging, Software Trace Analysis, Trace Analysis Patterns | No Comments »
Thursday, April 23rd, 2015
Reading Boris Uspensky’s book “A Poetics of Composition: The Structure of the Artistic Text and Typology of a Compositional Form” (in its original Russian version) led me to borrow the concept of viewpoints. The resulting analysis pattern is called Trace Viewpoints. These viewpoints are, “subjective” (semantically laden from the perspective of a trace and log reader), and can be (not limited to):
- Error viewpoints (see also False Positive Error, Periodic Error, and Error Distribution)
- Use case (functional) viewpoints (see also Use Case Trail)
- Architectural (design) viewpoints (see also Milestones)
- Implementation viewpoints (see also Implementation Discourse, Macrofunctions, and Focus of Tracing)
- Non-functional viewpoints (see also Counter Value and Diegetic Messages)
- Signal / noise viewpoints (see also Background and Foreground Components)
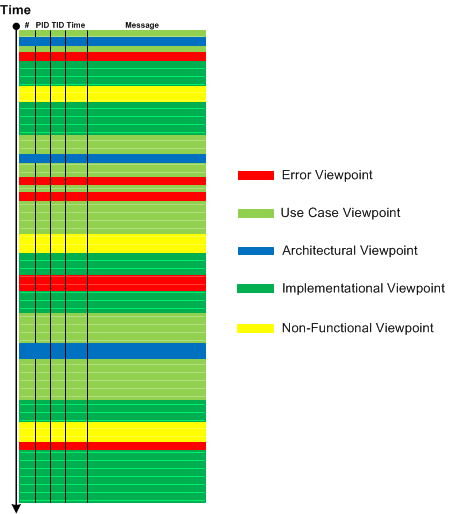
In comparison, Activity Regions, Data Flow, Thread of Activity, and Adjoint Thread of Activity are “objective” (structural, syntactical) viewpoints.
- Dmitry Vostokov @ DumpAnalysis.org + TraceAnalysis.org -
Posted in Software Narratology, Software Trace Analysis, Software Trace Reading, Software Trace Visualization, Trace Analysis Patterns | No Comments »
Tuesday, March 17th, 2015
Trace Mask is a superposition of two (or many) different traces. This is different from Inter-Correlation pattern where we may only search for certain messages without the synthesis of a new log. The most useful Trace Mask is when we have different time scales (or significantly different Trace Currents). Then we impose an additional structure on the one of the traces:
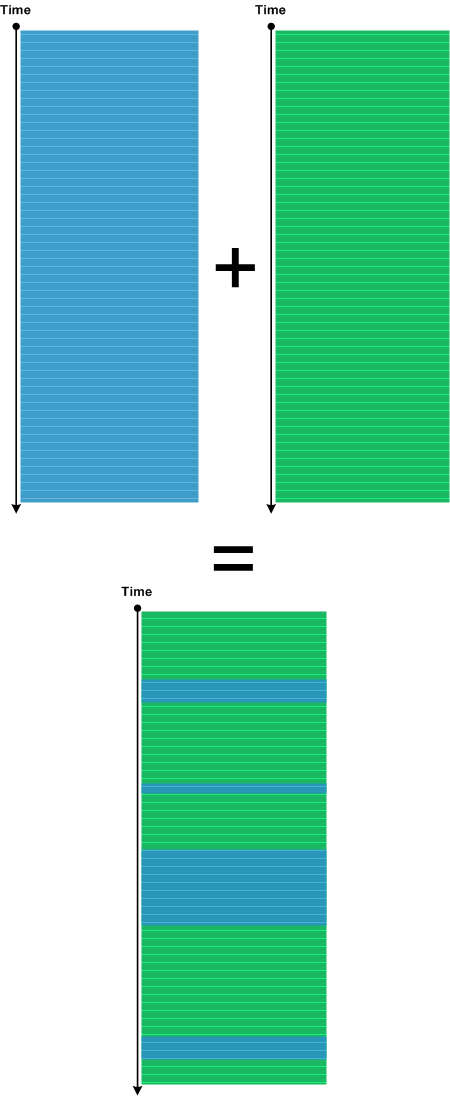
We got the idea from Narrative Masks discussed in Miroslav Drozda’s book “Narativní masky ruské prózy” (”Narrative Masks in Russian Prose”).
The very simple example of Trace Mask is shown in Debugging TV Episode 0×15.
- Dmitry Vostokov @ DumpAnalysis.org + TraceAnalysis.org -
Posted in Software Narrative Fiction, Software Narratology, Software Trace Analysis, Software Trace Reading, Trace Analysis Patterns | 1 Comment »
Saturday, March 14th, 2015
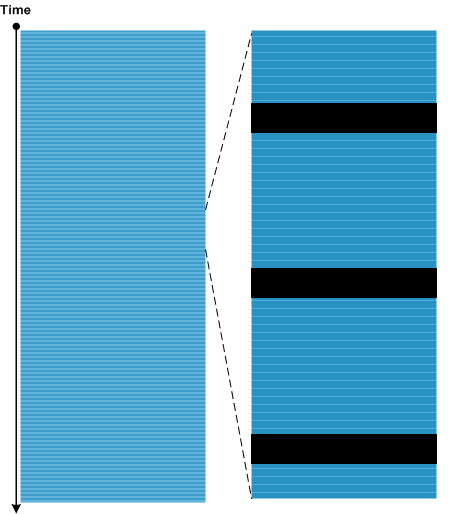
Sometimes we have a uniform stream of messages that belong to some Activity Region, Thread of Activity, or Adjoint Thread of Activity. We can use micro-Discontinuities to structure that message stream into groups of actions, for example, Macrofunctions, especially if semantics of trace messages is not yet fully clear to us. This may also help us to recognize Visitor trace. Originally we wanted to call this pattern Micro Delays, but, after recognizing that such delays only make sense for one activity (since there can be too many of them in the overall log), we named this pattern Punctuated Activity. Usually such delays are small compare to Timeouts and belong to Silent Messages.
- Dmitry Vostokov @ DumpAnalysis.org + TraceAnalysis.org -
Posted in CDF Analysis Tips and Tricks, Software Trace Analysis, Software Trace Analysis Tips and Tricks, Software Trace Reading, Trace Analysis Patterns | No Comments »
Tuesday, March 3rd, 2015
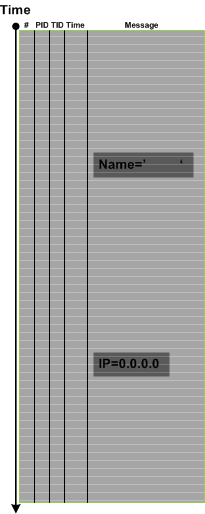
When we do tracing and logging much of computational activity is not visible. For live tracing and debugging this can be alleviated by adding Watch Threads. These are selected memory locations that may or may not be formatted according to specific data structures and are inspected at each main trace message occurrence or after specific intervals or events:
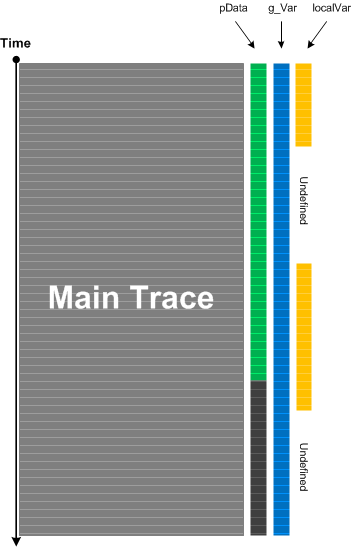
This analysis pattern is different from State Dump which is about intrinsic tracing where the developer of logging statements already incorporated variable watch in source code. Watch Threads are completely independent from original tracing and may be added independently. Counter Value is the simplest example of Watch Thread if done externally because the former usually doesn’t require source code and often means some OS or module variable independent of product internals. Watch Thread is also similar to Data Flow pattern where specific data we are interested in is a part of every trace message.
- Dmitry Vostokov @ DumpAnalysis.org + TraceAnalysis.org -
Posted in Debugging, Log Analysis, Performance Monitoring, Software Narratology, Software Trace Analysis, Trace Analysis Patterns | No Comments »
Sunday, February 22nd, 2015
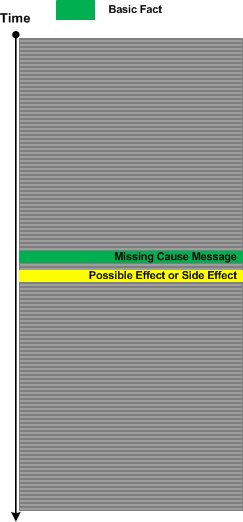
Sometimes we have Basic Facts in a problem description but can’t find messages corresponding to them in a trace or log file but we are sure the tracing (logging) was done correctly. This may be because we have Sparse Trace, or we are not familiar well with product or system tracing messages (such as with Implementation Discourse).
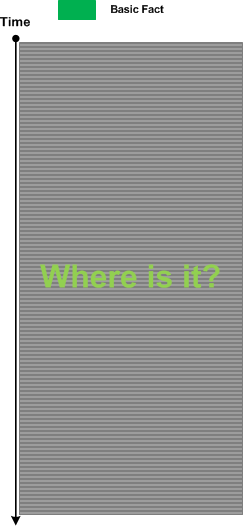
In such a case we for search for Indirect Message of a possible cause:
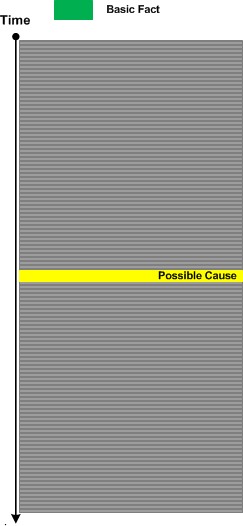
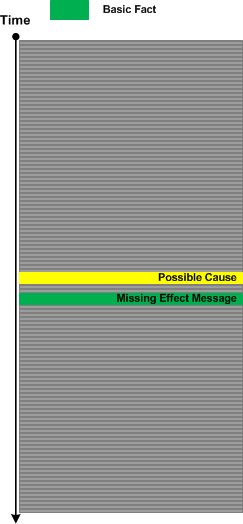
Having found such a message we may hypothesize that Missing Message should have located nearby (this is based on semantics of both messages), and we then explore corresponding Message Context:
The same analysis strategy is possible for missing causal messages. Here we search for effect or side effect messages:
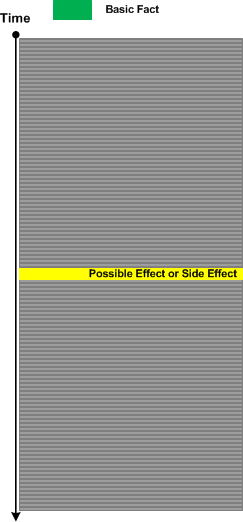
Having found them we proceed with further analysis:
- Dmitry Vostokov @ DumpAnalysis.org + TraceAnalysis.org -
Posted in CDF Analysis Tips and Tricks, Log Analysis, Software Trace Analysis, Software Trace Analysis Tips and Tricks, Trace Analysis Patterns | No Comments »
Saturday, January 31st, 2015
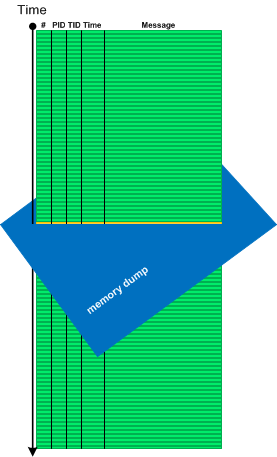
Sometimes we need memory reference information not available in software traces and logs, for example, to see pointer dereferences, to follow pointers and linked structures. In such cases memory dumps saved during logging sessions may help. In case of process memory dumps we can even have several Step Dumps. Complete and kernel memory dumps may be forced after saving a log file. We call such pattern Adjoint Space:
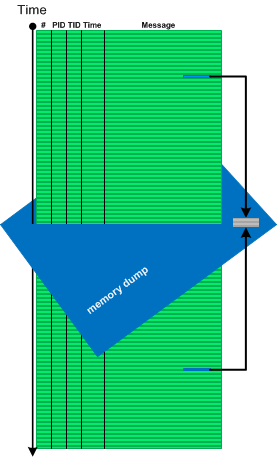
Then we can analyze logs and memory dumps together, for example, to follow pointer data further in memory space:
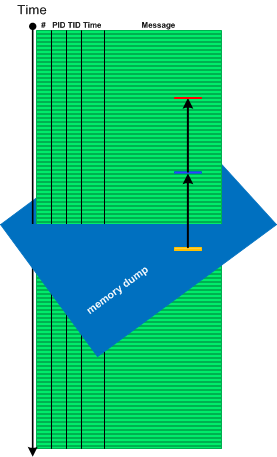
There is also a reverse situation when we use logs to see past data changes before memory snapshot time (Paratext memory analysis pattern):
- Dmitry Vostokov @ DumpAnalysis.org + TraceAnalysis.org -
Posted in CDF Analysis Tips and Tricks, Core Dump Analysis, Crash Dump Analysis, Crash Dump Patterns, Debugging, Log Analysis, Software Trace Analysis, Software Trace Analysis Tips and Tricks, Software Trace Reading, Trace Analysis Patterns | No Comments »
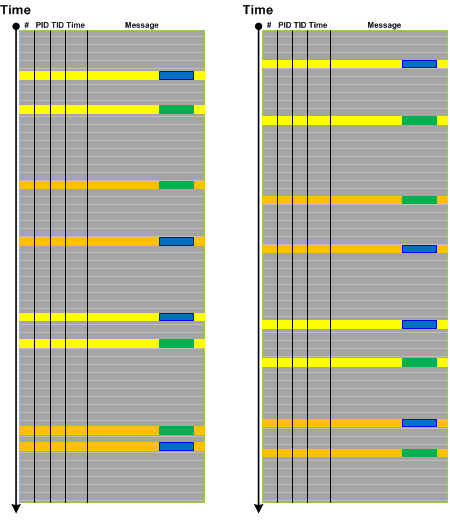
Saturday, January 24th, 2015
Sometimes specific parts of simultaneous Use Case Trails, blocks of Significant Events or Message Sets in general may overlap. This may point to possible synchronization problems such as race conditions (prognostics) or be visible root causes of them if such problems are reported (diagnostics). We call this pattern Activity Overlap:
For example, a first request may start a new session and we expect the second request to be processed by the same already established session:
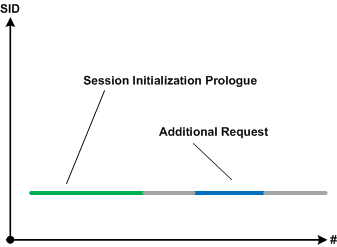
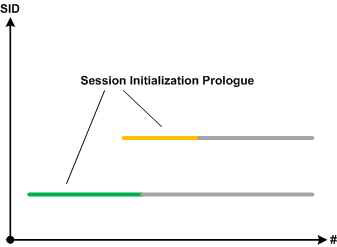
However, users report the second session started upon the second request. If we filter execution log by session id and do Intra-Correlational analysis we find out that session initialization prologues are overlapped. The new session started because the first session initialization was not completed:
- Dmitry Vostokov @ DumpAnalysis.org + TraceAnalysis.org -
Posted in CDF Analysis Tips and Tricks, Debugging, Log Analysis, Software Prognostics, Software Trace Analysis, Trace Analysis Patterns | No Comments »
Wednesday, January 7th, 2015
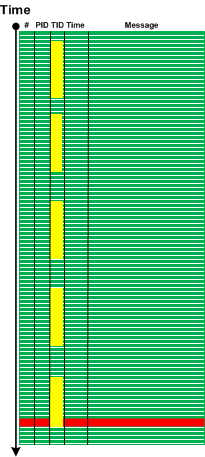
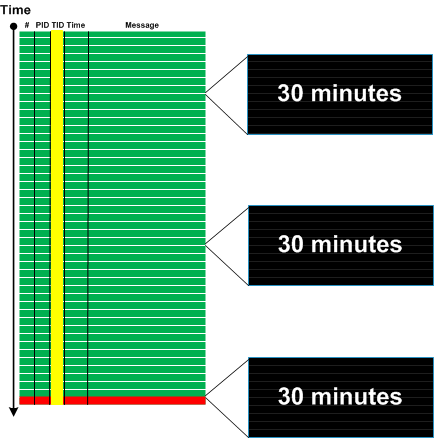
Some Discontinuities may be Periodic as Silent Messages. If such discontinuities belong to the same Thread of Activity and their Time Deltas are constant we may see Timeout pattern. When timeouts are followed by Error Message we can identify them by back tracing. Timeouts are different from Blackouts where the latter are usually Singleton Events and have large time deltas.
Here is a generalized graphical case study. An error message was identified based on incident Basic Facts:
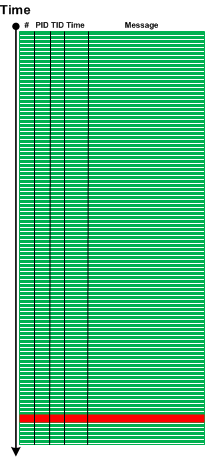
We filtered the trace for error message TID and found 3 timeouts 30 minutes each:
- Dmitry Vostokov @ DumpAnalysis.org + TraceAnalysis.org -
Posted in Debugging, Log Analysis, Software Trace Analysis, Trace Analysis Patterns | No Comments »
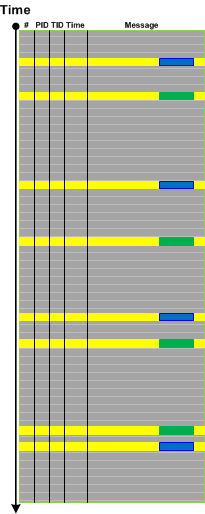
Saturday, November 29th, 2014
Some traces and logs may have Periodic Message Blocks with very similar message structure and content (mostly Message Invariants). The only significant difference between them is some unique data. We call such pattern Visitor Trace by analogy with Visitor design pattern where tracing code “visits” each object data or data part to log its content or status.
- Dmitry Vostokov @ DumpAnalysis.org + TraceAnalysis.org -
Posted in Log Analysis, Software Engineering, Software Trace Analysis, Software Trace Reading, Trace Analysis Patterns, Tracing and Design Patterns | No Comments »