Archive for the ‘Software Trace Analysis’ Category
Tuesday, July 16th, 2019
Cartesian Trace analysis pattern has its analogical roots in Cartesian product. It covers a case where we have a long trace and a few Small DA+TA configuration traces (files). The former trace messages are associated with the latter messages (content or content changes) as depicted in the following diagram:
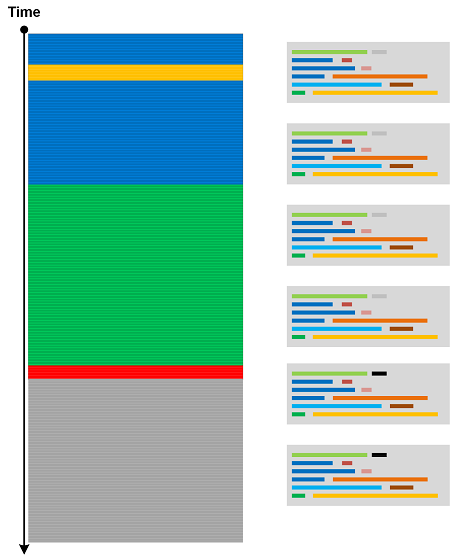
Think about a rectangle as a product of two line fragments or a cylinder as a product of a circle and a line fragment. Both traces are completely independent in comparison to Fiber Bundle, Trace Presheaf, or Trace Extension.
- Dmitry Vostokov @ DumpAnalysis.org + TraceAnalysis.org -
Posted in Log Analysis, Mathematics of Debugging, Software Trace Analysis, Trace Analysis Patterns | No Comments »
Sunday, July 14th, 2019
Some trace and log messages may have different grammatical structure and content but similar semantics. Therefore, we can create a table listing equivalent messages (using some equivalence relation) and use it to construct simpler traces and logs as depicted in this picture:

One trivial example of Equivalent Messages analysis pattern is Quotient Trace. Another example is Inter-Correlational analysis of logs that have different structure and format. In such a case Equivalent Messages simplify the analysis of higher Trace Dimensions.
- Dmitry Vostokov @ DumpAnalysis.org + TraceAnalysis.org -
Posted in Log Analysis, Mathematics of Debugging, Software Trace Analysis, Trace Analysis Patterns, Trace Analysis and Topology | No Comments »
Wednesday, July 10th, 2019
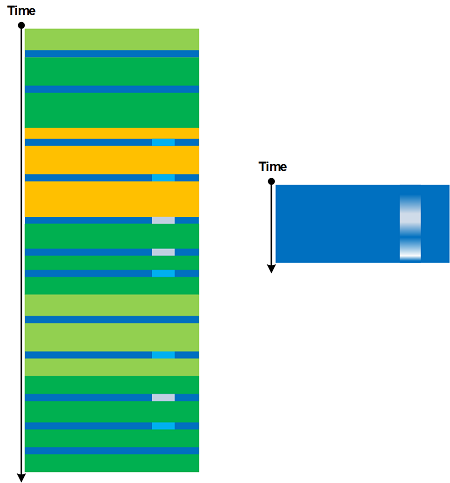
Log message “frequencies” in time domain (Statement Current part) are addressed by Fourier Activity analysis pattern. However, we may have varying message density (Statement Density part) across different trace runs (space domain, irrespective of time irregularities):
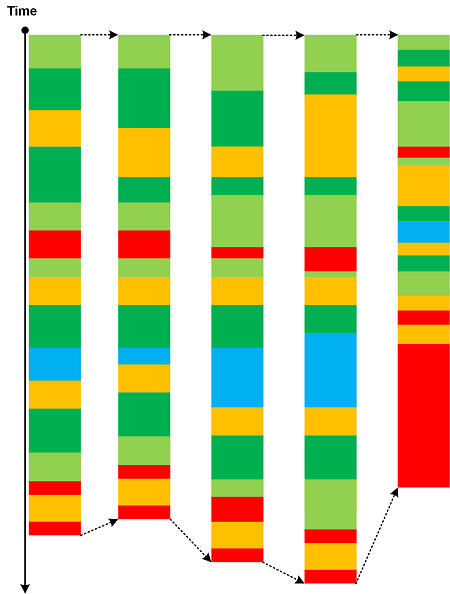
According to OED, in computing and mathematics a string means “a linear sequence of records or data” and “a sequence of symbols or linguistic elements in a definite order”. So we propose to name this pattern that analyzes densities of messages or Activity Regions as Trace String. Such longitudinal “vibrations” can be compared and analyzed for anomalies across different log runs (Inter-Correlation) or across similar regions in the same log (Intra-Correlation). Here we consider message density change as a one-dimensional displacement. The analogy for this pattern came from one-dimensional vibrating strings (dual resonance model from 1969-70 by Nambu, Nielsen, and Leonard Susskind).
- Dmitry Vostokov @ DumpAnalysis.org + TraceAnalysis.org -
Posted in Log Analysis, Software Trace Analysis, Trace Analysis Patterns, Trace Analysis and Physics | No Comments »
Monday, May 27th, 2019
The advent of virtualization simplified the debugging of complex issues by allowing to save the snapshot of the execution environment and then resume it from the save point of execution. This allows continuing tracing using a different set of environmental conditions and input data. New tracing continuations constitute a network that we call Polytrace:
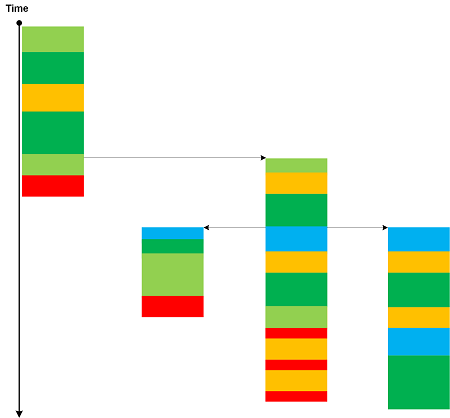
Bifurcation Point for two identical trace beginnings may be considered as an example of a simple Polytrace.
- Dmitry Vostokov @ DumpAnalysis.org + TraceAnalysis.org -
Posted in Log Analysis, Software Trace Analysis, Trace Analysis Patterns, Virtualization | 1 Comment »
Monday, May 6th, 2019
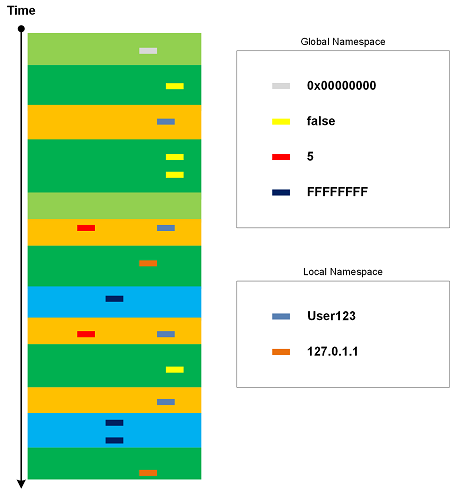
Every trace and log has its own set of constants, values that belong to global namespace such as true/false, NULL, Abnormal Values, and common error constants such as “access denied”. Trace Constants may be dependent upon Implementation Discourse. There are also constant values that are local to each trace, for example, user names and IP addresses. They may be constantly repeated in one log but may change for another log. Constants that belong to local namespace may be a part of Vocabulary Index and Basic Facts. Usually Trace Constant is not considered Message Invariant.
- Dmitry Vostokov @ DumpAnalysis.org + TraceAnalysis.org -
Posted in Log Analysis, Software Trace Analysis, Trace Analysis Patterns | No Comments »
Sunday, April 7th, 2019
If we run software with its default configuration and no interaction (input data) we get its Minimal Trace:
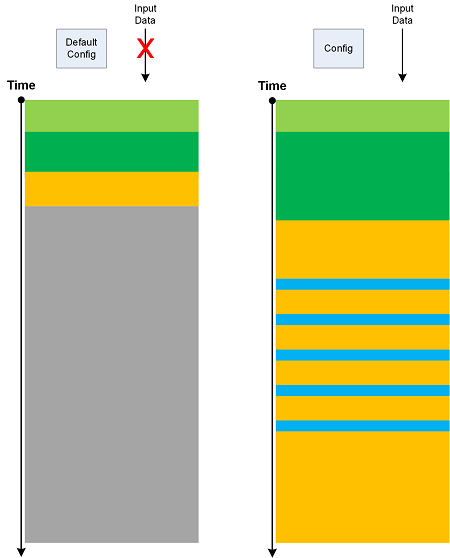
Such traces may have their own Master Trace. Also, Minimal Trace is a specific Use Case Trail. Metaphorically, they can be considered as minimal surfaces.
- Dmitry Vostokov @ DumpAnalysis.org + TraceAnalysis.org -
Posted in Log Analysis, Mathematics of Debugging, Software Trace Analysis, Trace Analysis Patterns, Trace Analysis and Geometry | No Comments »
Sunday, March 31st, 2019
Sometimes we see a constantly repeated message throughout a trace or log (a trivial Periodic Message Block) with constant Time Delta. In certain trace forms (without explicit timing information) such messages may indicate internal time references as illustrated in the following diagram:
We name this pattern Drone Message based on analogy with Drone effect in music.
- Dmitry Vostokov @ DumpAnalysis.org + TraceAnalysis.org -
Posted in Log Analysis, Software Trace Analysis, Trace Analysis Patterns, Trace Analysis and Music | No Comments »
Tuesday, March 26th, 2019
Based on a mathematical analogy with critical points in topology (Morse theory) we introduce Critical Points in trace and log analysis where they signify the change of trace or log “shape” (topological or “geometric” properties) as illustrated in the following diagram:
Such a point may be an individual message, its Message Context, or Activity Region.
Critical Points are examples of Intra-Correlation whereas Bifurcation Points are examples of Inter-Correlation.
- Dmitry Vostokov @ DumpAnalysis.org + TraceAnalysis.org -
Posted in Log Analysis, Mathematics of Debugging, Software Trace Analysis, Trace Analysis Patterns, Trace Analysis and Topology | No Comments »
Saturday, November 17th, 2018
Sometimes we put trace statements to track responses to certain environmental actions and conditions but surprised to see them in logs when nothing happened outside that could have triggered them:
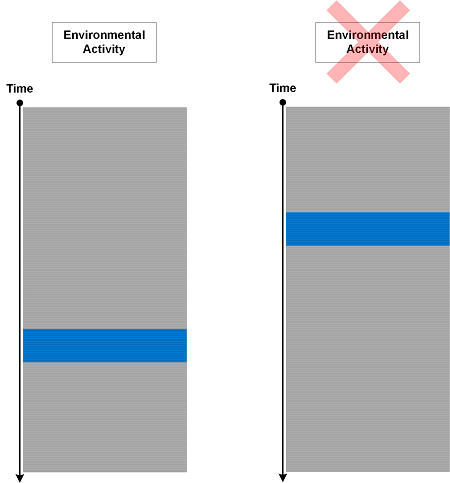
We call such an analysis pattern Phantom Activity. This is an indicator that internal program state was not updated correctly. The difference between such activities and Defamiliarizing Effect is that the former messages are expected but not in their current Message Context.
- Dmitry Vostokov @ DumpAnalysis.org + TraceAnalysis.org -
Posted in Debugging, Log Analysis, Software Trace Analysis, Trace Analysis Patterns | No Comments »
Sunday, October 14th, 2018
When we have very large traces (including Split Traces) we can use the concept of sharding to split a log into several shards for parallel processing. However, some patterns may require the analysis across the boundary of shards. Trace Sharding is illustrated in the following diagram:
- Dmitry Vostokov @ DumpAnalysis.org + TraceAnalysis.org -
Posted in Log Analysis, Software Trace Analysis, Trace Analysis Patterns | No Comments »
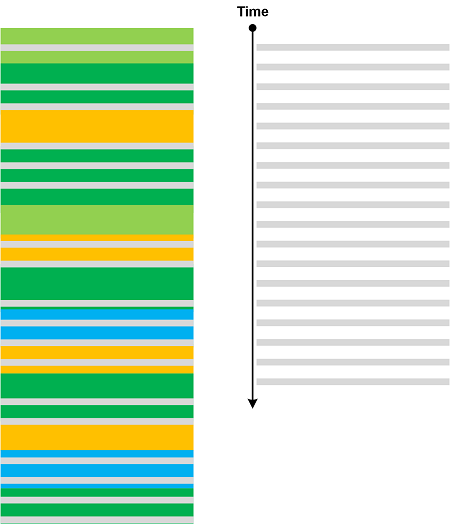
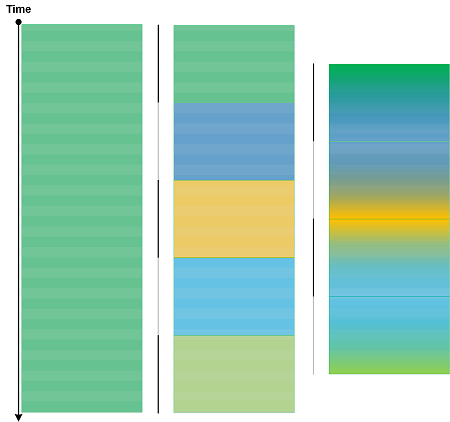
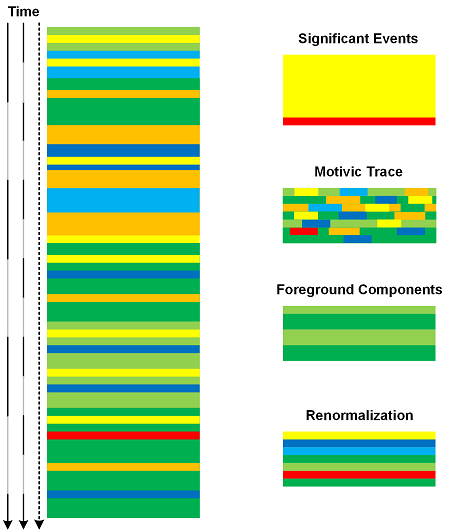
Saturday, October 13th, 2018
A software trace or log can be analyzed using different Time Scales. The coarser the scale the more messages are included in time intervals. Such per interval Message Sets can be analyzed and transformed into one message using analysis patterns such as Significant Event, Motivic Trace, Background and Foreground Components, and Renormalization. The resulted new trace will be a scaled version of the original trace as depicted in the following diagram:
- Dmitry Vostokov @ DumpAnalysis.org + TraceAnalysis.org -
Posted in Log Analysis, Software Trace Analysis, Trace Analysis Patterns | No Comments »
Sunday, October 7th, 2018
The data in individual messages and in State Dump message blocks may be truncated. This is similar to Visibility Limit at the log message level. When data values are sorted and resorted this may result in “hidden” data replacing the previously “visible” data and vice versa as shown in the following diagram:
This pattern (Truncated Data) was conceived after we observed the change of data key in sequence of a LinkedIn post (not related to firefighting) stats sorted by value and thought that was “strange”:
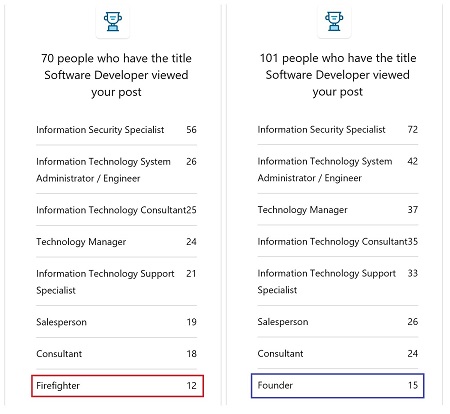
However, stats from the other post showed the both keys were valid:

- Dmitry Vostokov @ DumpAnalysis.org + TraceAnalysis.org -
Posted in Log Analysis, Software Trace Analysis, Trace Analysis Patterns | No Comments »
Saturday, September 29th, 2018
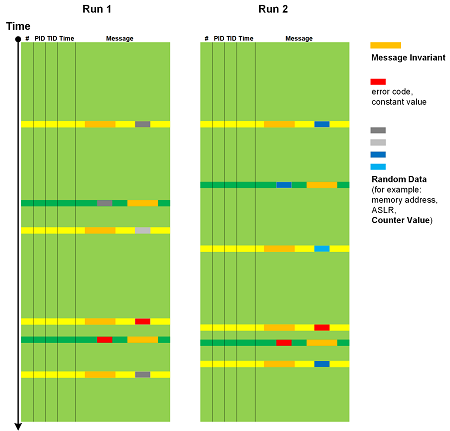
Trace and log message text usually consists of constant unchanging Message Invariants and some varying data. The latter can be classified into Random Data such as memory addresses, especially when ASLR is enabled, Counter Values, and variable data but constant in nature, such as error values and NULL pointer. Individual values from Signals are not considered random but their sequence can be. This analysis pattern is depicted in the following diagram (adopted from Data Association analysis pattern):
- Dmitry Vostokov @ DumpAnalysis.org + TraceAnalysis.org -
Posted in Log Analysis, Software Trace Analysis, Trace Analysis Patterns | No Comments »
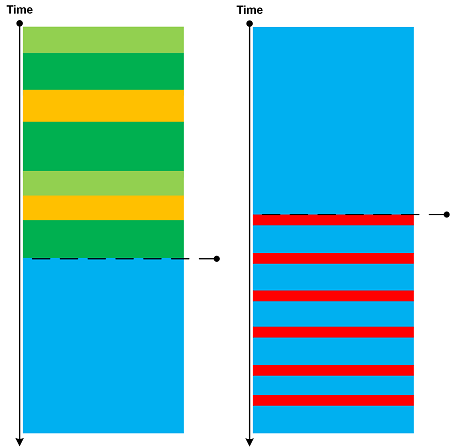
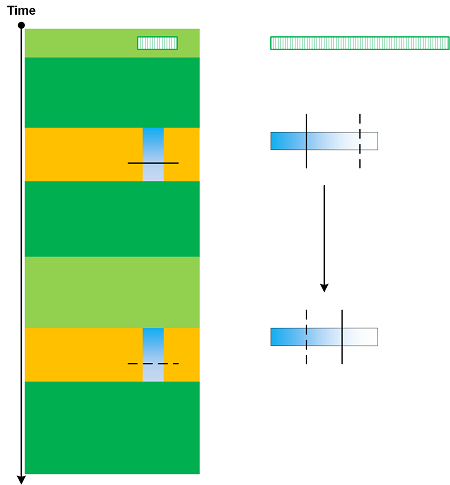
Saturday, September 22nd, 2018
Sometimes, we ask for a log file to see State and Event pattern, and see it there, only to find that we cannot do Back Trace of State Dumps from some Significant Event for Inter-Correlation analysis because our Data Interval is truncated (Truncated Trace). This highlights the importance of proper tracing intervals that we call Significant Interval analysis pattern by analogy with significant digits in scientific measurements. The following diagram illustrate the pattern:
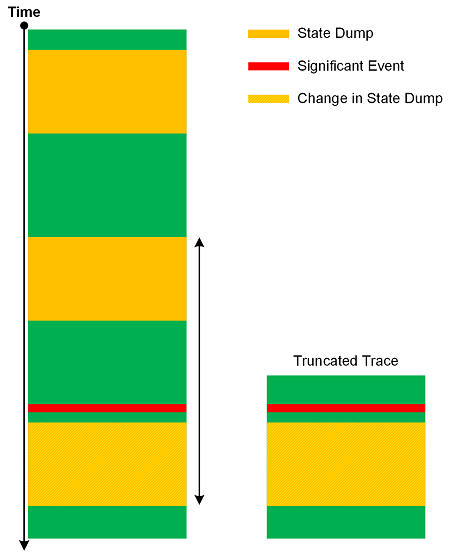
If you find out you get truncated traces and logs often you may want to increase Statement Current for state logging.
- Dmitry Vostokov @ DumpAnalysis.org + TraceAnalysis.org -
Posted in Log Analysis, Mathematics of Debugging, Software Trace Analysis, Software Trace Analysis Tips and Tricks, Software Tracing Design, Software Tracing Implementation Patterns, Trace Analysis Patterns | No Comments »
Saturday, September 8th, 2018
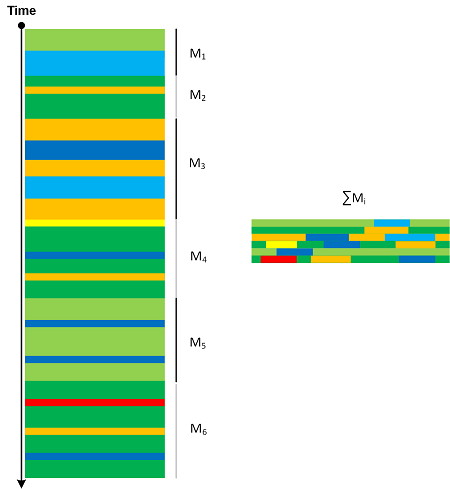
We can “integrate” trace message stream into another, smaller trace. By analogy with motivic integration in contemporary mathematics we call this analysis pattern Motivic Trace. There can be border cases where the whole trace is reduced to one message or every message is associated with a different message (perhaps shorter or a number). Message Sets that are integrated into Motivic Trace can be completely different (for example, based on Motives) in comparison with Quotient Trace where we reduce Message Sets that have the same common attribute.
- Dmitry Vostokov @ DumpAnalysis.org + TraceAnalysis.org -
Posted in Log Analysis, Mathematics of Debugging, Software Trace Analysis, Trace Analysis Patterns | 1 Comment »
Thursday, June 28th, 2018
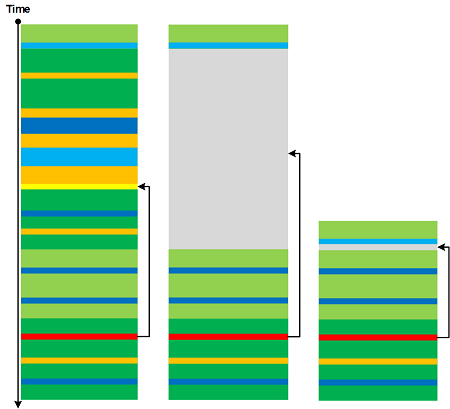
Using the metaphor of renormalization from physics we introduce Renormalization trace and log analysis pattern where a selected message and its Message Context are replaced by a single message:
- Dmitry Vostokov @ DumpAnalysis.org + TraceAnalysis.org -
Posted in Log Analysis, Software Trace Analysis, Trace Analysis Patterns, Trace Analysis and Physics | 1 Comment »
Sunday, May 13th, 2018
According to the definition in “Topological Signal Processing” by Michael Robinson (ISBN: 978-3662522844) “a signal consists of a collection of related measurements” (p. 5). For traces and logs we can apply the similar definition and consider Signal as a collection of local messages having the same Message Invariant and related variable data values. Signals are examples of Message Sets. The typical example are sets of related Counter Value messages. Signals can be obtained by obtaining Adjoint Thread of Activity of a specific message (to filter out Background Components “noise”) as illustrated in the following diagram:
Generally, the variable “measurement” part can form Braid of Activity.
We introduce Signal analysis pattern to bridge the gap between Software Narratology and Hardware Narratology.
- Dmitry Vostokov @ DumpAnalysis.org + TraceAnalysis.org -
Posted in Log Analysis, Software Narratology, Software Trace Analysis, Trace Analysis Patterns | No Comments »
Thursday, January 18th, 2018
We have analysis patterns that compare changes in software traces and logs during different executions (Master Trace) and during the evolution of software itself (Meta Trace). Such patterns are general enough, and often we are interested in their restriction to different execution paths or changes in code that leave start and end software states invariant:
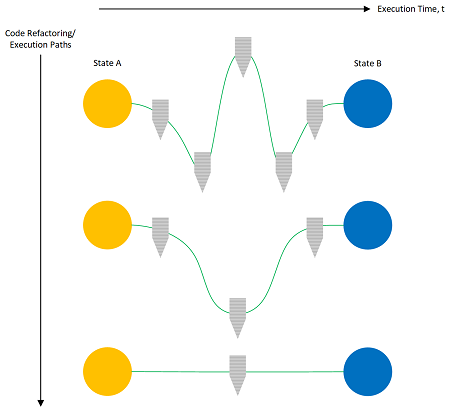
We call such analysis pattern Trace Homotopy by analogy with homotopy in mathematics where a curve or sequence of operations can vary with constant endpoints.
- Dmitry Vostokov @ DumpAnalysis.org + TraceAnalysis.org -
Posted in Log Analysis, Software Trace Analysis, Trace Analysis Patterns | No Comments »
Sunday, November 26th, 2017
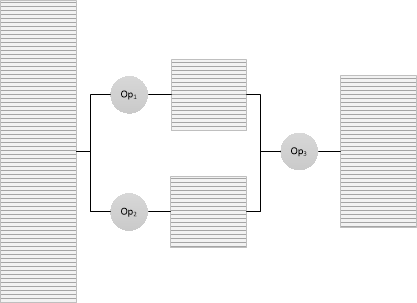
When we analyze traces and logs we work with only a small subset of log messages. We call any such current subset Working Set by analogy with working sets in operating system memory paging implementations:
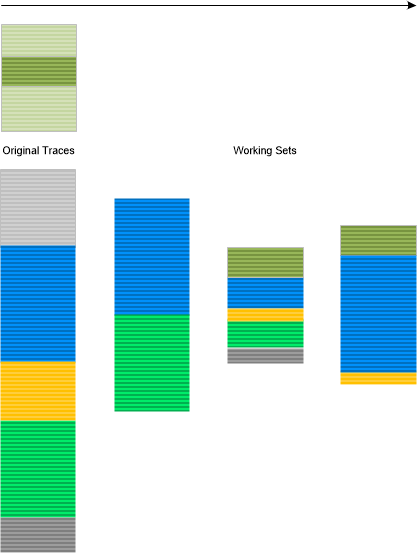
This analysis pattern can also be reconciled with an operadic approach to trace and log analysis by chaining appropriate diagnostic operads from the original traces to the desired working sets:
- Dmitry Vostokov @ DumpAnalysis.org + TraceAnalysis.org -
Posted in Log Analysis, Software Trace Analysis, Trace Analysis Patterns | No Comments »
Wednesday, October 4th, 2017
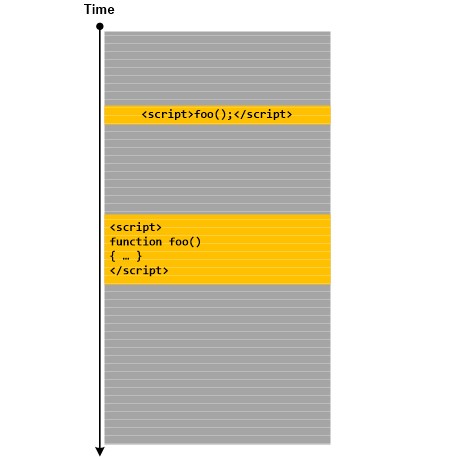
Messages that contain scripting statements can be signs of malnarratives that resulted from log injection during attempts to exploit possible cross channel scripting (XCS) and cross-site scripting (XSS) vulnerabilities. Such Script Messages may be spread across a log as illustrated in the following diagram:
- Dmitry Vostokov @ DumpAnalysis.org + TraceAnalysis.org -
Posted in Log Analysis, Malnarratives, Software Trace Analysis, Trace Analysis Patterns | No Comments »