Archive for the ‘Software Trace Analysis’ Category
Friday, May 2nd, 2014
Sometimes we are interested in changes in particular {property, value} pairs or in tuples {x1,x2,x3,…) in general where xi can be a number or a substring. This is more general pattern than Message Change because such tuples can be from different sources and belong to different messages:
This pattern is also different from Data Flow where a value stays constant across different sources and messages. It is also different from Gossip pattern which involves more semantic changes. Metaphorically we can think of Data Association pattern as a partial derivative.
- Dmitry Vostokov @ DumpAnalysis.org + TraceAnalysis.org -
Posted in Debugging, Log Analysis, Software Trace Analysis, Software Trace Reading, Trace Analysis Patterns | No Comments »
Monday, April 21st, 2014
Sometimes we know from Basic Facts some data or activity we seek to identify in different traces collected together to perform inter-correlational analysis. It can be a shared file name, a named synchronization object, a locked file with sharing violations, a common virtual address in kernel space, or just some activity notification. We call this pattern Shared Point by analogy with intersecting curves in some abstract space.
It is similar to Linked Messages pattern but is more high level and not confined to a common parameter (can be an action description).
- Dmitry Vostokov @ DumpAnalysis.org + TraceAnalysis.org -
Posted in Log Analysis, Software Trace Analysis, Software Trace Reading, Trace Analysis Patterns | No Comments »
Sunday, April 20th, 2014
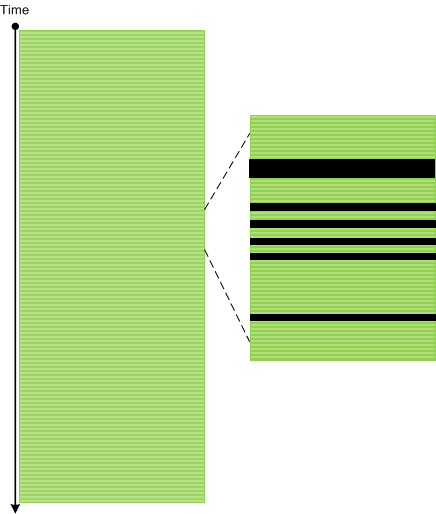
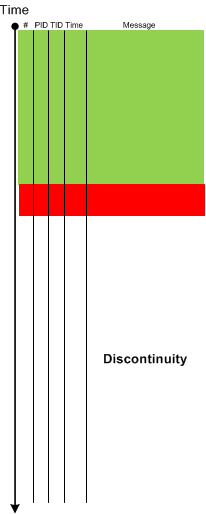
We mostly analyse real messages in software traces and logs. In such message streams we may see easily detectable Discontinuity patterns. However, in some cases it is beneficial to analyse the absence of messages. Message stream is not uniform, there may be different currents. If time resolution is 1 ms, for example, then we may have a current N msg/ms or in the case of lesser current, such as, 0.5 msg/ms we have the so called Silent Messages (—-):
[...]

11 ms: message

12 ms: ----

13 ms: message

14 ms: ----

15 ms: message

16 ms: message

17 ms: ----

18 ms: ----

19 ms: message

[...]
So, by a silent message we understand the possible message that would occupy the minimal time resolution gap. If we look at the following illustration we would see that the whole pattern analysis apparatus can be applied to the analysis of distribution of silent messages.
Silent Messages pattern is different from Discontinuity pattern because the latter is about large unexpected silences and Sparse Trace which is about missing trace statements from source code.
- Dmitry Vostokov @ DumpAnalysis.org + TraceAnalysis.org -
Posted in Log Analysis, Software Trace Analysis, Trace Analysis Patterns | No Comments »
Wednesday, February 12th, 2014
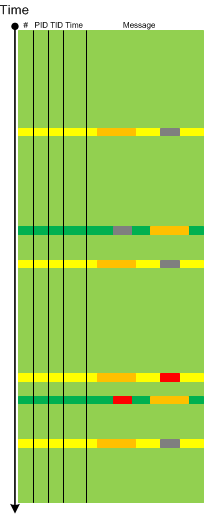
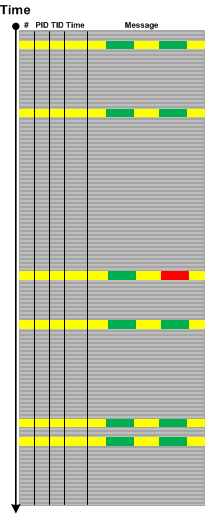
The next trace and log analysis pattern name is borrowed from Factor Groups in mathematics (or quotient groups). Here a group is, of course, not a mathematical group but just a group (or set) of log messages or trace statements. However, every trace message has variable and invariant parts. Variable parts usually contain some values, addresses or status bits. It can even be string values. Such values form a set too and can be partitioned into disjoint (non-overlapping) subsets. For example, a window foreground status can be either true or false. And we can group messages into disjoint factor groups each one having either only true or only false foreground status. The following trace graph illustrates a WindowHistory64 log where it was reported that one window was periodically loosing and gaining focus:
We found messages related to the reported process window title. By using Density Distribution pattern another such group of messages was found for another process window. Then a factor group was formed with two subgroups and their Relative Density was compared. For correlated alternating values it was expected to be 1. This was a very simple case, of course, which was analysed just by looking at a textual log but in more complex cases a computer assistance is required. A member of a factor group can also be generalized as a message subset with messages having variable part values from some domain subset or even calculated from it (some sort of a predicate): Mi = { m | P(m) }, where the original group of messages is a disjoin union of such message subsets: M = U Mi.
- Dmitry Vostokov @ DumpAnalysis.org + TraceAnalysis.org -
Posted in Log Analysis, Software Trace Analysis, Software Trace Analysis Tips and Tricks, Trace Analysis Patterns | No Comments »
Tuesday, February 11th, 2014
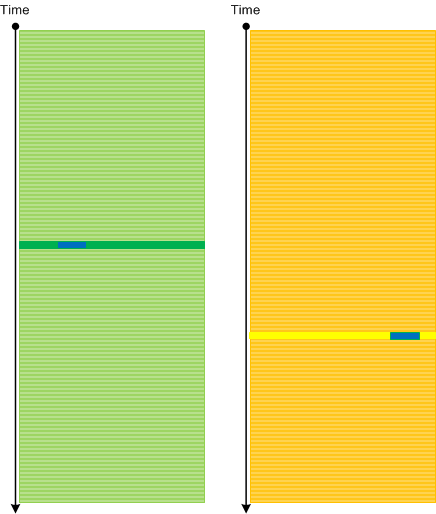
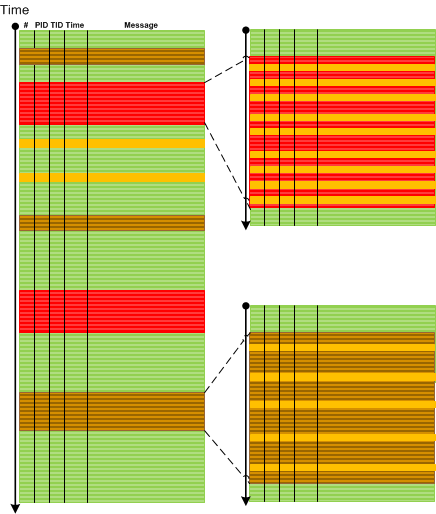
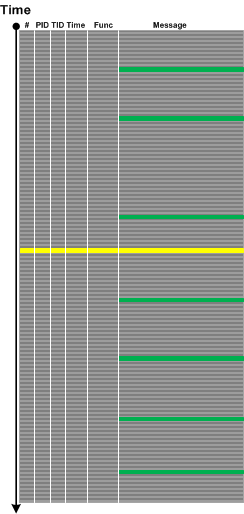
Sometimes we find a grouping of some messages in one trace and then we are interested in the some groupings either in the same trace (Intra-Correlation) or in another trace (Inter-Correlation). We may consider such grouping as having some local density compared to global Message Density pattern. Then we might be interested in that selected message grouping Density Distribution illustrated on this minimal trace graph:
- Dmitry Vostokov @ DumpAnalysis.org + TraceAnalysis.org -
Posted in Log Analysis, Software Trace Analysis, Trace Analysis Patterns | 1 Comment »
Sunday, December 22nd, 2013
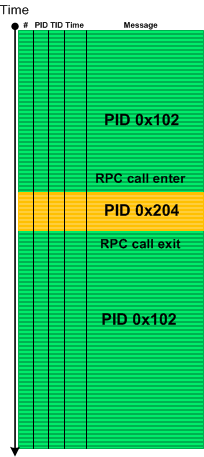
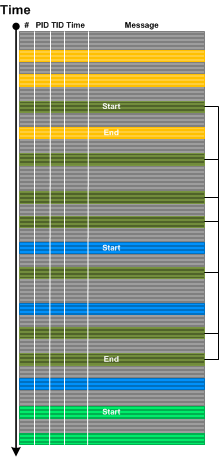
Activity Regions or blocks of messages having the same TID or PID usually follow each other in a typical complex software trace. Such following can be completely random and independent or it may be linear based on IPC or some inter-thread communication mechanism. For example, after filtering out Background Components we my find that an RPC client call setup is followed by messages from an RPC server:
Using a coordinate approach with message number and PID axes we can reformat this minimal trace diagram:
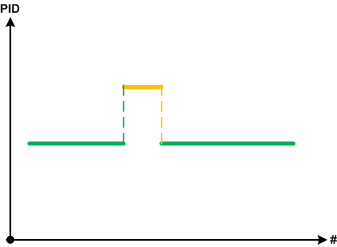
We call such pattern Piecewise Activity where we borrowed the concept of a piecewise linear function in mathematics (and piecewise continuity). In some problem software behaviour scenarios where we encountered such analysis pattern it was complemented by Discontinuity pattern. For example, an RPC call may be blocked and we don’t see client messages after that break till the end of the trace. In such cases we always recommended forcing a complete memory dump to check for wait chain memory analysis patterns.
- Dmitry Vostokov @ DumpAnalysis.org + TraceAnalysis.org -
Posted in CDF Analysis Tips and Tricks, Crash Dump Analysis, Crash Dump Patterns, Log Analysis, Software Trace Analysis, Trace Analysis Patterns | 1 Comment »
Saturday, November 9th, 2013
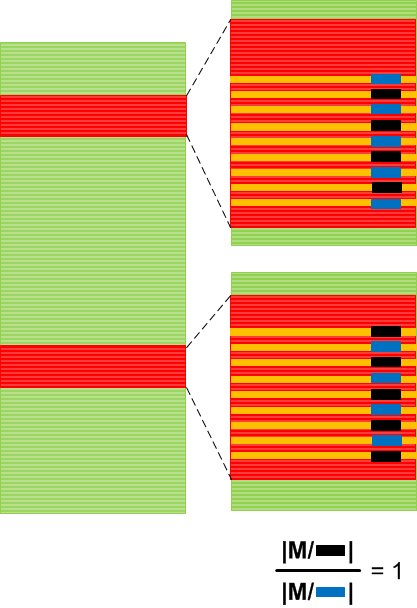
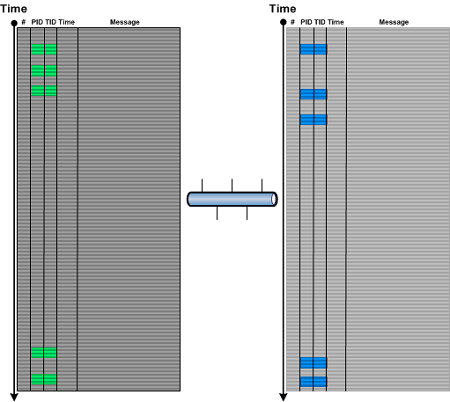
When analysing Inter-Correlation or Intra-Correlation and finding Discontinuities in one part or in a different trace (for example, in client-server environments) it is useful to see if there are corresponding Correlated Discontinuities in another part of the same trace (for example, a different Thread of Activity) or in a different trace. Such pattern may point to the underlying communication problem and may suggest to gather a different trace (for example, a network trace) for further analysis.
- Dmitry Vostokov @ DumpAnalysis.org + TraceAnalysis.org -
Posted in Log Analysis, Network Trace Analysis, Software Trace Analysis, Trace Analysis Patterns | No Comments »
Monday, August 19th, 2013
While working on Mobile Software Diagnostics webinar and exploring the richness of Android platform and similarity of its LogCat traces (Eclipse representation) to Minimal Trace Graphs (see a corresponding slide in trace analysis pattern reference) we recognized the time has come to provide a Java implementation for a general software narratological pattern-oriented trace analysis approach and also see what memory analysis patterns can also be applied there. Here by implementation we mean concrete platform examples. For example, in the past we did similar implementations of memory analysis patterns (originally developed for unmanaged and native Windows code) for .NET (WinDbg) and Mac OS X (GDB). The first trace analysis pattern we cover here is very obvious and simple and is called Exception Stack Trace. In the original pattern example a stack trace was inside a single trace message but can also be split such as each frame has its own message (date and time columns were removed for clarity):
E/AndroidRuntime(31416): java.lang.NullPointerException

E/AndroidRuntime(31416):  at android.view.MotionEvent.writeToParcel(MotionEvent.java:1596)

E/AndroidRuntime(31416):  at com.example.nullpointer.FullscreenActivity$1.onTouch(FullscreenActivity.java:139)

E/AndroidRuntime(31416):  at android.view.View.dispatchTouchEvent(View.java:3881)

E/AndroidRuntime(31416):  at android.view.ViewGroup.dispatchTouchEvent(ViewGroup.java:869)

E/AndroidRuntime(31416):  at android.view.ViewGroup.dispatchTouchEvent(ViewGroup.java:869)

E/AndroidRuntime(31416):  at android.view.ViewGroup.dispatchTouchEvent(ViewGroup.java:869)

E/AndroidRuntime(31416):  at android.view.ViewGroup.dispatchTouchEvent(ViewGroup.java:869)

E/AndroidRuntime(31416):  at android.view.ViewGroup.dispatchTouchEvent(ViewGroup.java:869)

E/AndroidRuntime(31416):  at com.android.internal.policy.impl.PhoneWindow$DecorView. superDispatchTouchEvent(PhoneWindow.java:1750)

E/AndroidRuntime(31416):  at com.android.internal.policy.impl.PhoneWindow. superDispatchTouchEvent(PhoneWindow.java:1135)

E/AndroidRuntime(31416):  at android.app.Activity.dispatchTouchEvent(Activity.java:2096)

E/AndroidRuntime(31416):  at com.android.internal.policy.impl.PhoneWindow$DecorView. dispatchTouchEvent(PhoneWindow.java:1734)

E/AndroidRuntime(31416):  at android.view.ViewRoot.deliverPointerEvent(ViewRoot.java:2216)

E/AndroidRuntime(31416):  at android.view.ViewRoot.handleMessage(ViewRoot.java:1887)

E/AndroidRuntime(31416):  at android.os.Handler.dispatchMessage(Handler.java:99)

E/AndroidRuntime(31416):  at android.os.Looper.loop(Looper.java:130)

E/AndroidRuntime(31416):  at android.app.ActivityThread.main(ActivityThread.java:3687)

E/AndroidRuntime(31416):  at java.lang.reflect.Method.invokeNative(Native Method)

E/AndroidRuntime(31416):  at java.lang.reflect.Method.invoke(Method.java:507)

E/AndroidRuntime(31416):  at com.android.internal.os.ZygoteInit$MethodAndArgsCaller.run(ZygoteInit.java:867)

E/AndroidRuntime(31416):  at com.android.internal.os.ZygoteInit.main(ZygoteInit.java:625)

E/AndroidRuntime(31416):  at dalvik.system.NativeStart.main(Native Method)
Since many memory analysis patterns are based on stack traces here we also have similarity with the following patterns names as Managed Code Exception and Managed Stack Trace. We hope that in the subsequent pattern implementation examples we show more complex patterns of abnormal software behaviour and may also discover any missing ones.
- Dmitry Vostokov @ DumpAnalysis.org + TraceAnalysis.org -
Posted in Android Trace Corner, Debugging, Java Debugging, LogCat Trace Analysis, Software Trace Analysis, Trace Analysis Patterns | No Comments »
Friday, July 19th, 2013
Most of the time when we look at software trace fragments we recognize certain Motifs* such as client-server interaction, publisher-subscriber notifications, database queries, plugin sequence initialization, etc. This pattern is different from Master Trace which corresponds to a normal use-case or working software scenario and may actually contain several Motifs as it is usually happens in complex software environments. On the other side of the spectrum there are software narremes (basic narrative units) and Macrofunctions (single semantic units). Motifs help to further bridge the great divide between software construction and software diagnostics with software narremes corresponding to implementation patterns, macrofunctions to design patterns, and motifs to architectural patterns although an overlap between these categories is possible.
* The idea of a pattern name comes from motives in mathematics.
- Dmitry Vostokov @ DumpAnalysis.org + TraceAnalysis.org -
Posted in Software Diagnostics, Software Narratology, Software Narremes, Software Trace Analysis, Software Trace Reading, Trace Analysis Patterns | No Comments »
Wednesday, June 12th, 2013
Dialogue is an important pattern especially in network trace analysis. It usually involves a message source, a different message target (although both can be the same) and some alternation between them as shown on this abstract trace diagram:
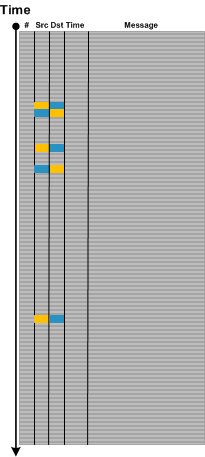
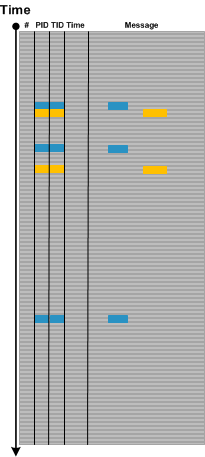
Message and source are not only IP addresses or port numbers. They can be window handles, for example. Sometimes, the roles of source and target play different Process ID and Thread ID combinations (Client ID, CID). In such cases some parts of a message text may signify reply and response as shown graphically:
The similar illustration can be done for multi-computer trace, for example, when several traces from different servers are combined into one, where a combination of CID and a computer ID (Co) or just Co can play the roles of source and target.
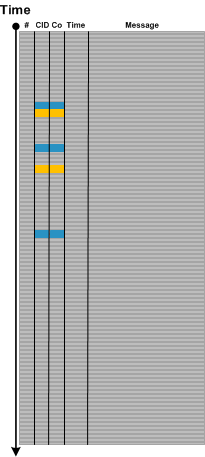
Note that on all illustrations above the 3rd request doesn’t have a reply message: a possible Incomplete History pattern.
- Dmitry Vostokov @ DumpAnalysis.org + TraceAnalysis.org -
Posted in Log Analysis, Network Trace Analysis, Software Trace Analysis, Trace Analysis Patterns | No Comments »
Tuesday, May 21st, 2013
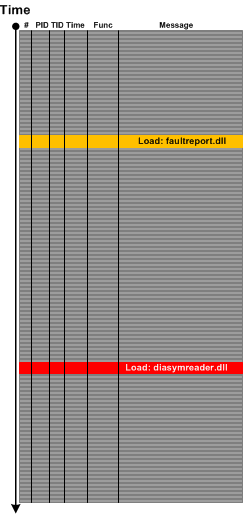
Sometimes we look at a trace or log and instead of Error Messages we only see their “signs” such as a DLL load event for an error or fault reporting module or a module that is related to symbol files such diasymreader.dll. We call this pattern Hidden Error by an analogy to Hidden Exception in memory dump analysis pattern catalogue although sometimes we can see such modules in memory dump Module Collection. For example, the presence of diasymreader module may signify an unreported .NET exception and suggest a dump collection strategy.
- Dmitry Vostokov @ DumpAnalysis.org + TraceAnalysis.org -
Posted in .NET Debugging, CDF Analysis Tips and Tricks, Log Analysis, Process Monitor Log Analysis, Software Trace Analysis, Software Trace Reading, Trace Analysis Patterns | No Comments »
Sunday, May 12th, 2013
Sometimes we need to analyse Last Activity before Significant Event or Discontinuity. By this pattern we mean a loose semantic collection of messages before process exit, for example. This might give some clues to further troubleshooting. In one incident a process was suddenly exiting. Its own detailed trace didn’t have any messages explaining that probably due to insufficient tracing coverage (Sparse Trace). Fortunately, a different external trace (from Process Monitor) was collected (Inter-Correlation) and it had LDAP network communication messages just before thread and process exit events.
- Dmitry Vostokov @ DumpAnalysis.org + TraceAnalysis.org -
Posted in Software Trace Analysis, Software Trace Reading, Trace Analysis Patterns | No Comments »
Saturday, May 4th, 2013
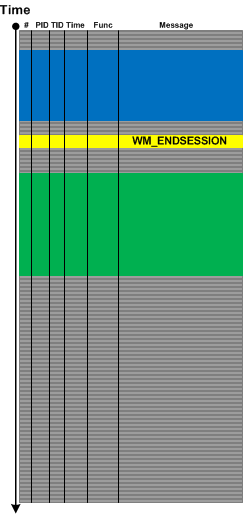
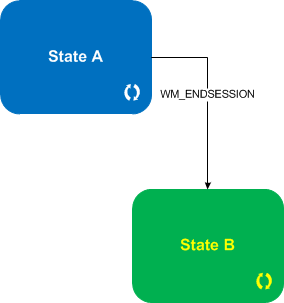
For event- or message-driven architectures it is important to differentiate between event and state messages (including state transition). For example, a system may be doing some work while being in some particular state with a lot of tracing and respond to various external events with each of them having a corresponding trace message. Upon such an event the system transitions to some other state with its own set of possible trace messages. We call such a pattern State and Event. Typical example here is a windowing terminal services system and WM_ENDSESSION event illustrated in the following abstract trace diagram with a corresponding state transition diagram below it:
- Dmitry Vostokov @ DumpAnalysis.org + TraceAnalysis.org -
Posted in CDF Analysis Tips and Tricks, Log Analysis, Software Trace Analysis, Software Trace Reading, Trace Analysis Patterns | No Comments »
Thursday, April 25th, 2013
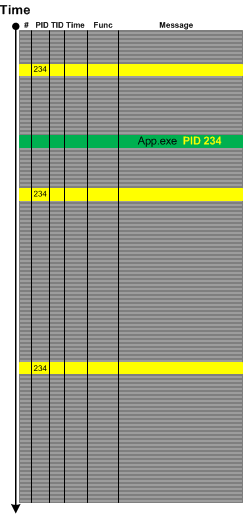
Sometimes in the case of missing Basic Facts we can discern Indirect Facts from message text and even from other patterns. For example, in one incident we were interested in all messages from the certain process name but its PID was missing from the problem description. Fortunately we were able to get its PID from one of individual messages from completely different source:
- Dmitry Vostokov @ DumpAnalysis.org + TraceAnalysis.org -
Posted in Log Analysis, Software Trace Analysis, Software Trace Reading, Trace Analysis Patterns | No Comments »
Monday, March 25th, 2013
In the past we viewed software traces and logs as temporarily ordered event sequences. Since events are just memory data we have a map
T -> M
as can be seen in the definition of a software trace. Here we generalize the domain to any arbitrary set, for example, it can be a list of indexes or pointers or even memory itself. The latter map can give us narrative chains such as
M -> M -> M -> M
and even give us a grand unification of memory and log analysis and the possibility to apply software narratology to memory dump analysis as well. We talk about it soon and provide some generalized software narrative examples.
- Dmitry Vostokov @ DumpAnalysis.org + TraceAnalysis.org -
Posted in Crash Dump Analysis, Crash Dump Patterns, Log Analysis, Software Narrative Science, Software Narratology, Software Trace Analysis, Trace Analysis Patterns | No Comments »
Saturday, March 23rd, 2013
While preparing a presentation on malware narratives we found that one essential pattern is missing from the current log analysis pattern catalog. Most of the time we see some abnormal or unexpected value in a software trace or log such as a network address outside expected range and this triggers further investigation. The message structure may be the same having the same Message Invariant but variable part may contain such values as depicted graphically:
We call this pattern Abnormal Value and plan to add the similar one to memory dump analysis pattern catalog. Please not that we also have Significant Event pattern that is more general and also covers messages without variable part or just suspicious log entries.
- Dmitry Vostokov @ DumpAnalysis.org + TraceAnalysis.org -
Posted in Debugging, Log Analysis, Malware Analysis, Network Trace Analysis, Software Trace Analysis, Software Trace Reading, Trace Analysis Patterns | No Comments »
Wednesday, March 20th, 2013
Sometimes we have insufficiently detailed problem description and/or there are several similar parallel user activities going on simultaneously, for example, several session are launched in a terminal services environment. In such cases when tracing is done for the duration of specific user activity Dominant Event Sequence pattern may help. Here we select the most full sequence of events or event sequence based on some Basic Facts. For example, if session id was missing in problem description we can choose the most long and full process launch seqence and assume that its session id was the one missing:
- Dmitry Vostokov @ DumpAnalysis.org + TraceAnalysis.org -
Posted in CDF Analysis Tips and Tricks, Software Trace Analysis, Software Trace Reading, Trace Analysis Patterns | No Comments »
Saturday, March 16th, 2013
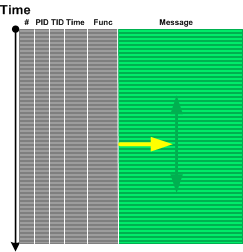
Suppose we form an adjoint thread based on some message or operation type or some other attribute:
But we do not know where to start to look backwards for any anomalies relevant to our problem:
We go back to our full trace and find a problem message:
Although it is not in our adjoint thread we formed previously it is still considered as Pivot Message helping us to go backwards there:
- Dmitry Vostokov @ DumpAnalysis.org + TraceAnalysis.org -
Posted in Software Trace Analysis, Software Trace Reading, Trace Analysis Patterns | No Comments »
Thursday, March 14th, 2013
If Implementation Discourse focuses on objective technology specific discourse then Traces of Individuality pattern focuses on subjective elements in a software log and its messages. Here we mean some specific naming or tracing conventions either from an individual engineer habit or from some corporate coding standard. As an example of it consider a trace message from a catch statement:
"Surprise, surprise, should have never been caught"
More examples for this pattern will be added later.
- Dmitry Vostokov @ DumpAnalysis.org + TraceAnalysis.org -
Posted in Software Trace Analysis, Software Trace Deconstruction, Software Trace Linguistics, Software Trace Reading, Software Trace Stylistics, Trace Analysis Patterns | No Comments »
Friday, February 15th, 2013
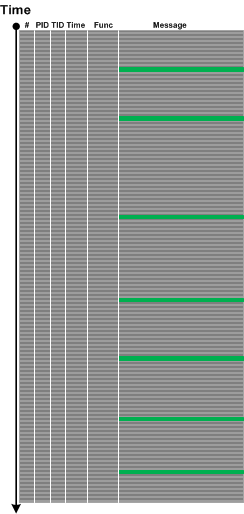
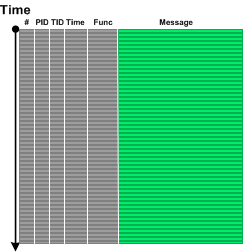
Inter-Correlation analysis between a normal and a problem logs to find a Bifurcation Point (and a possible root cause) becomes a difficult task when both traces come from different environments with widely differing Background Components. Here a new analysis pattern called Sheaf of Activities (borrowed from sheaves from mathematics) can help. Basically this pattern is also a tool in tracking properties of trace message subsets. First we find out important message types around some Activity Region where we hope to find a difference between two traces:
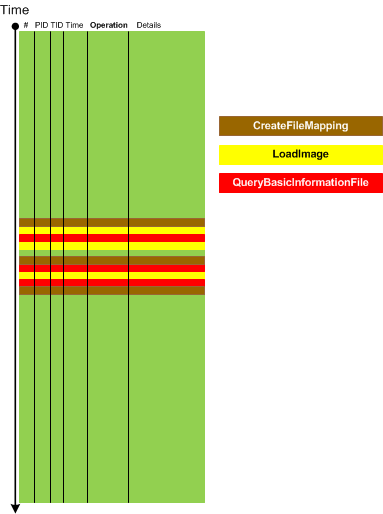
Then we create several Adjoint Threads from different message types, for example, based on operation type or function name:

Then we analyze subtraces separately to find out a bifurcation point in each of them and then use this knowledge to find out differences between the original full traces.
- Dmitry Vostokov @ DumpAnalysis.org + TraceAnalysis.org -
Posted in Debugging, Process Monitor Log Analysis, Software Trace Analysis, Software Trace Reading, Trace Analysis Patterns | No Comments »