Archive for the ‘Software Technical Support’ Category

Troubleshooter’s Block

Sunday, January 13th, 2008

Have you ever had a problem when you don’t know what question to ask? This is what I call Troubleshooter’s Block by analogy with famous Writer’s Block. If such block happens to me I turn to the list of questions and try to find the similar one to my problem or assemble the new one based on some analogy. For example, I use Citrix Brief Troubleshooting Guide mentioned in the previous post. It contains plenty of questions that can be used as a template.

- Dmitry Vostokov @ DumpAnalysis.org -

Catalogue of Troubleshooting Tools

Sunday, January 13th, 2008

This useful catalogue has links to many free tools that can be used to troubleshoot now ubiquitous Citrix environments. The last time I mentioned the catalogue was Oct 2006 and since then it was updated several times.

Troubleshooting Tools for Citrix Environments

The following document is also useful:

Citrix Brief Troubleshooting Guide 

- Dmitry Vostokov @ DumpAnalysis.org -

Crash Dump Analysis AntiPatterns (Part 8)

Thursday, January 10th, 2008

This is sometime very funny one. It is called Fooled by Abbreviation. When someone is so presupposed or engaged in identifying Alien Components due to limited time and complexity of issues. For example, “Ctx” abbreviation in function names will most likely mean “Context” in general but can also be a function and data structure prefix used by a company with a similar sounding name. Opposite cases happen too when general is presupposed instead of particular, for example, ”Mms” prefix is read as “Memory Management Subsystem” but belongs to a multimedia system vendor. 

- Dmitry Vostokov @ DumpAnalysis.org -

ManagementBits update (December, 2007)

Friday, January 4th, 2008

As promised I’m posting here the first monthly summary of my Management Bits and Tips blog where I introduced the port of crash dump analysis patterns to project failure analysis patterns.

- Dmitry Vostokov @ DumpAnalysis.org -

Management Bits and Tips blog

Tuesday, December 18th, 2007

To disassociate management activities and thoughts with crashes and hangs I have created a separate blog called

Management Bits and Tips

with the subtitle “Reflections on Software Engineering and Software Technical Support Management”.

Although, in the future, I reserve the right to metaphorically relate crash and hang dump analysis patterns with technical and people management.

All future posts in Management Bits and Tips category and related posts in Software Techical Support category will go there and here I will only post monthly or bi-monthly summary.

- Dmitry Vostokov @ DumpAnalysis.org -

Flawless writing with Google

Thursday, December 13th, 2007

Management Bits and Tips 0×1 - Many managers have flawless writing skills (bit). Use Google to check your writing (tip).

It is especially important for non-native English speakers like me. You can search simple sub-sentences and their alterations to compare search results.

For example, today I had a discussion about this sub-sentence:

“It’s main advantage is “

It gives 539 search results. However the sentence without apostrophe

“Its main advantage is “

gives 8,870 search results. Let’s check combinations with two “it”.

  • “It’s main advantage is it’s ” - 192
  • “Its main advantage is it’s ” - 0
  • “It’s main advantage is its ” - 299
  • “Its main advantage is its ” - 836

So you get the idea of what is more correct or more widely used from descriptive grammar point of view. 

- Dmitry Vostokov @ DumpAnalysis.org -

Expertise-Driven Motivation

Tuesday, December 11th, 2007

There are many X-Driven motivations out there but I prefer expertise-driven individuals, motivated by the desire to become experts. It is not bullshit as you might think. It is more like a persistent psychological state found in researchers and scientists and the best results are guaranteed when it is supplemented by money-driven positive feedback loop. I’ve seen such people in both software engineering and software technical support environments. It is very interesting topic and I might come back to it later.

- Dmitry Vostokov @ DumpAnalysis.org -

Complexity and Memory Dumps (Part 1)

Wednesday, December 5th, 2007

Asking right questions at the appropriate hierarchical organization level is a known solution to complexity. In case of memory dumps it is sometimes useful to forget about bits, bytes, words, dwords and qwords, memory addresses, pointers, runtime structures, API and ask educated questions at component level, the simplest of it is the question about component timestamp, in WinDbg parlance, using variants of lm command, for example:

0:008> lmt m ModuleA
start    end        module name
76290000 762ad000   ModuleA  Sat Feb 17 13:59:59 2007 (45D70A5F)

0:008> lmt m ModuleB
start    end        module name
66c50000 66c65000   ModuleB  Fri Feb 02 22:30:03 2007 (45C3BB6B)

The next step is obvious: test with the newer version. Another good question is about consistency to exclude cases caused by α-particle hits. This latter possibility was mentioned in Andreas Zeller’s book I read some time ago and can be considered as the efficient cause of some crash dumps according to Aristotelian causation categories.   

- Dmitry Vostokov @ DumpAnalysis.org -

Crash Dump Analysis AntiPatterns (Part 7)

Monday, December 3rd, 2007

Be language - excessive use of “is”. This anti-pattern was inspired by Alfred Korzybski notion of how “is” affects our understanding of the world. In the context of technical support the use of certain verbs sometimes leads to wrong troubleshooting and debugging paths. For example, the following phrase:

It is our pool tag. It is effected by driver A, driver B and driver C.  

Surely driver A, driver B and driver C were not developed by the same company that introduced the problem pool tag (smells Alien Component here). Unless supported by solid evidence the better phrase shall be:

It is our pool tag. It might have been effected by driver A, driver B or driver C.  

I’m not advocating to completely eradicate “be” verbs as was done in E-Prime language but to be conscious in their use. Thanks to Simple*ology in pointing me to the right direction.

- Dmitry Vostokov @ DumpAnalysis.org -

Four pillars of software troubleshooting

Thursday, November 29th, 2007

They are (sorted alphabetically):

  1. Crash Dump Analysis (also called Memory Dump Analysis or Core Dump Analysis)

  2. Problem Reproduction

  3. Trace and Log Analysis

  4. Virtual Assistance (also called Remote Assistance)


For troubleshooting software on Windows platforms Citrix provides GoToAssist for virtual on-site presence and Xen for problem reproduction.

- Dmitry Vostokov @ DumpAnalysis.org -

DebugWare

Tuesday, November 27th, 2007

I’ve been slowly accumulating blog posts about various troubleshooting tools for my next book in a row with a working title:

DebugWare: The Art and Craft of Writing Troubleshooting and Debugging Tools

Details will be announced later together with supporting website which is under construction. This book will be about architecture, design and implementation of troubleshooting tools for software technical support.

- Dmitry Vostokov @ DumpAnalysis.org -

Five golden rules of troubleshooting

Monday, November 26th, 2007

It is difficult to analyze a problem when you have crash dumps and/or traces from various tracing tools and supporting information you have is incomplete or missing. After doing crash dump and trace analysis including ETW-based traces for more than 4 years I came up with this easy to remember 4WS questions to ask when you send or request traces and memory dumps:

What - What had happened or had been observed? Crash or hang, for example?

When - When did the problem happen if traces were recorded for hours?

Where - What server or workstation had been used for tracing or where memory dumps came from? For example, one trace is from a primary server and two others are from backup servers or one trace is from a client workstation and the other is from a server. 

Why - Why did a customer or a support engineer request a dump or a trace? This could shed the light on various assumptions including presuppositions hidden in problem description.  

Supporting information - needed to find a needle in a hay: process id, thread id, etc. Also, the answer to the following question is important: how dumps and traces were created?

Every trace or memory dump shall be accompanied by 4WS answers.  

4WS rule can be applied to any troubleshooting because even the problem description itself is some kind of a trace.

- Dmitry Vostokov @ DumpAnalysis.org -

Crash Dump Analysis AntiPatterns (Part 6)

Thursday, November 22nd, 2007

Need the crash dump. Period. This might be the first thought when an engineer gets a stack trace fragment without symbolic information. It is usually based on the following presupposition:

We need an actual dump file to suggest further troubleshooting steps.

This is not actually true unless it is the first time you have the problem and get stack trace for it. Consider the following fragment from bugcheck kernel dump when no symbols were applied because the customer didn’t have them:

b90529f8 8085eced nt!KeBugCheckEx+0x1b
b9052a70 8088c798 nt!MmAccessFault+0xb25
b9052a70 bfabd940 nt!_KiTrap0E+0xdc
WARNING: Stack unwind information not available. Following frames may be wrong.
b9052b14 bfabe452 MyDriver+0x27940

We can convert module+offset information into module!function+offset2 using MAP files or using DIA SDK (Debug Interface Access SDK) to query PDB files if we know module timestamp. This might be seen as a tedious exercise but we don’t need to do it if we keep raw stack trace signatures in some database when doing crash dump analysis. If we use our own symbol servers we might want to remove references to them and reload symbols. Then redo previous stack trace commands.

In my case it happened that I already analyzed similar previous bugcheck crash dumps months ago and saved stack trace prior to applying symbols. This helped me to point to solution without requesting the crash dump corresponding to that stack trace.

- Dmitry Vostokov @ DumpAnalysis.org -

Critical thinking when troubleshooting

Thursday, November 22nd, 2007

Faulty thinking happens all the time in technical support environments partly due to hectic and demanding business realities.

Simple*ology book pointed me to this website:

http://www.fallacyfiles.org/ 

which taxonomically organizes fallacies:

http://www.fallacyfiles.org/taxonomy.html

For example, False Cause. Technical examples might include false causes inferred from trace analysis, customer problem description that includes steps to reproduce the problem, etc. This also applies to debugging and importance of thinking skills has been emphasized in the following book:

Debugging by Thinking: A Multidisciplinary Approach

Surface-level of basic crash dump analysis is less influenced by false cause fallacies because it doesn’t have explicitly recorded sequence of events although some caution should be exercised during detailed analysis of thread waiting times and other historical information.   

Warning: when exercising critical thinking recursively we need to stop at the right time to avoid paralysis of analysis :-) 

- Dmitry Vostokov @ DumpAnalysis.org

Windows Internals book

Monday, November 19th, 2007

Scheduled to be updated with Windows Vista and Windows Server 2008 details:

Windows® Internals, Fifth Edition

- Dmitry Vostokov @ DumpAnalysis.org

Making Software Troubleshooting Simple

Thursday, November 15th, 2007

Excellent read to refine general problem solving skills towards simplicity, understand broad applicability of modeling and just for fun:

Simpleology: The Simple Science of Getting What You Want

But from Amazon

Now I’m going to have a simple lunch and read this simple book. What about the rating? Of course, it is simple too! Maximum! 1 star in my simple zero-one binary rating system - worth (1) or not worth (0) to read.

- Dmitry Vostokov @ DumpAnalysis.org -

Software Technical Support Patterns

Tuesday, October 9th, 2007

I was wondering today whether there are any published patterns for software technical support and to my delight I found this interesting EuroPLoP conference paper:

Technical Support Patterns

- Dmitry Vostokov @ DumpAnalysis.org -

Selected Citrix Troubleshooting Tools

Monday, July 23rd, 2007

I’ve put an HTML version of the recently updated Selected Citrix Tools presentation:

Selected Citrix Tools (15.07.07)

It covers only public tools that I wrote and maintain. If you are interested in the broader spectrum of troubleshooting tools for Citrix environments please look at the following Citrix article:

http://support.citrix.com/article/CTX107572

- Dmitry Vostokov @ DumpAnalysis.org -

Troubleshooting as debugging

Wednesday, July 11th, 2007

This post is motivated by TRAFFIC steps introduced by Andreas Zeller in his book ”Why Programs Fail?”. This book is wonderful and it gives practical debugging skills coherent and solid systematical foundation.

However these steps are for fixing defects in code, the traditional view of the software debugging process. Based on an analogy with systems theories where we have different levels of abstraction like psychology, biology, chemistry and physics, I would say that debugging starts when you have the failure at the system level.

If we compare systems to applications, troubleshooting to source code debugging, the question we ask at the higher level is “Who caused the product to fail?” which also has a business and political flavor. Therefore I propose a different acronym: VERSION. If you always try to fix system problems at the code level you will get a huge “traffic” in all sense but if you troubleshoot them first you get a different system / subsystem / component version and get your problem solved faster. This is why we have technical support departments in organizations. 

There are some parallels between TRAFFIC and VERSION steps:

Track                     View the problem
Reproduce                 Environment/repro steps
Automate (and simplify)   Relevant description
Find origins              Subsystem/component
                             identification
Focus                     Identify the origin
                             (subsystem/component)
Isolate (defect in code)  Obtain the solution
                             (replace/eliminate
                              subsystem/component)
Correct (defect in code)  New case study
                             (document,
                              postmortem analysis)

Troubleshooting doesn’t eliminate the need to look at source code. In many cases a support engineer has to be proficient in code reading skill to be able to map from traces to source code. This will help in component identification, especially if your product has extensive tracing facility. I have started development of  ”Code Reading” training targeted for Windows environments and will post some presentations soon. The first one will be available tomorrow, so stay tuned.

- Dmitry Vostokov @ DumpAnalysis.org -

ScreenHistory 1.0

Sunday, April 8th, 2007

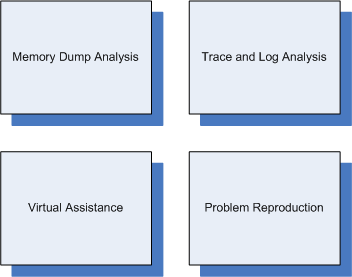
After working with many customer issues where I needed good screenshots I decided to write a screen or window capture tool to make troubleshooting and reading other logs/traces easier. Here is ScreenHistory tool with familiar History-like GUI interface if you have seen WindowHistory, MessageHistory and ProcessHistory tools.

The tool captures the whole screen (currently the primary monitor) after specified interval (default is 1 second) or the contents of a current foreground window (multi-monitor independent) and saves its screenshot in JPEG, GIF (default) or PNG file. Additionally an HTML file is generated with links to screenshots. New forthcoming versions of WindowHistory and MessageHistory will reference these screenshots. Windows Mobile version will be released soon too.

Instead of forming a mental picture about screen when you look at messages or relating them to arbitrary screenshots sent by your customers you can easily check real-time screenshots when you look at message traces, for example, MessageHistory trace:

13:12:24:944 S WM_ACTIVATEAPP (0x1c) wParam: 0x0 lParam: 0x12ec Deactivated / TID of activated window: 0x12ec

[Screen]
13:12:47:268 S WM_ACTIVATEAPP (0×1c) wParam: 0×1 lParam: 0×0 Activated / TID of deactivated window: 0×0

[Screen]

or WindowHistory trace

Handle: 000300E4 Class: "MyClass" Title: "My Application"
Captured at: 13:11:47:983
Process ID: 6c4
Thread ID: 1054
Parent: 0
Screen position (l,t,r,b): (264,161,1032,691)
Visible: true
Window placement command: SW_SHOWNORMAL
Foreground: false
Foreground changed at 13:12:20:626 to true
[Screen]
Foreground changed at 13:12:24:959 to false
[Screen]
Foreground changed at 13:12:47:284 to true
[Screen]
Foreground changed at 13:12:51:852 to false
[Screen]

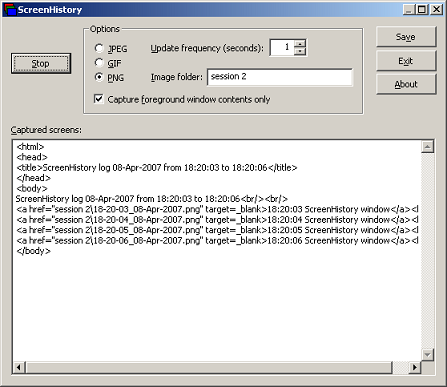
The following ScreenHistory screenshot was saved by the tool itself:

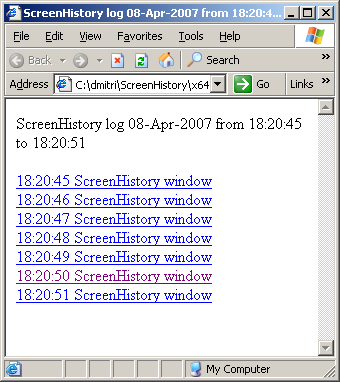
If you save an HTML file and load it in IE you would see formatted screen log (screenshot was saved by ScreenHistory):

- Dmitry Vostokov @ DumpAnalysis.org -