Archive for the ‘Science of Memory Dump Analysis’ Category
Thursday, September 23rd, 2010
When I was a child I experienced dreams where I was carried by a huge wave that was transforming to a torus completely absorbing me up to a breakpoint of my wake up. A year ago I got the book Memory Evolutive Systems because of my interest in applying category theory to memory analysis and debugging and immediately recalled my long-time forgotten childhood dreams while staring at its front cover:

- Dmitry Vostokov @ DumpAnalysis.org + TraceAnalysis.org -
Posted in Books, Categorical Debugging, History, Mathematics, Memoretics, Memory Dreams, Memory Visualization, Science of Memory Dump Analysis | No Comments »
Wednesday, August 11th, 2010
There are many different approaches to illustrate virtual to physical memory mapping on systems with paging like Windows. Here is another approach that uses natural memory visualization. An image of a user process was generated and juxtaposed to an image of kernel memory dump generated afterwards to produce the combined picture of the full virtual space. Of course, uncommited regions were not included in it as they were not present in user and kernel dumps. Then, after reboot, the same application was launched again and an image of a complete memory dump was generated. Finally, both images were juxtaposed to produce this approximate picture:
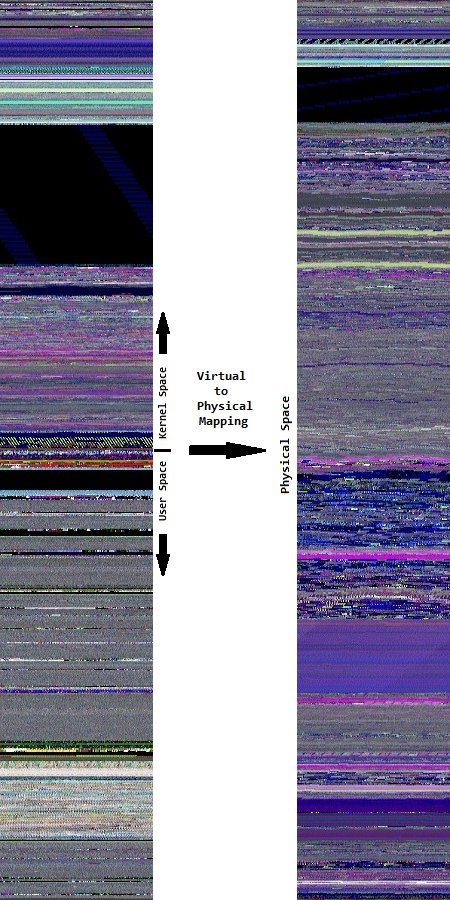
In the virtual memory space to the left we see much more granularity. On the contrary, the physical memory space to the right is more uniform and has a different coloring.
- Dmitry Vostokov @ DumpAnalysis.org + TraceAnalysis.org -
Posted in Computer Science, Fun with Crash Dumps, Memoretics, Memory Diagrams, Memory Space Art, Memory Visualization, Science of Memory Dump Analysis, Training and Seminars | No Comments »
Monday, May 10th, 2010
My drive to generalization led me to place an adornment on the portal to highlight the fact that memory and software trace analysis patterns are under an umbrella of general software behaviour patterns:
http://www.dumpanalysis.org/Software-Behavior-Patterns-Headline
In the forthcoming post series I plan to write about similarities between these two branches and also provide pattern examples from non-Windows platforms. All this material will provide the foundation for the forthcoming book Software Behavior: A Guide to Systematic Analysis (ISBN: 978-1906717162).
- Dmitry Vostokov @ DumpAnalysis.org + TraceAnalysis.org -
Posted in Announcements, Computer Science, Crash Dump Analysis, Crash Dump Patterns, Debugging, Escalation Engineering, Memiotics (Memory Semiotics), Memoretics, Science of Memory Dump Analysis, Science of Software Tracing, Software Behavior Patterns, Software Engineering, Software Maintenance Institute, Software Technical Support, Software Trace Analysis, Software Troubleshooting Patterns, Trace Analysis Patterns | No Comments »
Thursday, April 22nd, 2010
I’ve decided to adapt archaeological classificatory framework (using my favourite method of inquiry: metaphorical bijectionism) to lay out foundations for yet another attempt to classify DA+TA patterns):
Attribute  ↔ Pattern

Artefact   ↔ Component Artefact1

Assemblage ↔ Component Assemblage

Culture    ↔ Memory System Culture
2

1 Can be either a component-generated artefact or a component like a module or symbol file
2 Typical examples of memory system cultures are Windows, UNIX or even “Multiplatform”
I propose a word Memoarchaeological for such a framework and Memoarchaeology for a branch of Memoretics that studies saved computer memory artifacts from past computations (as opposed to live memory).
Note: In one of the forthcoming issues of Debugged! MZ/PE magazine there will be presented yet another classificatory scheme.
- Dmitry Vostokov @ DumpAnalysis.org + TraceAnalysis.org -
Posted in Announcements, Archaeology of Computer Memory, CDA Pattern Classification, Crash Dump Analysis, Crash Dump Patterns, Debugging, Memoretics, Memory Analysis Forensics and Intelligence, New Words, Science of Memory Dump Analysis, Science of Software Tracing, Software Behavior Patterns, Software Trace Analysis, Trace Analysis Patterns | No Comments »
Thursday, April 22nd, 2010
Forthcoming CARE and STARE online systems additionally aim to provide software behaviour pattern identification via debugger log and trace analysis and suggest possible software troubleshooting patterns. The purpose of these post series is to provide high level overview of possible patterns of software behavior and how they can be recognised and analyzed. This work started in October, 2006 with the identification of computer memory patterns and later continued with software trace patterns. Bringing all of them under a unified linked framework seems quite natural to me.
- Dmitry Vostokov @ DumpAnalysis.org + TraceAnalysis.org -
Posted in Computer Science, Crash Dump Analysis, Crash Dump Patterns, Escalation Engineering, Science of Memory Dump Analysis, Science of Software Tracing, Software Behavior Patterns, Software Engineering, Software Maintenance Institute, Software Technical Support, Software Trace Analysis, Software Troubleshooting Patterns, Trace Analysis Patterns | No Comments »
Sunday, April 18th, 2010
OpenTask to offer first 3 volumes of Memory Dump Analysis Anthology in one set:


The set is available exclusively from OpenTask e-Commerce web site starting from June. Individual volumes are also available from Amazon, Barnes & Noble and other bookstores worldwide.
Product information:
- Title: Modern Memory Dump and Software Trace Analysis: Volumes 1-3
- Author: Dmitry Vostokov
- Language: English
- Product Dimensions: 22.86 x 15.24
- Paperback: 1600 pages
- Publisher: Opentask (31 May 2010)
- ISBN-13: 978-1-906717-99-5
Information about individual volumes:
- Dmitry Vostokov @ DumpAnalysis.org + TraceAnalysis.org -
Posted in .NET Debugging, Aesthetics of Memory Dumps, Announcements, AntiPatterns, Art, Assembly Language, Books, Bugchecks Depicted, C and C++, CDA Pattern Classification, CDF Analysis Tips and Tricks, Categorical Debugging, Certification, Citrix, Code Reading, Common Mistakes, Computational Ghosts and Bug Hauntings, Computer Science, Countefactual Debugging, Crash Analysis Report Environment (CARE), Crash Dump Analysis, Crash Dump Patterns, Crash Dumps for Dummies, Data Recovery, DebugWare Patterns, Debugging, Debugging Methodology, Debugging Slang, Deep Down C++, Dictionary of Debugging, Dr. Watson, Education and Research, Escalation Engineering, Fun with Crash Dumps, Futuristic Memory Dump Analysis, GDB for WinDbg Users, Hardware, History, Horrors of Computation, Hyper-V, Intelligent Memory Movement, Kernel Development, Laws of Troubleshooting and Debugging, Mathematics of Debugging, Memiotics (Memory Semiotics), Memoidealism, Memoretics, Memory Analysis Culture, Memory Analysis Forensics and Intelligence, Memory Auralization, Memory Dump Analysis Jobs, Memory Religion (Memorianity), Memory Space Art, Memory Space Music, Memory Systems Language, Memory Visualization, Memuonics, Minidump Analysis, Multithreading, Music for Debugging, Music of Computation, New Acronyms, New Words, Occult Debugging, Philosophy, Psi-computation, Publishing, Science of Memory Dump Analysis, Science of Software Tracing, Security, Software Architecture, Software Defect Construction, Software Engineering, Software Generalist, Software Maintenance Institute, Software Narratology, Software Technical Support, Software Trace Analysis, Software Trace Visualization, Software Tracing for Dummies, Software Victimology, Stack Trace Collection, Testing, Tools, Trace Analysis Patterns, Training and Seminars, Troubleshooting Methodology, Victimware, Virtualization, Vista, Visual Dump Analysis, WinDbg Scripts, WinDbg Tips and Tricks, WinDbg for GDB Users, Windows 7, Windows Server 2008, Windows System Administration | No Comments »
Monday, April 5th, 2010
I’m very pleased to announce that the Korean edition is available:

The book can be found on:
- Dmitry Vostokov @ DumpAnalysis.org + TraceAnalysis.org -
Posted in Announcements, AntiPatterns, Assembly Language, Books, Books (Korean), C and C++, Computer Science, Crash Dump Analysis, Crash Dump Patterns, Crash Dumps for Dummies, Debugging, Dr. Watson, Escalation Engineering, Fun with Crash Dumps, GDB for WinDbg Users, Hardware, Kernel Development, Mathematics of Debugging, Memiotics (Memory Semiotics), Memoretics, Memory Space Music, Memory Visualization, Minidump Analysis, Multithreading, Publishing, Science of Memory Dump Analysis, Security, Software Architecture, Software Engineering, Software Technical Support, Testing, Tools, Troubleshooting Methodology, Virtualization, Vista, WinDbg Scripts, WinDbg Tips and Tricks, WinDbg for GDB Users, Windows Server 2008, Windows System Administration | No Comments »
Monday, March 22nd, 2010
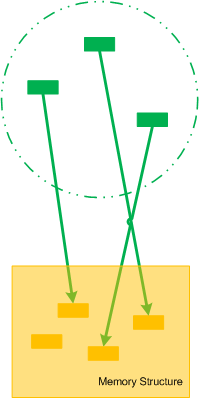
Let’s now introduce collective pointers or pointer cones. Suppose we have a set of pointers pointing to fields of some memory structure. This set of pointers could be another structure as well or just a collection of pointers that can be logically brought together:
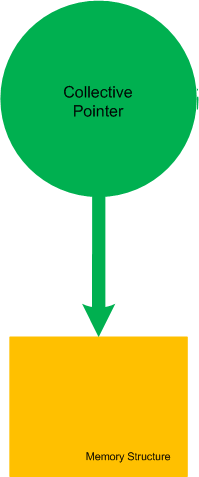
If we make the boundary opaque we can name such set of pointers as Collective Pointer (or Pointer Cone):
Another example is when we split the perception field of a pointer into disjoint collective pointers (the perception field as a whole is already a trivial collective pointer):

- Dmitry Vostokov @ DumpAnalysis.org + TraceAnalysis.org -
Posted in Categorical Debugging, Mathematics of Debugging, Memoretics, Science of Memory Dump Analysis | No Comments »
Saturday, February 27th, 2010
This post was motivated during my work on a memory dump differing tool called DumpLogic that can do logical and arithmetic operations between memory snapshots, for example, take a difference between them for further visualization. This tool is forthcoming next week and it resulted in another simple tool called DumpFilter. The latter allows to filter certain unsigned integer (DWORD) values from a memory dump (or any binary file) by replacing them with 0xFFFFFFFF and all other values with 0×00000000. The resultant binary file can be visualized by any data visualization package or transformed to a bitmap file using Dump2Picture to see distribution of filtered values.
As a filtering example I used TestDefaultDebugger64 to generate a process user memory dump. It was converted to a BMP file by Dump2Picture:
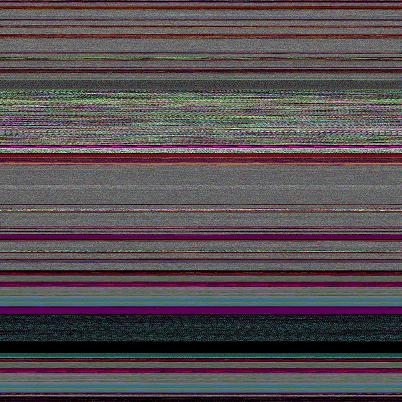
Then I filtered only AV exception code 0xc0000005:
C:\>DumpFilter tdd64.dmp tdd64.bin <dwords.txt
dwords.txt just contained one line
c0000005
It is possible to filter many values. Just put more lines to dwords.txt file. tdd64.bin was converted to tdd64.bmp by Dump2Picture:
C:\>Dump2Picture tdd64.bin tdd64.bmp
Because the image had only black and while RGBA colors I saved it as a B/W bitmap (click to enlarge, it is a 3236×3236 1.3Mb bitmap):

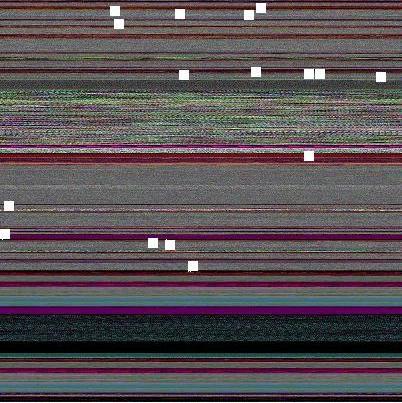
Every EV exception code is a white dot there but it is difficult to see them unless magnified. So I enlarged them manually on the following map:

I put them on the original image too. We can see that exception processing spans many areas:
The tool and the sample dwords.txt file (for c0000005 and 80000003) can be downloaded from this location:
Download DumpFilter
Another example: Night Sky memory space art image is just a fragment after filtering all 1 values from another process memory dump.
- Dmitry Vostokov @ DumpAnalysis.org + TraceAnalysis.org -
Posted in Crash Dump Analysis, Crash Dump Patterns, Fun with Crash Dumps, Memoretics, Memory Visualization, Science of Memory Dump Analysis, Tools | No Comments »
Thursday, February 11th, 2010
This is a revised, edited, cross-referenced and thematically organized volume of selected DumpAnalysis.org blog posts about crash dump analysis and debugging written in July 2009 - January 2010 for software engineers developing and maintaining products on Windows platforms, quality assurance engineers testing software on Windows platforms and technical support and escalation engineers dealing with complex software issues. The fourth volume features:
- 13 new crash dump analysis patterns
- 13 new pattern interaction case studies
- 10 new trace analysis patterns
- 6 new Debugware patterns and case study
- Workaround patterns
- Updated checklist
- Fully cross-referenced with Volume 1, Volume 2 and Volume 3
- New appendixes
Product information:
- Title: Memory Dump Analysis Anthology, Volume 4
- Author: Dmitry Vostokov
- Language: English
- Product Dimensions: 22.86 x 15.24
- Paperback: 410 pages
- Publisher: Opentask (30 March 2010)
- ISBN-13: 978-1-906717-86-5
- Hardcover: 410 pages
- Publisher: Opentask (30 April 2010)
- ISBN-13: 978-1-906717-87-2

Back cover features memory space art image: Internal Process Combustion.
- Dmitry Vostokov @ DumpAnalysis.org + TraceAnalysis.org -
Posted in .NET Debugging, Aesthetics of Memory Dumps, Announcements, AntiPatterns, Art, Assembly Language, Books, C and C++, CDA Pattern Classification, CDF Analysis Tips and Tricks, Categorical Debugging, Certification, Citrix, Code Reading, Common Mistakes, Computer Science, Countefactual Debugging, Crash Analysis Report Environment (CARE), Crash Dump Analysis, Crash Dump Patterns, Crash Dumps for Dummies, DebugWare Patterns, Debugging, Debugging Slang, Education and Research, Escalation Engineering, Fun with Crash Dumps, Games for Debugging, Hardware, Horrors of Computation, Hyper-V, Kernel Development, Laws of Troubleshooting and Debugging, Mathematics of Debugging, Memiotics (Memory Semiotics), Memoidealism, Memoretics, Memory Analysis Culture, Memory Analysis Forensics and Intelligence, Memory Dreams, Memory Dump Analysis Jobs, Memory Dumps in Movies, Memory Space Art, Memory Visualization, Memuonics, Minidump Analysis, Multithreading, Music for Debugging, New Acronyms, New Words, Opcodism, Philosophy, Physicalist Art, Publishing, Science Fiction, Science of Memory Dump Analysis, Science of Software Tracing, Security, Software Architecture, Software Defect Construction, Software Engineering, Software Generalist, Software Maintenance Institute, Software Narratology, Software Technical Support, Software Trace Analysis, Software Trace Visualization, Software Tracing for Dummies, Software Victimology, Stack Trace Collection, Testing, Tools, Trace Analysis Patterns, Training and Seminars, Troubleshooting Methodology, Victimware, Virtualization, Vista, Visual Dump Analysis, WinDbg Scripts, WinDbg Tips and Tricks, WinDbg for GDB Users, Windows 7, Windows Server 2008, Windows System Administration, Workaround Patterns | No Comments »
Tuesday, January 26th, 2010
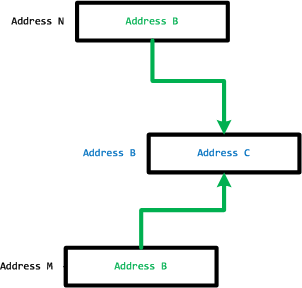
In part 1 we defined MemP category and the operating field of a pointer as its link to a memory location it is pointing to. This operating field value can be in a different pseudo-memory plane if its value is outside memory bounds, for example, 8FFFFFF0 for a memory with the highest possible address 7FFFFFFF:

We define the closure of memory as the smallest MemP category that includes memory for operating fields of every pointer for the current memory snapshot. For example above, by adding another memory location that has a pointer value pointing back to the original memory region we have the following operating closure:

We can also add more memory as well:

- Dmitry Vostokov @ DumpAnalysis.org + TraceAnalysis.org -
Posted in Categorical Debugging, Mathematics of Debugging, Memoretics, Science of Memory Dump Analysis | No Comments »
Friday, January 8th, 2010
I started applying category theory (as an alternative to traditional set-theoretic approach of memory bits) to memory dump analysis, debugging and software trace analysis in parallel to my studies of that branch of mathematics and reading the book Memory Evolutive Systems. In addition to complex systems modelled in the latter book I apply evolutive systems approach to computer memory. Here is a picture illustrating MemD category of memory dumps (snapshots) as category objects and category arrows as different ways in arriving at the same memory picture:
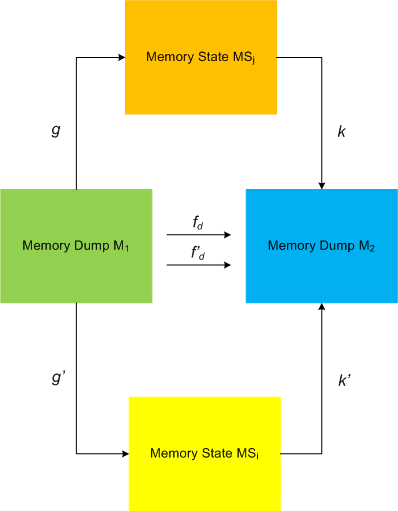
This category definitely applies to software traces as well if we consider every individual trace message or statement as a minidump. We currently consider software trace category MemT as a subcategory of MemD.
Configuration category of a computer memory dump represents its memory internals at an instant t (ideal memory dumps) or at a time interval T: components and links, pointers, wait chains, causal relations, data flows, … .
Pointers and their links are also objects and arrows to form a category, called MemP(tr). The following picture illustrates it with the last pointer shown as a dereference fixpoint:
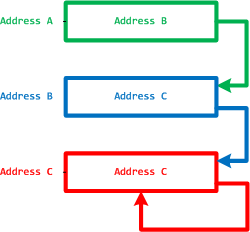
The perception field of a pointer is a category of all links to its memory location:
However, the operating field of a pointer is its link to a memory location it is pointing to.
- Dmitry Vostokov @ DumpAnalysis.org -
Posted in Categorical Debugging, Mathematics of Debugging, Memoretics, Memory Visualization, Philosophy, Science of Memory Dump Analysis, Science of Software Tracing | 3 Comments »
Sunday, December 20th, 2009
“Memory dumps are facts.”
I’m very excited to announce that Volume 3 is available in paperback, hardcover and digital editions:
Memory Dump Analysis Anthology, Volume 3
Table of Contents
In two weeks paperback edition should also appear on Amazon and other bookstores. Amazon hardcover edition is planned to be available in January 2010.
The amount of information was so voluminous that I had to split the originally planned volume into two. Volume 4 should appear by the middle of February together with Color Supplement for Volumes 1-4.
- Dmitry Vostokov @ DumpAnalysis.org -
Posted in .NET Debugging, Aesthetics of Memory Dumps, Announcements, AntiPatterns, Art, Assembly Language, Books, Bugtations, C and C++, CDA Pattern Classification, CDF Analysis Tips and Tricks, Certification, Citrix, Code Reading, Common Mistakes, Computer Science, Crash Dump Analysis, Crash Dump Patterns, Crash Dumps for Dummies, DebugWare Patterns, Debugging, Debugging Slang, Deep Down C++, Education and Research, Escalation Engineering, Fun with Crash Dumps, Hardware, Horrors of Computation, Kernel Development, Mathematics of Debugging, Memiotics (Memory Semiotics), Memoidealism, Memoretics, Memory Analysis Culture, Memory Analysis Forensics and Intelligence, Memory Space Art, Memory Visualization, Minidump Analysis, Multithreading, Philosophy, Poetry, Publishing, Science of Memory Dump Analysis, Science of Software Tracing, Security, Software Architecture, Software Defect Construction, Software Engineering, Software Narratology, Software Technical Support, Software Trace Analysis, Software Trace Visualization, Software Tracing for Dummies, Software Victimology, Stack Trace Collection, Testing, Tools, Trace Analysis Patterns, Training and Seminars, Troubleshooting Methodology, Victimware, Virtualization, Vista, Visual Dump Analysis, WinDbg Scripts, WinDbg Tips and Tricks, WinDbg for GDB Users, Windows 7, Windows Server 2008, Windows System Administration | 1 Comment »
Thursday, December 17th, 2009
Previously announced Software Maintenance Institute was finally registered in Ireland (Reg. No. 400906) and its certificate was received yesterday.
Here is the current component structure of various institutions (depicted in UML):
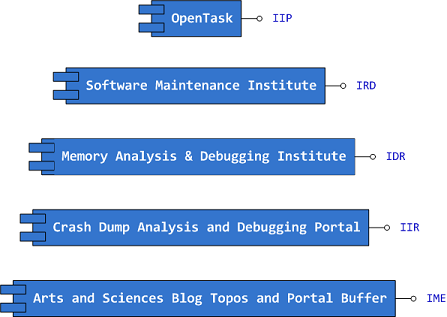
Interface Tags:
IIP Interface of Iterative Publishing

IRD Interface of Research and Development

IDR Interface of Defect Research

IIR Interface of Information Repository

IME Interface of Memetic Engineering
- Dmitry Vostokov @ DumpAnalysis.org -
Posted in Announcements, Art, Certification, Computer Science, Crash Dump Analysis, Debugging, Education and Research, Escalation Engineering, History, Memiotics (Memory Semiotics), Memoidealism, Memoretics, Memory Analysis Culture, Memory Analysis Forensics and Intelligence, Memory Auralization, Memory Visualization, Philosophy, Publishing, Science of Memory Dump Analysis, Science of Software Tracing, Security, Software Architecture, Software Engineering, Software Maintenance Institute, Software Technical Support, Software Trace Analysis, Software Victimology, Testing, Training and Seminars | No Comments »
Wednesday, December 16th, 2009
Finally, after the long delay, the issue is available in print on Amazon and through other sellers:
Debugged! MZ/PE: Software Tracing

- Dmitry Vostokov @ DumpAnalysis.org -
Posted in Announcements, Books, CDF Analysis Tips and Tricks, Computer Science, Crash Dump Analysis, Crash Dump Patterns, Debugged! MZ/PE, Debugging, Education and Research, Fun with Crash Dumps, Memoretics, Memory Visualization, Publishing, Science of Memory Dump Analysis, Science of Software Tracing, Software Technical Support, Software Trace Analysis, Software Trace Visualization, Testing, Tools, Trace Analysis Patterns, Training and Seminars, Troubleshooting Methodology, Visual Dump Analysis | 1 Comment »
Wednesday, November 11th, 2009
A nibble is a (0,1)-matrix, a byte is a cubic 0,1-lattice and the next cubic byte-boundary 0,1-lattice represents a 64-bit qword:

This is what I call a natural memory representation as memory building blocks or qubic memory (do not mistaken it with qubit memory). This elevates bytes and 64-bit quadruple words as natural addresses and shows that 32-bit addresses are unnatural.
This also allows to us to visualize certain overlapped memory patterns in dump files (same vertice, edge or side).
- Dmitry Vostokov @ DumpAnalysis.org -
Posted in Computer Science, Mathematics of Debugging, Memoretics, Memory Visualization, New Words, Science of Memory Dump Analysis | 2 Comments »
Tuesday, October 20th, 2009
Although everything changes in the philosophy of Heraclitus, its Urstoff, fire, is eternal, indestructable. The same can be said about Memory and its memory fragments. Memoidealism has also some proximity with the notion of everlasting existence of thought of or spoken named objects in the philosophy of Parmenides. Once we think of or speak of something we immediately recall a memory fragment from and, at the same time, commit it to Memory again, perhaps as a different memory fragment, an assembled new memory trace.
- Dmitry Vostokov @ DumpAnalysis.org -
Posted in Memoidealism, Metaphysics of Memory Worldview, Philosophy, Science of Memory Dump Analysis, Science of Software Tracing | No Comments »
Friday, October 16th, 2009
Memory Analysis and Debugging Institute (MA&DI), DA+TA Portal (DumpAnalysis.org + TraceAnalysis.org) and OpenTask establish
Software Maintenance Institute (SMI)
More details about R&D Institute of Software Maintenance will be announced soon.
- Dmitry Vostokov @ DumpAnalysis.org -
Posted in Announcements, Crash Dump Analysis, Debugging, Education and Research, Science of Memory Dump Analysis, Science of Software Tracing, Software Engineering, Software Maintenance Institute, Software Technical Support, Software Trace Analysis | 1 Comment »
Saturday, September 26th, 2009
This is a revised, edited, cross-referenced and thematically organized volume of selected DumpAnalysis.org blog posts about crash dump analysis and debugging written in October 2008 - June 2009 for software engineers developing and maintaining products on Windows platforms, quality assurance engineers testing software on Windows platforms and technical support and escalation engineers dealing with complex software issues. The third volume features:
- 15 new crash dump analysis patterns
- 29 new pattern interaction case studies
- Trace analysis patterns
- Updated checklist
- Fully cross-referenced with Volume 1 and Volume 2
- New appendixes
Product information:
- Title: Memory Dump Analysis Anthology, Volume 3
- Author: Dmitry Vostokov
- Language: English
- Product Dimensions: 22.86 x 15.24
- Paperback: 404 pages
- Publisher: Opentask (20 December 2009)
- ISBN-13: 978-1-906717-43-8
- Hardcover: 404 pages
- Publisher: Opentask (30 January 2010)
- ISBN-13: 978-1-906717-44-5

Back cover features 3D computer memory visualization image.
- Dmitry Vostokov @ DumpAnalysis.org -
Posted in Announcements, AntiPatterns, Art, Assembly Language, Books, C and C++, CDF Analysis Tips and Tricks, Certification, Citrix, Code Reading, Common Mistakes, Computational Ghosts and Bug Hauntings, Computer Science, Countefactual Debugging, Crash Dump Analysis, Crash Dump Patterns, Crash Dumps for Dummies, DebugWare Patterns, Debugging, Debugging Slang, Deep Down C++, Education and Research, Escalation Engineering, Fun with Crash Dumps, Futuristic Memory Dump Analysis, Games for Debugging, Hardware, Horrors of Computation, Hyper-V, Intelligent Memory Movement, Kernel Development, Mathematics of Debugging, Memiotics (Memory Semiotics), Memoidealism, Memoretics, Memory Analysis Culture, Memory Analysis Forensics and Intelligence, Memory Dreams, Memory Dump Analysis Jobs, Memory Space Music, Memory Visualization, Memuonics, Minidump Analysis, Multithreading, Music for Debugging, New Acronyms, New Words, Occult Debugging, Philosophy, Poetry, Psi-computation, Publishing, Science of Memory Dump Analysis, Science of Software Tracing, Security, Software Architecture, Software Defect Construction, Software Engineering, Software Generalist, Software Narratology, Software Technical Support, Software Trace Analysis, Software Tracing for Dummies, Testing, Tools, Trace Analysis Patterns, Training and Seminars, Troubleshooting Methodology, Virtualization, Vista, Visual Dump Analysis, WinDbg Scripts, WinDbg Tips and Tricks, WinDbg for GDB Users, Windows 7, Windows Server 2008, Windows System Administration | No Comments »