Minidump Analysis (Part 4)
Thursday, October 11th, 2007In part 3 we explored raw stack dumps. Now suppose we have a minidump with a stack trace that involves our product driver and due to some reason WinDbg doesn’t pick symbols automatically and shows the following stack trace and crash address that point to driver.sys module:
1: kd> kL

ChildEBP RetAddr

WARNING: Stack unwind information not available. Following frames may be wrong.

ba0fd0e4 bfabd64b driver+0×2df2a

ba0fd1c8 bf8b495d driver+0×1f64b

ba0fd27c bf9166ae win32k!NtGdiBitBlt+0×52d

ba0fd2d8 bf9168d0 win32k!TileWallpaper+0xd4

ba0fd2f8 bf826c83 win32k!xxxDrawWallpaper+0×50

ba0fd324 bf8651df win32k!xxxDesktopPaintCallback+0×48

ba0fd388 bf8280f3 win32k!xxxEnumDisplayMonitors+0×13a

ba0fd3d4 bf8283ab win32k!xxxInternalPaintDesktop+0×66

ba0fd3f8 80833bdf win32k!NtUserPaintDesktop+0×41

ba0fd3f8 7c9485ec nt!KiFastCallEntry+0xfc
1: kd> r

eax=000007d0 ebx=000007d0 ecx=00000086 edx=bfb371a3 esi=bc492000 edi=bfb3775b

eip=bfacbf2a esp=ba0fd0b8 ebp=ba0fd0e4 iopl=0 nv up ei pl nz na po nc

cs=0008 ss=0010 ds=0023 es=0023 fs=0030 gs=0000 efl=00010202

driver+0×2df2a:

bfacbf2a f3a5 rep movs dword ptr es:[edi],dword ptr [esi] es:0023:bfb3775b=e4405a64 ds:0023:bc492000=????????
We can get timestamp of this module too:
1: kd> lmv m driver

start    end        module name

bfa9e000 bfb42a00   driver   T (no symbols)

    Loaded symbol image file: driver.sys

    Image path: driver.sys

    Image name: driver.sys

    Timestamp:        Thu Mar 01 20:50:04 2007 (45E73C7C)

    CheckSum:         000A5062

    ImageSize:        000A4A00

    Translations:     0000.04b0 0000.04e0 0409.04b0 0409.04e0
We see that no symbols for driver.sys were found and this is also indicated by the absence of function names and huge code offsets like 0×2df2a. Perhaps we don’t have a symbol server and store our symbol files somewhere. Or we got symbols from the developer of the recent fix that bugchecks and we want to apply them. In any case if we add a path to Symbol Search Path dialog (File -> Symbol File Path …) or use .sympath WinDbg command
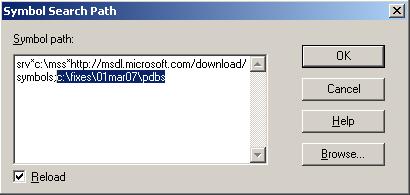
we are able to get better stack trace and crash point:
1: kd> .reload

Loading Kernel Symbols

...

Loading User Symbols

Loading unloaded module list

...

Unable to load image driver.sys, Win32 error 0n2

*** WARNING: Unable to verify timestamp for driver.sys
1: kd> kL

ChildEBP RetAddr

ba0fd0c0 bfabc399 driver!ProcessBytes+0×18

ba0fd0e4 bfabd64b driver!ProcessObject+0xc9

ba0fd1c8 bf8b495d driver!CacheBitBlt+0×13d

ba0fd27c bf9166ae win32k!NtGdiBitBlt+0×52d

ba0fd2d8 bf9168d0 win32k!TileWallpaper+0xd4

ba0fd2f8 bf826c83 win32k!xxxDrawWallpaper+0×50

ba0fd324 bf8651df win32k!xxxDesktopPaintCallback+0×48

ba0fd388 bf8280f3 win32k!xxxEnumDisplayMonitors+0×13a

ba0fd3d4 bf8283ab win32k!xxxInternalPaintDesktop+0×66

ba0fd3f8 80833bdf win32k!NtUserPaintDesktop+0×41

ba0fd3f8 7c9485ec nt!KiFastCallEntry+0xfc
1: kd> r

eax=000007d0 ebx=000007d0 ecx=00000086 edx=bfb371a3 esi=bc492000 edi=bfb3775b

eip=bfacbf2a esp=ba0fd0b8 ebp=ba0fd0e4 iopl=0 nv up ei pl nz na po nc

cs=0008 ss=0010 ds=0023 es=0023 fs=0030 gs=0000 efl=00010202

driver!ProcessBytes+0×18:

bfacbf2a f3a5 rep movs dword ptr es:[edi],dword ptr [esi] es:0023:bfb3775b=e4405a64 ds:0023:bc492000=????????
Because WinDbg reports that it was unable to verify timestamp for driver.sys we might want to double check the return address saved when ProcessBytes function was called. If symbols are correct then disassembling the return address backwards will most likely show ProcessObject function code and “call” instruction with ProcessBytes address. Unfortunately minidumps don’t have code except for the currently executing function:
1: kd> ub bfabc399

                 ^ Unable to find valid previous instruction for 'ub bfabc399'
1: kd> uf driver!ProcessObject

No code found, aborting
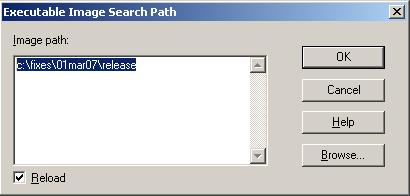
Therefore we need to point WinDbg to our driver.sys which contains executable code. This can be done by specifying a path in Executable Image Search Path dialog (File -> Image File Path …) or using .exepath WinDbg command.
Now we get more complete stack trace and we are able to double check the return address:
1: kd> .reload

Loading Kernel Symbols

...

Loading User Symbols

Loading unloaded module list

...
1: kd> kL

ChildEBP RetAddr

ba0fd0c0 bfabc399 driver!ProcessBytes+0×18

ba0fd0e4 bfabd64b driver!ProcessObject+0xc9

ba0fd104 bfac5aac driver!CacheBitBlt+0×13d

ba0fd114 bfac6840 driver!ProcessCommand+0×150

ba0fd140 bfac1878 driver!CheckSurface+0×258

ba0fd178 bfaba0ee driver!CopyBitsEx+0xfa

ba0fd1c8 bf8b495d driver!DrvCopyBits+0xb6

ba0fd27c bf9166ae win32k!NtGdiBitBlt+0×52d

ba0fd2d8 bf9168d0 win32k!TileWallpaper+0xd4

ba0fd2f8 bf826c83 win32k!xxxDrawWallpaper+0×50

ba0fd324 bf8651df win32k!xxxDesktopPaintCallback+0×48

ba0fd388 bf8280f3 win32k!xxxEnumDisplayMonitors+0×13a

ba0fd3d4 bf8283ab win32k!xxxInternalPaintDesktop+0×66

ba0fd3f8 80833bdf win32k!NtUserPaintDesktop+0×41

ba0fd3f8 7c9485ec nt!KiFastCallEntry+0xfc
1: kd> ub bfabc399

driver!ProcessObject+0xb7:

bfabc387 57              push    edi

bfabc388 40              inc     eax

bfabc389 50              push    eax

bfabc38a e861fb0000      call    driver!convert (bfacbef0)

bfabc38f ff7508          push    dword ptr [ebp+8]

bfabc392 57              push    edi

bfabc393 50              push    eax

bfabc394 e879fb0000      call    driver!ProcessBytes (bfacbf12)
- Dmitry Vostokov @ DumpAnalysis.org -