Archive for the ‘DebugWare Patterns’ Category
Wednesday, October 21st, 2009
The domain of some troubleshooting and debugging tools sometimes spans several computers, for example, a client, a server, and a middleware server (or a frontware server like a web server). Because such tools are small, there is no need to devise yet another distributed architecture but force the tool to differentiate its functionality based on a command line parameters. For example, the following tool implements Checklist pattern and chooses the right checklist from a checklist repository based on a command line option:
c:\> GreatTool -client
c:\> GreatTool -server
This nicely fits with a case when a server is also a client to another server and we need to troubleshoot its client and server functionality on the same physical computer.
- Dmitry Vostokov @ DumpAnalysis.org -
Posted in DebugWare Patterns, Debugging, Software Architecture, Software Engineering, Software Technical Support, Tools | 1 Comment »
Tuesday, October 20th, 2009
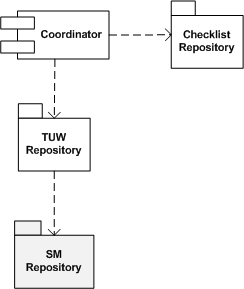
Many troubleshooting tools and their components (like TUW modules from checklists) reuse the same code over and over, for example, querying registry keys or environment variables. It is beneficial to have a package of supporting modules (or a library) for code reuse purposes, hence the name of this pattern, Supporting Module (SM). In the context of Checklist pattern we can refine its UML component diagram to highlight that TUWs are using some shared SM components:
- Dmitry Vostokov @ DumpAnalysis.org -
Posted in DebugWare Patterns, Debugging, Software Architecture, Software Engineering, Software Technical Support, Tools | No Comments »
Saturday, September 26th, 2009
This is a revised, edited, cross-referenced and thematically organized volume of selected DumpAnalysis.org blog posts about crash dump analysis and debugging written in October 2008 - June 2009 for software engineers developing and maintaining products on Windows platforms, quality assurance engineers testing software on Windows platforms and technical support and escalation engineers dealing with complex software issues. The third volume features:
- 15 new crash dump analysis patterns
- 29 new pattern interaction case studies
- Trace analysis patterns
- Updated checklist
- Fully cross-referenced with Volume 1 and Volume 2
- New appendixes
Product information:
- Title: Memory Dump Analysis Anthology, Volume 3
- Author: Dmitry Vostokov
- Language: English
- Product Dimensions: 22.86 x 15.24
- Paperback: 404 pages
- Publisher: Opentask (20 December 2009)
- ISBN-13: 978-1-906717-43-8
- Hardcover: 404 pages
- Publisher: Opentask (30 January 2010)
- ISBN-13: 978-1-906717-44-5

Back cover features 3D computer memory visualization image.
- Dmitry Vostokov @ DumpAnalysis.org -
Posted in Announcements, AntiPatterns, Art, Assembly Language, Books, C and C++, CDF Analysis Tips and Tricks, Certification, Citrix, Code Reading, Common Mistakes, Computational Ghosts and Bug Hauntings, Computer Science, Countefactual Debugging, Crash Dump Analysis, Crash Dump Patterns, Crash Dumps for Dummies, DebugWare Patterns, Debugging, Debugging Slang, Deep Down C++, Education and Research, Escalation Engineering, Fun with Crash Dumps, Futuristic Memory Dump Analysis, Games for Debugging, Hardware, Horrors of Computation, Hyper-V, Intelligent Memory Movement, Kernel Development, Mathematics of Debugging, Memiotics (Memory Semiotics), Memoidealism, Memoretics, Memory Analysis Culture, Memory Analysis Forensics and Intelligence, Memory Dreams, Memory Dump Analysis Jobs, Memory Space Music, Memory Visualization, Memuonics, Minidump Analysis, Multithreading, Music for Debugging, New Acronyms, New Words, Occult Debugging, Philosophy, Poetry, Psi-computation, Publishing, Science of Memory Dump Analysis, Science of Software Tracing, Security, Software Architecture, Software Defect Construction, Software Engineering, Software Generalist, Software Narratology, Software Technical Support, Software Trace Analysis, Software Tracing for Dummies, Testing, Tools, Trace Analysis Patterns, Training and Seminars, Troubleshooting Methodology, Virtualization, Vista, Visual Dump Analysis, WinDbg Scripts, WinDbg Tips and Tricks, WinDbg for GDB Users, Windows 7, Windows Server 2008, Windows System Administration | No Comments »
Thursday, September 24th, 2009
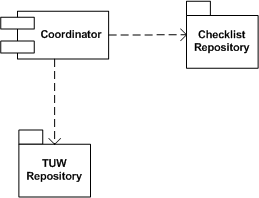
Real troubleshooting is usually done by combining several units of work chosen from a manual. Checklist pattern summarizes this recurrent practice. Checklist Coordinator orchestrates troubleshooting units of work (TUWs) components from TUW Repository according to checklists from Checklist Repository (in the simple case it can be just one checklist). This is illustrated on the following UML component diagram:
- Dmitry Vostokov @ DumpAnalysis.org -
Posted in DebugWare Patterns, Debugging, Software Architecture, Software Technical Support, Tools, Troubleshooting Methodology | 2 Comments »
Monday, September 21st, 2009
Troubleshooting Unit of Work is another pattern frequently used in manual troubleshooting and debugging. This is usually some independent and self-sufficient list of steps to perform to check something from a troubleshooting checklist or a manual and can be implemented as a separate loadable module, a class to reuse or a function to call. Output from such units of work can be stored in a blackboard system or processed by tools implementing Checklist DebugWare pattern. Typical example is an implementation of the following document:
Required Permissions and Rights for the Ctx_CpsvcUser Account
as a tool:
CTX_CpsvcUser Re-creation Tool for 32-Bit and 64-Bit Versions of Presentation Server 4.5
- Dmitry Vostokov @ DumpAnalysis.org -
Posted in DebugWare Patterns, Debugging, Software Architecture, Software Technical Support, Tools, Troubleshooting Methodology | 3 Comments »
Thursday, September 10th, 2009
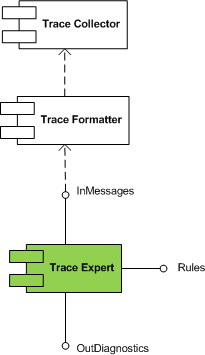
Trace Expert pattern came to my mind when I was writing about software trace patterns. It is a very lightweight expert system relying on trace collector and trace formatter (patterns to be written about soon). It is a module that takes a preformatted software trace message file or a buffer and a set of built in rules and uses simple search (peharps involving regular expressions) to dig out diagnostic information and provide troubleshooting and debugging directions.
This module is schematically depicted on the following UML component diagram:
- Dmitry Vostokov @ DumpAnalysis.org -
Posted in DebugWare Patterns, Debugging, Software Architecture, Software Technical Support, Software Trace Analysis, Tools, Trace Analysis Patterns, Troubleshooting Methodology | No Comments »
Wednesday, August 12th, 2009
Previously introduced RADII software development process acquires definite shape as a product supportability driven software support tools development process. In summary, supportability of a product gives rise to Requirements, they expand into Architecture segments, then into Design segments, then into Implementation segments, and finally, into several Improvement phases. In short, RADII:
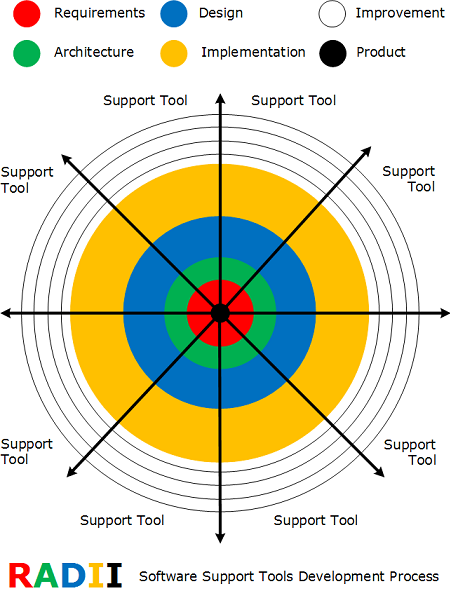
Every segment is a separate troubleshooting or debugging tool. All segments share elements of RADII via DebugWare patterns and can be further refined via iterative and incremental SDLC if needed.
- Dmitry Vostokov @ DumpAnalysis.org -
Posted in Announcements, DebugWare Patterns, Software Architecture, Software Engineering, Tools | 1 Comment »
Saturday, July 4th, 2009
Supportability is similar to serviceability and while working on DebugWare book I realized that writing support tools needs its own buzz word like model-driven software design. Hence SDSD acronym was born a few days ago:
SDSD
Supportability-Driven Software Design
or
Support-Driven Software Design
or
Serviceability-Driven Software Design
Thinking about where to insert requirements, architecture and design led me to another acronym:
RADII
Requirements, Architecture, Design, Implementation and Improvement
The plural form of radius signifies the fact that there is a plurality of ways how SDLC can be implemented. Improvement is similar to Maintenance.
- Dmitry Vostokov @ DumpAnalysis.org -
Posted in DebugWare Patterns, New Acronyms, Software Architecture, Software Engineering, Software Technical Support, Tools | 1 Comment »
Saturday, October 18th, 2008
Paperback edition of Memory Dump Analysis Anthology, Volume 2 is finally available on Amazon and Barnes & Noble. Search Inside is also available on Amazon. In addition, I updated the list of recommended books:
Listmania! Crash Dump Analysis and Debugging
Hardcover edition will be available on Amazon and B&N in 2-3 weeks.
- Dmitry Vostokov @ DumpAnalysis.org -
Posted in Announcements, Assembly Language, Books, Bugchecks Depicted, CDF Analysis Tips and Tricks, Certification, Citrix, Common Mistakes, Crash Dump Analysis, Crash Dump Patterns, Crash Dumps for Dummies, Data Recovery, DebugWare Patterns, Debugging, Fun with Crash Dumps, Hardware, Kernel Development, Memory Analysis Forensics and Intelligence, Memory Dump Analysis Jobs, Memory Visualization, Minidump Analysis, Music for Debugging, New Words, Philosophy, Publishing, Science of Memory Dump Analysis, Security, Software Architecture, Software Technical Support, Stack Trace Collection, Testing, Tools, Training and Seminars, Troubleshooting Methodology, Virtualization, Vista, WinDbg Scripts, WinDbg Tips and Tricks, WinDbg for GDB Users, Windows Server 2008 | No Comments »
Friday, October 3rd, 2008
“Everything is memory dump.”
I’m very excited to announce that Volume 2 is available in paperback, hardcover and digital editions:
Memory Dump Analysis Anthology, Volume 2
In one or two weeks paperback edition should also appear on Amazon and other bookstores. Amazon hardcover edition is planned to be available by the end of October.
I’m often asked when Volume 3 is available and I currently plan to release it in October - November, 2009. In the mean time I’m planning to concentrate on other publishing projects.
- Dmitry Vostokov @ DumpAnalysis.org -
Posted in Announcements, Assembly Language, Books, Bugchecks Depicted, CDF Analysis Tips and Tricks, Citrix, Common Mistakes, Crash Dump Analysis, Crash Dump Patterns, Crash Dumps for Dummies, Data Recovery, DebugWare Patterns, Debugging, Fun with Crash Dumps, Kernel Development, Memory Analysis Forensics and Intelligence, Memory Dump Analysis Jobs, Memory Visualization, Minidump Analysis, Music for Debugging, New Words, Philosophy, Publishing, Science of Memory Dump Analysis, Security, Software Architecture, Software Technical Support, Stack Trace Collection, Testing, Tools, Training and Seminars, Troubleshooting Methodology, Virtualization, Vista, WinDbg Scripts, WinDbg Tips and Tricks, WinDbg for GDB Users, Windows Server 2008 | No Comments »
Wednesday, October 1st, 2008
The book is nearly finished and here is the final TOC:
Memory Dump Analysis Anthology, Volume 2: Table of Contents
- Dmitry Vostokov @ DumpAnalysis.org -
Posted in Announcements, Assembly Language, Books, Bugchecks Depicted, CDF Analysis Tips and Tricks, Citrix, Common Mistakes, Crash Dump Analysis, Crash Dump Patterns, Crash Dumps for Dummies, Data Recovery, DebugWare Patterns, Debugging, Fun with Crash Dumps, Kernel Development, Memory Dump Analysis Jobs, Memory Visualization, Minidump Analysis, Music for Debugging, Publishing, Science of Memory Dump Analysis, Security, Software Technical Support, Stack Trace Collection, Tools, Troubleshooting Methodology, Virtualization, Vista, WinDbg Scripts, WinDbg Tips and Tricks, WinDbg for GDB Users, Windows Server 2008 | No Comments »
Friday, September 26th, 2008
Here you can find the draft TOC for the forthcoming book “DebugWare: The Art and Craft of Writing Troubleshooting and Debugging Tools”:
Table of Contents
- Dmitry Vostokov @ DumpAnalysis.org -
Posted in Announcements, Books, DebugWare Patterns, Debugging, Publishing, Software Architecture, Software Technical Support, Tools | No Comments »
Monday, September 15th, 2008
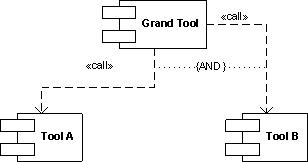
Another pattern that logically flows from Tool Chain is called Tool Box. Their principal difference is that the former launches subordinated tools in a sequence to reach the common goal and the latter is the tool that launches other tools in any sequence independently:
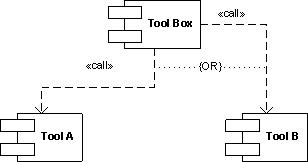
Often tool boxes are implemented as toolbars. Another boundary example is the so called resource kit tools where an HTML page or taskbar menu serves the role of tool box.
- Dmitry Vostokov @ DumpAnalysis.org -
Posted in DebugWare Patterns, Debugging, Software Architecture, Software Technical Support, Tools | No Comments »
Friday, September 12th, 2008
Usually after writing and using a tool we think about an extension of it or we find another tool that is suitable as that extension. In such cases it is better to reuse existing components and adapt the former tool to use the latter. Tool Chain is a good pattern name here. A programming analogy could be a compiler and linker:
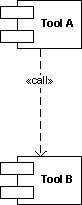
Typical example could be a logging tool that now acquires log viewer functionality by implementing a button that launches a separate log viewer or vice versa, a log viewer that can now do logging. Another simple example is a command file that launches different tools in a sequence. The tools might not be related by the data they produce and operate upon: this not the same as well-known architectural Filters and Pipes pattern. What is important is the fact that tools are related buy overall tool chain goal, for example, to debug problems by recording and analyzing log files or monitor some process activity and periodically create memory dumps:
- Dmitry Vostokov @ DumpAnalysis.org -
Posted in DebugWare Patterns, Debugging, Software Architecture, Software Technical Support, Tools | 1 Comment »
Sunday, August 10th, 2008
Good troubleshooting tools usually have two interfaces: one is graphical (GUI) and the other is command line (CLI). The latter is very useful when GUI console is not available or there is a need to automate the tool. Both interfaces can be implemented in one component:
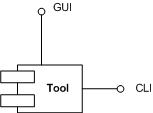
or there could be a separate GUI wrapper for complex CUI interface or when CUI interface was developed earlier and we don’t want to touch tool code (see Tool Façade pattern). Therefore this common pattern is called Dual Interface. Some tool examples:
Gflags
CDFControl
SystemDump
- Dmitry Vostokov @ DumpAnalysis.org -
Posted in DebugWare Patterns, Debugging, Software Architecture, Software Technical Support, Tools | No Comments »
Monday, August 4th, 2008
Many products have lots of configuration parameters stored in OS configuration database, Windows registry. Some of parameters are internal and some are public but never exposed via product GUI or management consoles. Configuration parameters can be related to product functionality or can make troubleshooting and debugging easier, for example, additional tracing parameters to set the verbosity level of debugging output or enable additional safety checks. These parameters can be scattered across different registry branches or keys. Therefore another pattern frequently seen in troubleshooting and debugging tools is called:
Configuration Wrapper
Here excellent example is Microsoft tool:
Gflags
- Dmitry Vostokov @ DumpAnalysis.org -
Posted in DebugWare Patterns, Debugging, Software Architecture, Software Technical Support, Tools | No Comments »
Sunday, July 20th, 2008
Next pattern is called
Tool Façade (or Tool Facade)
It is used when there is a tool with a cumbersome interface like command line with many options and there is a need for a better and easier to use interface, for example, GUI. This can be illustrated on the following UML component diagram:
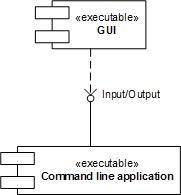
Excellent example of this pattern is:
StressPrinters
designed as a GUI wrapper around command line tool AddPrinter. Adding the powerful GUI interface allowed to extend its functionality and even find new domains, like testing, where the tool can be used. Excellent information about this tool can be found in the article:
Understanding and using Citrix StressPrinters
- Dmitry Vostokov @ DumpAnalysis.org -
Posted in DebugWare Patterns, Debugging, Software Architecture, Software Technical Support, Tools | 4 Comments »
Saturday, July 19th, 2008
These are patterns for troubleshooting and debugging tools: solutions for common recurrent problems. Forthcoming book
DebugWare: The Art and Craft of Writing Troubleshooting Tools
which I’m writing with Kapildev Ramlal, the author of several Citrix tools, will discuss them in sufficient detail. The first pattern is named:
API Query
Software products use various API and external interfaces to query data or get notifications from operating system environment. Their behaviour depends on API return values or output parameters that are not always logged or logged with insufficient detail. In order to reproduce or diagnose problems an engineer can write a small API Query tool that will periodically or asynchronously query the same set of API and log their input and output data. If the problem happens with the product at some point this additional log will help in problem identification and resolution.
Examples:
TSUserLog
WindowHistory
I’ve set up a dedicated page for DebugWare patterns:
http://www.dumpanalysis.org/blog/index.php/debugware-patterns/
- Dmitry Vostokov @ DumpAnalysis.org -
Posted in Announcements, DebugWare Patterns, Debugging, Software Technical Support, Tools | 3 Comments »