Archive for the ‘Debugging’ Category
Thursday, March 22nd, 2012
A page to reference all different kinds of patterns related to memory dumps as a whole and their properties is necessary, so I created this post:
I’ll update it as soon as I add more similar patterns.
- Dmitry Vostokov @ DumpAnalysis.org + TraceAnalysis.org -
Posted in Crash Dump Analysis, Crash Dump Patterns, Debugging | No Comments »
Tuesday, March 20th, 2012
This is a binary opposition counterpart to Early Crash Dump pattern called Late Crash Dump. It is usually saved after patterns representing a problem such as an exception thread stack trace are already gone. Most often we see one thread with process termination functions (Special Stack Trace pattern):
0:000> ~*k

ChildEBP RetAddr

0037fcf0 770bd55c ntdll!ZwTerminateProcess+0x12

0037fd0c 750f79f4 ntdll!RtlExitUserProcess+0x85

0037fdf8 750f339a kernel32!ExitProcessStub+0x12

0037fe04 770a9ef2 kernel32!BaseThreadInitThunk+0xe

0037fe44 770a9ec5 ntdll!__RtlUserThreadStart+0x70

0037fe5c 00000000 ntdll!_RtlUserThreadStart+0x1b
0:000> ~*k

ChildEBP RetAddr

0032faf0 77a9d55c ntdll!ZwTerminateProcess+0x12

0032fb0c 775579f4 ntdll!RtlExitUserProcess+0x85

0032fb20 74ac1720 kernel32!ExitProcessStub+0x12

0032fb28 74ac1a03 msvcr80!__crtExitProcess+0x14

0032fb64 74ac1a4b msvcr80!_cinit+0x101

0032fb74 01339bb3 msvcr80!exit+0xd

0032fbf8 7755339a App!__tmainCRTStartup+0x155

0032fc04 77a89ef2 kernel32!BaseThreadInitThunk+0xe

0032fc44 77a89ec5 ntdll!__RtlUserThreadStart+0x70

0032fc5c 00000000 ntdll!_RtlUserThreadStart+0x1b
However, sometimes, it is possible to see some execution residue left on a raw stack such as hidden exceptions, module hints, error codes and handled exceptions that might shed light on possible causes.
Another variant is when a memory dump is saved after a problem message box is dismissed or potentially disastrous exceptions such as access violations are handled and ignored to the fault in exception handling mechanism or severe corruption resuted in unresponsive process (hang).
- Dmitry Vostokov @ DumpAnalysis.org + TraceAnalysis.org -
Posted in Crash Dump Analysis, Crash Dump Patterns, Debugging | No Comments »
Tuesday, March 20th, 2012
The previous definition of software narratology was restricted to software traces and logs (the top left quadrant on a software narrative square, also the part of Memoretics which studies memory snapshots). Now, with the broadening of the domain of software narratology to the whole world of software narrative stories including actor interactions with software in construction requirements use cases and post-construction incidents we give another definition:
Software narrative is a representation of software events and changes of state. Software Narratology is a discipline that studies such software narratives (software narrative science).
- Dmitry Vostokov @ DumpAnalysis.org + TraceAnalysis.org -
Posted in Announcements, Cloud Computing, Code Reading, Computer Forensics, Computer Science, Crash Dump Analysis, Crash Dump Patterns, Debugging, Memoretics, Science of Memory Dump Analysis, Science of Software Tracing, Software Behavior DNA, Software Behavior Patterns, Software Behavioral Genome, Software Engineering, Software Narrative Science, Software Narratology, Software Narremes, Software Problem Description Patterns, Software Problem Solving, Software Technical Support, Software Trace Analysis, Software Trace Deconstruction, Software Trace Modeling, Software Trace Reading, Structural Trace Patterns, Testing, Trace Analysis Patterns | No Comments »
Friday, March 16th, 2012
Debugging before profits.
Dmitry Vostokov
- Dmitry Vostokov @ DumpAnalysis.org + TraceAnalysis.org -
Posted in Bugtations, Debugging | No Comments »
Sunday, March 11th, 2012
The development of SPDL requires extending pattern-driven analysis approach to software problems such as software defect and software incident descriptions. Such a pattern language should help with accurate problem identification and problem resolution through software behaviour analysis and with choosing, for example, appropriate workaround patterns or, for a debugging strategy, unified debugging patterns. This can also be applicable to software security incident descriptions as well.
For this first part, we introduce a pattern called, Problem Summary. This is a very short description that summarizes the essence of the problem from a submitter point of view such as a software user or a technical support engineer. Whether it is correct or incorrect is another problem itself but the missing summary usually requires close reading of the whole problem description text and analyze together various relevant parts to reconstruct the summary.
- Dmitry Vostokov @ DumpAnalysis.org + TraceAnalysis.org -
Posted in Debugging, Escalation Engineering, SPDL, Security, Software Engineering, Software Problem Description Patterns, Software Problem Solving, Software Support Patterns, Software Technical Support, Victimware | No Comments »
Sunday, March 11th, 2012
After introducing software narrative planes it is logical to expand the field of software narratology to cover the whole domain of software construction and post-construction. We therefore combine both pairs of planes to create a narratological square:
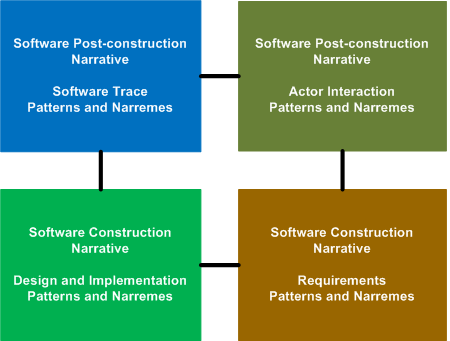
Please also register for the forthcoming free Webinar: Introduction to Software Narratology where I plan to provide a coherent overview of the recent developments in this new field.
- Dmitry Vostokov @ DumpAnalysis.org + TraceAnalysis.org -
Posted in Computer Science, Debugging, Science of Software Tracing, Software Engineering, Software Narrative Science, Software Narratology, Software Narremes, Software Problem Description Patterns, Software Problem Solving, Software Trace Analysis | No Comments »
Saturday, March 3rd, 2012

Memory Dump Analysis Services organizes a new training course:
Description: Learn how to analyze app crashes and freezes, navigate through process core memory dump space and diagnose corruption, memory leaks, CPU spikes, blocked threads, deadlocks, wait chains, and much more. We use a unique and innovative pattern-driven analysis approach to speed up the learning curve. The training consists of practical step-by-step exercises using Xcode and GDB environments highlighting various patterns diagnosed in 64-bit process core memory dumps. The training also includes an overview of relevant similarities and differences between Windows and Mac OS X user space memory dump analysis useful for engineers with Wintel background.
If you are registered you are allowed to optionally submit your app core dumps before the training. This will allow us in addition to the carefully constructed problems tailor additional examples to the needs of the attendees.
The training consists of 2 two-hour sessions. When you finish the training you additionally get:
- A full transcript in PDF format (retail price $200)
- 6 volumes of Memory Dump Analysis Anthology in PDF format (retail price $120)
- A personalized attendance certificate with unique CID (PDF format)
- Mac OS X Debugging: Practical Foundations in PDF format (retail price $15)
- Free Dump Analysis World Network membership including updates to full PDF transcript Q&A section
Prerequisites: Basic Mac OS X troubleshooting and debugging
Audience: Software technical support and escalation engineers, system administrators, software developers and quality assurance engineers.
Session 1: October 19, 2012 4:00 PM - 6:00 PM BST
Session 2: October 22, 2012 4:00 PM - 6:00 PM BST
Price: 210 USD
Space is limited.
Reserve your remote training seat now at:
https://student.gototraining.com/r/3803636572165653760
If you are mainly interested in Windows memory dump analysis there is another course available:
Accelerated Windows Memory Dump Analysis
- Dmitry Vostokov @ DumpAnalysis.org + TraceAnalysis.org -
Posted in Announcements, Assembly Language, Crash Dump Analysis, Crash Dump Patterns, Debugging, Escalation Engineering, Mac Crash Corner, Mac OS X, Memory Dump Analysis Services, Software Engineering, Software Technical Support, Testing, Training and Seminars | No Comments »
Monday, February 20th, 2012
Watching a Movie - Watching the prodigious output of some debugging commands and scripts in real time.
Examples: Watching the output of !process 0 ff WinDbg command. Watching the output of user stack trace database and breaking in when it becomes uniform.
- Dmitry Vostokov @ DumpAnalysis.org + TraceAnalysis.org -
Posted in Crash Dump Analysis, Debugging, Debugging Slang, Fun with Crash Dumps, Fun with Debugging | No Comments »
Monday, February 20th, 2012
I was recently asked by a group of trainees to outline a simple approach to proceed after opening a memory dump. So I came up with these 7 steps:
1. !analyze -v [-hang]
2. Exception (Bugcheck): stack trace analysis with d* and lmv
3. !locks
4. !runaway f (!running)
5. Dump all (processes and) thread stack traces [with 32-bit] ~*kv (!process 0 ff)
6. Search for signs/patterns of abnormal behavior (exceptions, wait chains, message boxes [, from your custom checklist])
7. Narrow analysis down to a specific thread and dump raw stack data if needed [repeat*]
(commands/options in brackets denote kernel/complete dump variation)
[notes in square brackets denote additional options, such as x64 specifics, your product details, etc.]
What are your steps? I would be interested to hear about alternative analysis steps, techniques, etc.
- Dmitry Vostokov @ DumpAnalysis.org + TraceAnalysis.org -
Posted in Announcements, Best Practices, Complete Memory Dump Analysis, Crash Dump Analysis, Crash Dump Patterns, Debugging, Debugging Methodology, Memory Dump Analysis Methodology, Root Cause Analysis, Software Trace Analysis, WinDbg Tips and Tricks, x64 Windows | 1 Comment »
Sunday, February 19th, 2012
Memory Dump Analysis Services (DumpAnalysis.com) organizes a free Webinar about software narratology: an application of ideas from narratology to software narrative stories.

Learn about this exciting new discipline and a field of research. When software executes it gives us its stories in the form of UI events, software traces and logs. Such stories can be analyzed for their structure and patterns for troubleshooting, debugging and problem resolution purposes.
Prerequisites: basic software troubleshooting and ability to read software generated logs.
Audience: anyone can benefit from this new perspective: from software users to software engineers and managers.
Space is limited.
Reserve your Webinar seat now at:
https://www3.gotomeeting.com/register/603136294
- Dmitry Vostokov @ DumpAnalysis.org + TraceAnalysis.org -
Posted in Announcements, Computer Science, Debugging, Escalation Engineering, Intelligence Analysis Patterns, Memory Dump Analysis Services, SPDL, Science of Software Tracing, Security, Software Behavior DNA, Software Behavior Patterns, Software Behavioral Genome, Software Engineering, Software Narrative Fiction, Software Narratology, Software Problem Description Patterns, Software Problem Solving, Software Technical Support, Software Trace Analysis, Software Trace Deconstruction, Software Trace Linguistics, Software Trace Modeling, Software Trace Reading, Software Trace Visualization, Software Tracing Implementation Patterns, Software Tracing for Dummies, Software Troubleshooting Patterns, Software Victimology, Structural Trace Patterns, Testing, Tools, Trace Analysis Patterns, Troubleshooting Methodology, UI Problem Analysis Patterns, Unified Debugging Patterns, Unit Testing, Victimware, Webinars, Windows System Administration | No Comments »
Sunday, February 19th, 2012
One of attendees of accelerated memory dump analysis training pointed me to the possible effects of -g option for AeDebug custom postmortem debugger command line for CDB, NTSD or WinDbg. So I tested that with x64 TestWER tool (should be the same with x86 version) and indeed there are differences.
With -g option with have this stack trace:
AeDebug\Debugger = "C:\Program Files\Debugging Tools for Windows (x64)\windbg.exe" -p %ld -e %ld -g
0:000> kL

Child-SP          RetAddr           Call Site

00000000`0012f210 00000001`40004148 TestWER64!CTestDefaultDebuggerDlg::OnBnClickedButton1+0x7e

00000000`0012f250 00000001`40004388 TestWER64!_AfxDispatchCmdMsg+0xc4

00000000`0012f280 00000001`40003552 TestWER64!CCmdTarget::OnCmdMsg+0x180

00000000`0012f2e0 00000001`4000cc44 TestWER64!CDialog::OnCmdMsg+0x32

00000000`0012f320 00000001`4000d877 TestWER64!CWnd::OnCommand+0xcc

00000000`0012f3b0 00000001`40008c2c TestWER64!CWnd::OnWndMsg+0x5f

00000000`0012f4f0 00000001`4000c272 TestWER64!CWnd::WindowProc+0x38

00000000`0012f530 00000001`4000c32d TestWER64!AfxCallWndProc+0xfe

00000000`0012f5d0 00000000`77519bd1 TestWER64!AfxWndProc+0x59

00000000`0012f610 00000000`77516aa8 USER32!UserCallWinProcCheckWow+0x1ad

00000000`0012f6d0 00000000`77516bad USER32!SendMessageWorker+0x682

00000000`0012f760 000007fe`fccb0bbf USER32!SendMessageW+0x5c

00000000`0012f7b0 000007fe`fccb47df COMCTL32!Button_ReleaseCapture+0x157

00000000`0012f7f0 00000000`77519bd1 COMCTL32!Button_WndProc+0xcbf

00000000`0012f8b0 00000000`775198da USER32!UserCallWinProcCheckWow+0x1ad

00000000`0012f970 00000000`775167c2 USER32!DispatchMessageWorker+0x3b5

00000000`0012f9f0 00000001`400079cc USER32!IsDialogMessageW+0x153

00000000`0012fa80 00000001`40009148 TestWER64!CWnd::IsDialogMessageW+0x38

00000000`0012fab0 00000001`40003513 TestWER64!CWnd::PreTranslateInput+0x28

00000000`0012fae0 00000001`4000b696 TestWER64!CDialog::PreTranslateMessage+0xc3

00000000`0012fb10 00000001`40004c1f TestWER64!CWnd::WalkPreTranslateTree+0x3a

00000000`0012fb40 00000001`40004c7f TestWER64!AfxInternalPreTranslateMessage+0x67

00000000`0012fb70 00000001`40004e26 TestWER64!AfxPreTranslateMessage+0x23

00000000`0012fba0 00000001`40004e6b TestWER64!AfxInternalPumpMessage+0x3a

00000000`0012fbd0 00000001`4000aba6 TestWER64!AfxPumpMessage+0x1b

00000000`0012fc00 00000001`40003e4a TestWER64!CWnd::RunModalLoop+0xea

00000000`0012fc60 00000001`40024da4 TestWER64!CDialog::DoModal+0x1c6

00000000`0012fd10 00000001`40024625 TestWER64!CTestDefaultDebuggerApp::InitInstance+0xc4

00000000`0012fe70 00000001`400153c2 TestWER64!AfxWinMain+0x75

00000000`0012feb0 00000000`77ad652d TestWER64!__tmainCRTStartup+0x186

00000000`0012ff60 00000000`77c0c521 kernel32!BaseThreadInitThunk+0xd

00000000`0012ff90 00000000`00000000 ntdll!RtlUserThreadStart+0x1d
0:000> r

rax=0000000000000000 rbx=0000000000000001 rcx=000000000012fd50

rdx=00000000000003e8 rsi=000000000012fd50 rdi=000000014002daa0

rip=00000001400247ae rsp=000000000012f210 rbp=0000000000000111

r8=0000000000000000  r9=0000000140024730 r10=0000000140024730

r11=000000000012f310 r12=0000000000000000 r13=00000000000003e8

r14=0000000000000110 r15=0000000000000001

iopl=0         nv up ei pl zr na po nc

cs=0033  ss=002b  ds=002b  es=002b  fs=0053  gs=002b             efl=00010244

TestWER64!CTestDefaultDebuggerDlg::OnBnClickedButton1+0x7e:

00000001`400247ae c704250000000000000000 mov dword ptr [0],0 ds:00000000`00000000=????????
Without -g option we also see exception processing (highlighted in red):
AeDebugger\Debugger = "C:\Program Files\Debugging Tools for Windows (x64)\windbg.exe" -p %ld -e %ld
0:000> kL

Child-SP          RetAddr           Call Site

00000000`0012e368 000007fe`fe301420 ntdll!ZwWaitForMultipleObjects+0xa

00000000`0012e370 00000000`77ae2cf3 KERNELBASE!WaitForMultipleObjectsEx+0xe8

00000000`0012e470 00000000`77b590f5 kernel32!WaitForMultipleObjectsExImplementation+0xb3

00000000`0012e500 00000000`77b59277 kernel32!WerpReportFaultInternal+0×215

00000000`0012e5a0 00000000`77b592cf kernel32!WerpReportFault+0×77

00000000`0012e5d0 00000000`77b594ec kernel32!BasepReportFault+0×1f

00000000`0012e600 00000000`77c743b8 kernel32!UnhandledExceptionFilter+0×1fc

00000000`0012e6e0 00000000`77bf85a8 ntdll! ?? ::FNODOBFM::`string’+0×2365

00000000`0012e710 00000000`77c09d0d ntdll!_C_specific_handler+0×8c

00000000`0012e780 00000000`77bf91af ntdll!RtlpExecuteHandlerForException+0xd

00000000`0012e7b0 00000000`77c31278 ntdll!RtlDispatchException+0×45a

00000000`0012ee90 00000001`400247ae ntdll!KiUserExceptionDispatcher+0×2e

00000000`0012f450 00000001`40004148 TestWER64!CTestDefaultDebuggerDlg::OnBnClickedButton1+0×7e

00000000`0012f490 00000001`40004388 TestWER64!_AfxDispatchCmdMsg+0xc4

00000000`0012f4c0 00000001`40003552 TestWER64!CCmdTarget::OnCmdMsg+0×180

00000000`0012f520 00000001`4000cc44 TestWER64!CDialog::OnCmdMsg+0×32

00000000`0012f560 00000001`4000d877 TestWER64!CWnd::OnCommand+0xcc

00000000`0012f5f0 00000001`40008c2c TestWER64!CWnd::OnWndMsg+0×5f

00000000`0012f730 00000001`4000c272 TestWER64!CWnd::WindowProc+0×38

00000000`0012f770 00000001`4000c32d TestWER64!AfxCallWndProc+0xfe

00000000`0012f810 00000000`77519bd1 TestWER64!AfxWndProc+0×59

00000000`0012f850 00000000`77516aa8 USER32!UserCallWinProcCheckWow+0×1ad

00000000`0012f910 00000000`77516bad USER32!SendMessageWorker+0×682

00000000`0012f9a0 00000000`7751eda7 USER32!SendMessageW+0×5c

00000000`0012f9f0 00000001`400079cc USER32!IsDialogMessageW+0×85f

00000000`0012fa80 00000001`40009148 TestWER64!CWnd::IsDialogMessageW+0×38

00000000`0012fab0 00000001`40003513 TestWER64!CWnd::PreTranslateInput+0×28

00000000`0012fae0 00000001`4000b696 TestWER64!CDialog::PreTranslateMessage+0xc3

00000000`0012fb10 00000001`40004c1f TestWER64!CWnd::WalkPreTranslateTree+0×3a

00000000`0012fb40 00000001`40004c7f TestWER64!AfxInternalPreTranslateMessage+0×67

00000000`0012fb70 00000001`40004e26 TestWER64!AfxPreTranslateMessage+0×23

00000000`0012fba0 00000001`40004e6b TestWER64!AfxInternalPumpMessage+0×3a

00000000`0012fbd0 00000001`4000aba6 TestWER64!AfxPumpMessage+0×1b

00000000`0012fc00 00000001`40003e4a TestWER64!CWnd::RunModalLoop+0xea

00000000`0012fc60 00000001`40024da4 TestWER64!CDialog::DoModal+0×1c6

00000000`0012fd10 00000001`40024625 TestWER64!CTestDefaultDebuggerApp::InitInstance+0xc4

00000000`0012fe70 00000001`400153c2 TestWER64!AfxWinMain+0×75

00000000`0012feb0 00000000`77ad652d TestWER64!__tmainCRTStartup+0×186

00000000`0012ff60 00000000`77c0c521 kernel32!BaseThreadInitThunk+0xd

00000000`0012ff90 00000000`00000000 ntdll!RtlUserThreadStart+0×1d
I now prefer omitting -g option to get stack traces equivalent to manual crash dumps saved by userdump.exe on pre-Vista platforms and Task Manager on later platforms.
- Dmitry Vostokov @ DumpAnalysis.org + TraceAnalysis.org -
Posted in .NET Debugging, Crash Dump Analysis, Debugging, Tools, WinDbg Tips and Tricks, x64 Windows | No Comments »
Friday, February 17th, 2012
In narratology anti-narrative denotes a narrative having sequences of events impossible in reality. In software traces such sequences usually depict abnormal software behaviour. Here are some parallels with corresponding trace analysis patterns:
Fiction                             | Software Trace

================================================

Repeated unrepeatable       | Periodic Error (?)

Denarration (erasure)            | No Activity / Incomplete History

Chronological contradiction | Impossible Trace
Question mark means that possibly another pattern is needed there.
- Dmitry Vostokov @ DumpAnalysis.org + TraceAnalysis.org -
Posted in Crash Dump Analysis, Crash Dump Patterns, Debugging, Software Behavior Patterns, Software Narrative Fiction, Software Narratology, Software Trace Analysis, Trace Analysis Patterns | No Comments »
Sunday, February 12th, 2012
Regular Data pattern generalizes ASCII and UNICODE-type (00xx00yy) data found in memory to domain-specific data formats such as bitmaps and vector data. An example of the latter could be the sequence of …0xxx0yyy… (xxx are triplets of hex digits). A typical usage of this pattern is analysis of corrupt dynamic memory blocks (process heap, kernel pool) where continuity of regular data across block boundary points to a possible buffer overwrite.
- Dmitry Vostokov @ DumpAnalysis.org + TraceAnalysis.org -
Posted in Crash Dump Analysis, Crash Dump Patterns, Debugging | No Comments »
Sunday, February 12th, 2012
Runtime software exceptions (such as C++ exceptions) can be translated by custom exception handlers into other exceptions by changing exception data. This is different from nested exceptions where another exception is thrown. One example of such possible translation I recently encountered when looking at a raw stack data (!teb -> dps) having signs of hidden exceptions (multiple RaiseException calls) and also CLR execution residue (valid return addresses of clr module). In addition of final invalid handle exception and one hidden access violation there were many exception codes c0000027. Google search pointed to the article about skipped C++ destructors written by S. Senthil Kumar that prompted me to introduce the pattern Translated Exception.
- Dmitry Vostokov @ DumpAnalysis.org + TraceAnalysis.org -
Posted in .NET Debugging, Crash Dump Analysis, Crash Dump Patterns, Debugging, Deep Down C++ | No Comments »
Wednesday, February 1st, 2012
I have plans for a debugging tour to visit famous debugging places around the world. According to Wikipedia I have to start with Harward University where the first bug was found. I’ll keep you informed on the progress of this memorianic pilgrimage.
- Dmitry Vostokov @ DumpAnalysis.org + TraceAnalysis.org -
Posted in Announcements, Debugging, Debugging Tours, Fun with Debugging, Memorianic Pilgrimages, Memory Religion (Memorianity) | No Comments »
Wednesday, February 1st, 2012
On natural pointers vs. pointers that are not natural, like a NULL, wild or dangling pointer.
Thus, a man who intends keeping pointers naturally tries to get as good debuggers as he can … .
Charles Darwin, On the Origin of Species
- Dmitry Vostokov @ DumpAnalysis.org + TraceAnalysis.org -
Posted in Bugtations, Debugging, Evolution, Fun with Debugging | No Comments »
Wednesday, February 1st, 2012
Memory Dump Analysis Services plans to introduce Mac OS X memory dump analysis training this year based on the success of its Windows variant. For details and how to register please visit this page:
http://www.dumpanalysis.com/accelerated-mac-os-x-core-dump-analysis
- Dmitry Vostokov @ DumpAnalysis.org + TraceAnalysis.org -
Posted in Announcements, Crash Dump Analysis, Crash Dump Patterns, Debugging, Mac Crash Corner | No Comments »
Tuesday, January 31st, 2012
Memory Dump Analysis Services starts providing debugging training and assistance in addition to (based on) memory dump and software trace analysis. It has recently registered www.debugging.pro domain and is working on extending its courses to cover live debugging and additional OS platforms this year.
- Dmitry Vostokov @ DumpAnalysis.org + TraceAnalysis.org -
Posted in .NET Debugging, Android Crash Corner, Announcements, Crash Dump Analysis, Debugging, Debugging Bureau, Debugging Methodology, Debugging Today, Debugging Trends, Linux Crash Corner, Live Debugging, Mac Crash Corner, Memory Dump Analysis Services, Software Debugging Services, Software Trace Analysis, Training and Seminars | No Comments »