Icons for Memory Dump Analysis Patterns (Part 93)
Thursday, February 24th, 2011Today we introduce an icon for Hardware Error pattern:
B/W
![]()
Color
![]()
- Dmitry Vostokov @ DumpAnalysis.org + TraceAnalysis.org -
Today we introduce an icon for Hardware Error pattern:
B/W
![]()
Color
![]()
- Dmitry Vostokov @ DumpAnalysis.org + TraceAnalysis.org -
Today we introduce an icon for Wild Code pattern:
B/W
![]()
Color
![]()
- Dmitry Vostokov @ DumpAnalysis.org + TraceAnalysis.org -
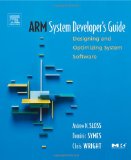
With Windows moving to ARM platforms I’m learning ARM assembly language and system programming. Being mostly exposed to PDP-11, VAX-11 and Intel architectures my interest in ARM systems began with porting my old project to Windows Mobile and writing a tool called WindowHistory Mobile to assist me in debugging. I remember how I was surprised when WinDbg was able to open a crash dump and show ARM code! Then I put it aside. Now with Windows Mobile 7 and Windows 8 approaching with its support of ARM I decided to resume my ARM studies and highly recommend this book:
ARM System Developer’s Guide: Designing and Optimizing System Software
My renewed interest in assembly language also coincides with joining Linkedin Assembly language coders group.
I also plan to create a separate version of my popular Windows Debugging: Practical Foundations book with ARM examples and an ARM section on Asmpedia. If time and resources permit, of course.
- Dmitry Vostokov @ DumpAnalysis.org + TraceAnalysis.org -
Sometimes, we look at a trace and say it’s Impossible Trace. For example, this fragment shows that the function foo had been called:
#     Module  PID  TID  Message

[...]

1001  ModuleA 202  404  foo: start

1002  ModuleA 202  404  foo: end

[...]
However, if we look at the corresponding source code (PLOT) we would see that something is missing: the function bar must have been called with its own set of trace messages we don’t see in the trace:
void foo()

{

    TRACE("foo: start");

    bar();

    TRACE("foo: end");

}
void bar()

{

    TRACE("bar: start");

    // some code ...

    TRACE("bar: end");

}
We suspect the runtime code being modified, perhaps by patching. In other cases of missing messages we can also suspect thrown exceptions or local buffer overflows that led to wrong return address skipping the code with expected tracing statements. The mismatch between the trace and the source code we are looking at is also possible if the old source code didn’t have bar function called.
Note: I’m grateful for this pattern idea to Gary Barton.
- Dmitry Vostokov @ DumpAnalysis.org + TraceAnalysis.org -
This part starts the block of patterns called Semantic Structures. These structures are fragments of memory which have meaning helping us in troubleshooting and debugging. The first pattern in this block deals with PID.TID structures of the form DWORD : DWORD or QWORD : QWORD. Such memory fragments are useful for wait chain analysis, for example, by looking at the excution residue left on a raw stack to find a target or an origin of RPC or (A)LPC calls. RPC target example can be found in the post: In Search of Lost CID. Here we look at another example, this time to find the originator of an ALPC call.
A ServiceA was executing some undesired functionality and a breakpoint was set on ModuleA code to trigger it under unreproducible conditions. Then a complete memory dump was saved for offline analysis. There we see an ALPC server thread that triggered the breakpoint but don’t see the message information in the output of WinDbg !thread command that can help us finding an ALPC client thread easily:
THREAD fffffa8005e6b060  Cid 0cc0.1838  Teb: 000007fffff8e000 Win32Thread: 0000000000000000 WAIT: (Executive) KernelMode Non-Alertable

SuspendCount 1

    fffff880094ad0a0  SynchronizationEvent

Not impersonating

DeviceMap                 fffff8a001aba3c0

Owning Process            fffffa8004803b30       Image:         ServiceA.exe

Attached Process          N/A            Image:         N/A

Wait Start TickCount      1441562        Ticks: 106618 (0:00:27:43.251)

Context Switch Count      414

UserTime                  00:00:00.000

KernelTime                00:00:00.031

Win32 Start Address ntdll!TppWorkerThread (0×0000000077c88f00)

Stack Init fffff880094addb0 Current fffff880094acdb0

Base fffff880094ae000 Limit fffff880094a8000 Call 0

Priority 12 BasePriority 10 UnusualBoost 0 ForegroundBoost 0 IoPriority 2 PagePriority 5

Child-SP          RetAddr           Call Site

fffff880`094acdf0 fffff800`01678992 nt!KiSwapContext+0×7a

fffff880`094acf30 fffff800`0167acff nt!KiCommitThreadWait+0×1d2

fffff880`094acfc0 fffff800`01a150e8 nt!KeWaitForSingleObject+0×19f

fffff880`094ad060 fffff800`01a1546c nt!DbgkpQueueMessage+0×2a8

fffff880`094ad230 fffff800`019b9116 nt!DbgkpSendApiMessage+0×5c

fffff880`094ad270 fffff800`016abb96 nt! ?? ::NNGAKEGL::`string’+0×3463d

fffff880`094ad3b0 fffff800`01670d82 nt!KiDispatchException+0×316

fffff880`094ada40 fffff800`0166ebb4 nt!KiExceptionDispatch+0xc2

fffff880`094adc20 000007fe`f79365d1 nt!KiBreakpointTrap+0xf4 (TrapFrame @ fffff880`094adc20)

00000000`035ee568 000007fe`f80670b5 ModuleA+0×38611

[…]

00000000`035ee5d0 000007fe`ff4bc7f5 ModuleB!Start+0×6e1

00000000`035ee770 000007fe`ff56b62e RPCRT4!Invoke+0×65

00000000`035ee7c0 000007fe`ff4bf1f6 RPCRT4!Ndr64StubWorker+0×61b

00000000`035eed80 000007fe`ffedf223 RPCRT4!NdrStubCall3+0xb5

00000000`035eede0 000007fe`ffedfc0d ole32!CStdStubBuffer_Invoke+0×5b

00000000`035eee10 000007fe`ffedfb83 ole32!SyncStubInvoke+0×5d

00000000`035eee80 000007fe`ffd7fd60 ole32!StubInvoke+0xdb

00000000`035eef30 000007fe`ffedfa22 ole32!CCtxComChnl::ContextInvoke+0×190

00000000`035ef0c0 000007fe`ffedf76b ole32!AppInvoke+0xc2

00000000`035ef130 000007fe`ffeded6d ole32!ComInvokeWithLockAndIPID+0×52b

00000000`035ef2c0 000007fe`ff4b9c24 ole32!ThreadInvoke+0×30d

00000000`035ef360 000007fe`ff4b9d86 RPCRT4!DispatchToStubInCNoAvrf+0×14

00000000`035ef390 000007fe`ff4bc44b RPCRT4!RPC_INTERFACE::DispatchToStubWorker+0×146

00000000`035ef4b0 000007fe`ff4bc38b RPCRT4!RPC_INTERFACE::DispatchToStub+0×9b

00000000`035ef4f0 000007fe`ff4bc322 RPCRT4!RPC_INTERFACE::DispatchToStubWithObject+0×5b

00000000`035ef570 000007fe`ff4ba11d RPCRT4!LRPC_SCALL::DispatchRequest+0×422

00000000`035ef650 000007fe`ff4c7ddf RPCRT4!LRPC_SCALL::HandleRequest+0×20d

00000000`035ef780 000007fe`ff4c7995 RPCRT4!LRPC_ADDRESS::ProcessIO+0×3bf

00000000`035ef8c0 00000000`77c8b43b RPCRT4!LrpcIoComplete+0xa5

00000000`035ef950 00000000`77c8923f ntdll!TppAlpcpExecuteCallback+0×26b

00000000`035ef9e0 00000000`77a6f56d ntdll!TppWorkerThread+0×3f8

00000000`035efce0 00000000`77ca3281 kernel32!BaseThreadInitThunk+0xd

00000000`035efd10 00000000`00000000 ntdll!RtlUserThreadStart+0×1d
We inspect the raw stack starting from the first top Child-SP value for RPCRT4 subtrace and find NNN:NNN data there resembling PID:TID pair:
1: kd> dpp 00000000`035ef360 l100

[...]

00000000`035ef698  00000000`00000000

00000000`035ef6a0  00000000`00000001

00000000`035ef6a8  00000000`00000000

00000000`035ef6b0  00000000`00000000

00000000`035ef6b8  00000000`00000118

00000000`035ef6c0  00000000`0000048c

00000000`035ef6c8  00000000`00495e50 000007fe`ff57d920 RPCRT4!LRPC_ADDRESS::`vftable’

00000000`035ef6d0  00000000`00000000

[…]
We find such CID in the stack trace collection and see a wait for an ALPC message reply:
THREAD fffffa8003d49b60  Cid 0118.048c  Teb: 000007fffffaa000 Win32Thread: fffff900c01e4c30 WAIT: (WrLpcReply) UserMode Non-Alertable

    fffffa8003d49f20  Semaphore Limit 0×1

Waiting for reply to ALPC Message fffff8a000bdb6c0 : queued at port fffffa80042f8090 : owned by process fffffa8004803b30

Not impersonating

DeviceMap                 fffff8a000008600

Owning Process            fffffa8003cf15d0       Image:         ServiceB.exe

Attached Process          N/A            Image:         N/A

Wait Start TickCount      1441554        Ticks: 106626 (0:00:27:43.376)

Context Switch Count      23180                 LargeStack

UserTime                  00:00:00.468

KernelTime                00:00:03.057

Win32 Start Address ntdll!TppWorkerThread (0×0000000077c88f00)

Stack Init fffff88004ffcdb0 Current fffff88004ffc620

Base fffff88004ffd000 Limit fffff88004ff7000 Call 0

Priority 6 BasePriority 6 UnusualBoost 0 ForegroundBoost 0 IoPriority 2 PagePriority 5

Kernel stack not resident.

Child-SP          RetAddr           Call Site

fffff880`04ffc660 fffff800`01678992 nt!KiSwapContext+0×7a

fffff880`04ffc7a0 fffff800`0167acff nt!KiCommitThreadWait+0×1d2

fffff880`04ffc830 fffff800`0168fd1f nt!KeWaitForSingleObject+0×19f

fffff880`04ffc8d0 fffff800`01977ac6 nt!AlpcpSignalAndWait+0×8f

fffff880`04ffc980 fffff800`01975a50 nt!AlpcpReceiveSynchronousReply+0×46

fffff880`04ffc9e0 fffff800`01972fcb nt!AlpcpProcessSynchronousRequest+0×33d

fffff880`04ffcb00 fffff800`01670993 nt!NtAlpcSendWaitReceivePort+0×1ab

fffff880`04ffcbb0 00000000`77cc070a nt!KiSystemServiceCopyEnd+0×13 (TrapFrame @ fffff880`04ffcc20)

00000000`018ce308 000007fe`ff4caa76 ntdll!ZwAlpcSendWaitReceivePort+0xa

00000000`018ce310 000007fe`ff4bf802 RPCRT4!LRPC_CCALL::SendReceive+0×156

00000000`018ce3d0 000007fe`ffee0900 RPCRT4!I_RpcSendReceive+0×42

00000000`018ce400 000007fe`ffee05ef ole32!ThreadSendReceive+0×40

00000000`018ce450 000007fe`ffee041b ole32!CRpcChannelBuffer::SwitchAptAndDispatchCall+0xa3

00000000`018ce4f0 000007fe`ffd819c6 ole32!CRpcChannelBuffer::SendReceive2+0×11b

00000000`018ce6b0 000007fe`ffd81928 ole32!CAptRpcChnl::SendReceive+0×52

00000000`018ce780 000007fe`ffedfcf5 ole32!CCtxComChnl::SendReceive+0×68

00000000`018ce830 000007fe`ff56ba3b ole32!NdrExtpProxySendReceive+0×45

00000000`018ce860 000007fe`ffee02d0 RPCRT4!NdrpClientCall3+0×2e2

00000000`018ceb20 000007fe`ffd818a2 ole32!ObjectStublessClient+0×11d

00000000`018ceeb0 00000000`ff5afe64 ole32!ObjectStubless+0×42

[…]

00000000`018cf7a0 00000000`77c8f8eb ServiceB!Worker+0×366

00000000`018cf800 00000000`77c89d9f ntdll!RtlpTpWorkCallback+0×16b

00000000`018cf8e0 00000000`77a6f56d ntdll!TppWorkerThread+0×5ff

00000000`018cfbe0 00000000`77ca3281 kernel32!BaseThreadInitThunk+0xd

00000000`018cfc10 00000000`00000000 ntdll!RtlUserThreadStart+0×1d
Inspection of that message shows that it was directed to our server thread that triggered the breakpoint:
1: kd> !alpc /m fffff8a000bdb6c0
Message @ fffff8a000bdb6c0

  MessageID             : 0x0600 (1536)

  CallbackID            : 0x2D910D (2986253)

  SequenceNumber        : 0x0002CB50 (183120)

  Type                  : LPC_REQUEST

  DataLength            : 0x0068 (104)

  TotalLength           : 0x0090 (144)

  Canceled              : No

  Release               : No

  ReplyWaitReply        : No

  Continuation          : Yes

  OwnerPort             : fffffa8004823a80 [ALPC_CLIENT_COMMUNICATION_PORT]

  WaitingThread         : fffffa8003d49b60

  QueueType             : ALPC_MSGQUEUE_PENDING

  QueuePort             : fffffa80042f8090 [ALPC_CONNECTION_PORT]

  QueuePortOwnerProcess : fffffa8004803b30 (ServiceA.exe)

  ServerThread          : fffffa8005e6b060

  QuotaCharged          : No

  CancelQueuePort       : 0000000000000000

  CancelSequencePort    : 0000000000000000

  CancelSequenceNumber  : 0×00000000 (0)

  ClientContext         : 000000000020f0c0

  ServerContext         : 0000000000000000

  PortContext           : 0000000000416990

  CancelPortContext     : 0000000000000000

  SecurityData          : 0000000000000000

  View                  : 0000000000000000
- Dmitry Vostokov @ DumpAnalysis.org + TraceAnalysis.org -
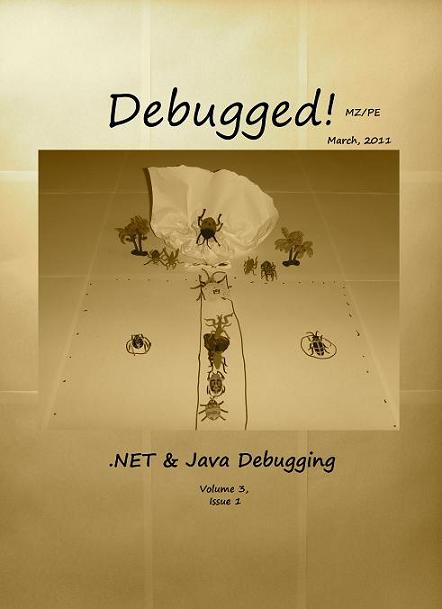
This is the main topic of the forthcoming March Debugged! MZ/PE magazine issue:
Debugged! MZ/PE: .NET and Java Debugging, March, 2011 (Paperback, ISBN: 978-1908043139)
The draft front cover is an allegory of a class hierarchy and was designed by my daughter, Alexandra Vostokova, a coauthor of Baby Turing book.
If you have an article idea or if you’d like to write an article for this issue please use the following contact form:
http://www.dumpanalysis.org/contact
The deadline is the 31st of March. Articles will first appear in the online version and then in print.
- Dmitry Vostokov @ DumpAnalysis.org + TraceAnalysis.org -
This specially designed logo explores the concept of a face as a combination of dump and trace artifacts:
 Group")
Join Facebook DATA (Dump Analysis + Trace Analysis) group: http://www.facebook.com/group.php?gid=95282722070
- Dmitry Vostokov @ DumpAnalysis.org + TraceAnalysis.org -
Today we introduce an icon for Wild Pointer pattern:
B/W
![]()
Color
![]()
- Dmitry Vostokov @ DumpAnalysis.org + TraceAnalysis.org -
This is the ultimate multi- and cross-platform debugging reference project dubbed internally as “Memory Dump of Debugging”. Useful for years to come, this encyclopedia would cover all aspects of debugging with articles from leading experts from both industry and academia. Preliminary product information:
The title is a successor to both Encyclopedia of Crash Dump Analysis Patterns (ISBN: 978-1906717216) and Dictionary of Debugging (ISBN: 978-1906717353) the publisher plans to release in the mean time.
- Dmitry Vostokov @ DumpAnalysis.org + TraceAnalysis.org -
Memory Dump Analysis Services plans a Webinar about crash and hang memory dump analysis in cloud computing environments:
http://www.dumpanalysis.com/cloud-memory-dump-analysis

- Dmitry Vostokov @ DumpAnalysis.org + TraceAnalysis.org -
Orbifold Memory Space
A multiple virtual/physical memory space view taking into account multiple computers:
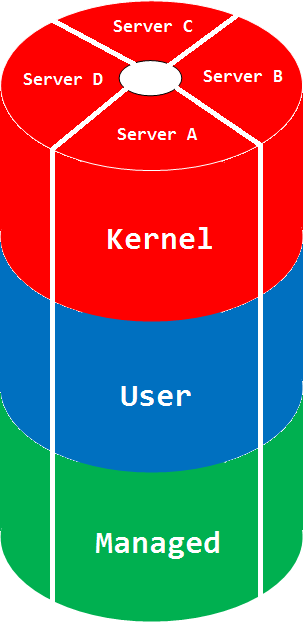
The picture can be much more complex if we glue different manifold memory spaces. The space name comes from a mathematical orbifold, a generalization of manifold.
Synonyms: cloud memory space
Antonyms:
Also: memory space, memory region, physical memory, virtual memory, manifold memory space, memory mapping.
- Dmitry Vostokov @ DumpAnalysis.org + TraceAnalysis.org -

- Dmitry Vostokov @ DumpAnalysis.org + TraceAnalysis.org -
My recent desire is to have the ultimate human debugger’s desk: monitors joined together around me to have 360-degree memory surveillance. I haven’t yet been talking about spherical coordinate system for memory analysis, only cylindrical one. Any sponsor? ![]()
Source: 360-Degree Memory Analysis
- Dmitry Vostokov @ DumpAnalysis.org + TraceAnalysis.org -
Today we introduce an icon for Zombie Processes pattern:
B/W
![]()
Color
![]()
- Dmitry Vostokov @ DumpAnalysis.org + TraceAnalysis.org -

- Dmitry Vostokov @ DumpAnalysis.org + TraceAnalysis.org -
Sometimes added instrumentation via gflags, application and driver verifier options affect system, service or application performance and resources. I call this pattern Instrumentation Side Effect. For example, after enabling full page heap, one process on an x64 machine was growing up to 24GB and its user memory dump shows that every heap allocation was recorded in a stack trace database:
0:055> !gflag

Current NtGlobalFlag contents: 0x02000000

    hpa - Place heap allocations at ends of pages
0:055> ~*kc
[...]
  48  Id: 117fc.c164 Suspend: 1 Teb: 000007ff`fff52000 Unfrozen

Call Site

ntdll!ZwWaitForSingleObject

ntdll!RtlpWaitOnCriticalSection

ntdll!RtlEnterCriticalSection

verifier!AVrfpDphEnterCriticalSection

verifier!AVrfpDphPreProcessing

verifier!AVrfDebugPageHeapAllocate

ntdll!RtlDebugAllocateHeap

ntdll! ?? ::FNODOBFM::`string’

ntdll!RtlAllocateHeap

msvcrt!malloc

ModuleA!foo1

[…]
  49  Id: 117fc.de80 Suspend: 1 Teb: 000007ff`fff54000 Unfrozen

Call Site

ntdll!RtlCompareMemory

ntdll!RtlpLogCapturedStackTrace

ntdll!RtlLogStackTrace

verifier!AVrfpDphPlaceOnFreeList

verifier!AVrfDebugPageHeapFree

ntdll!RtlDebugFreeHeap

ntdll! ?? ::FNODOBFM::`string’

ntdll!RtlFreeHeap

kernel32!HeapFree

msvcrt!free

ModuleB!foo2

[…]
  50  Id: 117fc.3700 Suspend: 1 Teb: 000007ff`fff4e000 Unfrozen

Call Site

ntdll!ZwWaitForSingleObject

ntdll!RtlpWaitOnCriticalSection

ntdll!RtlEnterCriticalSection

verifier!AVrfpDphEnterCriticalSection

verifier!AVrfpDphPreProcessing

verifier!AVrfDebugPageHeapFree

ntdll!RtlDebugFreeHeap

ntdll! ?? ::FNODOBFM::`string’

ntdll!RtlFreeHeap

kernel32!HeapFree

msvcrt!free

ModuleC!foo3

[…]
0:055> !runaway

 User Mode Time

  Thread       Time

  38:d090      0 days 0:02:28.793

  44:ca48      0 days 0:01:04.459

  48:c164      0 days 0:00:56.909

  43:4458      0 days 0:00:54.475

  50:3700      0 days 0:00:43.992

  45:6f98      0 days 0:00:38.953

  49:de80      0 days 0:00:24.211

   1:391c      0 days 0:00:00.639

   0:7e90      0 days 0:00:00.109

  55:a300      0 days 0:00:00.046

  34:10c9c      0 days 0:00:00.015

  21:d054      0 days 0:00:00.015

  56:b0a0      0 days 0:00:00.000

  54:8b78      0 days 0:00:00.000

  53:155b8      0 days 0:00:00.000

  52:b444      0 days 0:00:00.000
Top modules ModuleA(B, C) from the spiking and heap intensive threads are from the same vendor.
I was able to get a 200×27349 slice from that dump using ImageMagick and it shows almost all virtual memory space filled with traces of this pictorial form (magnified by x8):


- Dmitry Vostokov @ DumpAnalysis.org + TraceAnalysis.org -
Today we introduce an icon for Blocked Thread (hardware) pattern:
B/W
![]()
Color
![]()
- Dmitry Vostokov @ DumpAnalysis.org + TraceAnalysis.org -
This pattern has a funny name Gossip. I thought originally to call it Duplicated Message but gave it the new name allowing for the possibility of semantics of the same message to be distorted in subsequent trace messages from different adjoint threads. Typical ETW / CDF trace example (distortion free) of the same message content seen in different modules (some columns like Date and Time are omitted):
#     Module  PID  TID  Message[...]26875 ModuleA

2172 5284 LoadImageEvent: ImageName(\Device\HarddiskVolume2\Windows\System32\notepad.exe) ProcessId(0x000000000000087C)26876 ModuleB

2172 5284 LoadImageEvent: ImageName(\Device\HarddiskVolume2\Windows\System32\notepad.exe), ProcessId(2172)26877 ModuleC

2172 5284 ImageLoad: fileName=notepad.exe, pid: 000000000000087C[...]
In such cases, when constructing event sequence order it is recommended to choose messages from the one source instead of mixing events from different sources, for example:
#     Module  PID  TID  Message[...]26875 ModuleA

2172 5284 LoadImageEvent: ImageName(\Device\HarddiskVolume2\Windows\System32\notepad.exe) ProcessId(0×000000000000087C)[…]33132 ModuleA

4180 2130 LoadImageEvent: ImageName(\Device\HarddiskVolume2\Windows\System32\calc.exe) ProcessId(0×0000000000001054)[…]
- Dmitry Vostokov @ DumpAnalysis.org + TraceAnalysis.org -
Got an insider information from Memory Dump Analysis Services that they are developing a Prolog extension for memory dump analysis. Indeed, after asking their development team, I got a proof of concept extension DLL that works on my computer after installing x64 version of SWI-Prolog and copying wdes.dll to pl \ bin installation folder:
0: kd> .load C:\Program Files\pl\bin\wdes.dll
0: kd> !help

Help for Windows Debugging Expert System wdes.dll

   help               - Shows this help

   pload              - Loads Prolog interpretor
0: kd> !pload

SWI-Prolog has been loaded
So far so good. Waiting for more extension commands. Perhaps, one day, this extension realizes my dream reminisced while testing a Python extension.
- Dmitry Vostokov @ DumpAnalysis.org + TraceAnalysis.org -
Finally had time today to test python WinDbg extension. I installed python 2.6.6 and used Debugging Tools for Windows x64. The script I used was from the extension web site blog slightly modified and called processes.py:
from pykd import *

nt = loadModule( "nt" )

processList = typedVarList( nt.PsActiveProcessHead, "nt", "_EPROCESS", "ActiveProcessLinks" )

for process in processList:

    dprintln( "".join( [ chr(i) for i in process.ImageFileName.values() ] ) )

    dprintln( "\r" )
I loaded x64 version of pykd.pyd extension and executed the script:
0: kd> !py c:\PyScripts\processes.py

System

smss.exe

csrss.exe

csrss.exe

psxss.exe

winlogon.exe

wininit.exe

services.exe

lsass.exe

lsm.exe

svchost.exe

svchost.exe

svchost.exe

svchost.exe

svchost.exe

svchost.exe

svchost.exe

svchost.exe

spoolsv.exe

mdm.exe

svchost.exe

svchost.exe

svchost.exe

taskhost.exe

dwm.exe

explorer.exe

DTLite.exe

mmc.exe

WZQKPICK.EXE

concentr.exe

pnamain.exe

jusched.exe

wfcrun32.exe

msdtc.exe

iexplore.exe

iexplore.exe

iexplore.exe

splwow64.exe

iexplore.exe

jucheck.exe

iexplore.exe

notepad.exe

notepad.exe

iexplore.exe

notepad.exe

iexplore.exe

notepad.exe

notepad.exe

iexplore.exe

audiodg.exe

CDViewer.exe

wfica32.exe

iexplore.exe

notepad.exe

cmd.exe

conhost.exe

wuauclt.exe

wfica32.exe

wlrmdr.exe

TrustedInstall

wfica32.exe

notepad.exe

iexplore.exe

wmplayer.exe

VISIO.EXE

mspaint.exe

svchost.exe

sppsvc.exe

windbg.exe

mmc.exe

LogonUI.exe

taskeng.exe

NotMyfault.exe
Very good so far. I’m learning now Python language to write more interesting scripts for crash dump analysis pattern diagnostics, mining statistics, formatting and visualization. After browsing Amazon for some time I chose this book for study:
A Primer on Scientific Programming with Python

About 5 or 6 years ago I was thinking about using a Prolog interpreter to write an expert system for crash dump analysis. I even wrote a simple Prolog program to match product hotfixes and was contemplating writing a WinDbg extension especially after I learnt that SWI-Prolog system I used had an interpreter DLL that could be dynamically loaded into a Win32 API application.
- Dmitry Vostokov @ DumpAnalysis.org + TraceAnalysis.org -