Icons for Memory Dump Analysis Patterns (Part 101)
Wednesday, September 21st, 2011Today we introduce an icon for Optimized VM Layout pattern:
B/W
![]()
Color
![]()
- Dmitry Vostokov @ DumpAnalysis.org + TraceAnalysis.org -
Today we introduce an icon for Optimized VM Layout pattern:
B/W
![]()
Color
![]()
- Dmitry Vostokov @ DumpAnalysis.org + TraceAnalysis.org -
Today we introduce an icon for Execution Residue pattern:
B/W
![]()
Color
![]()
- Dmitry Vostokov @ DumpAnalysis.org + TraceAnalysis.org -
R.E.M. album Out of Time is a great joy to listen for Win32 API debugging veterans familiar with Visual Basic
.
I put my own track title names here:
1. I Can’t Find It!
2. Losing My Data
3. LOWORD
4. Near A Wild Pointer (*pa, *pa, *ppa, …)
5. End Of Session
6. Happy Customers
7. Be LONG
8. Half A Word Away! (A Miracle)
9. Printer Driver (Can’t Spell Its Name)
10. Customer Feedback (One, Two, Three, …)
11. Found Me In Dumps
- Dmitry Vostokov @ DumpAnalysis.org + TraceAnalysis.org -
Original Message pattern deals with software trace messages where certain activity is repeated several times but the only the first message occurrence or specific message vocabulary has significance for analysis activity. Typical example from CDF/ETW tracing is module load events:
#     Module  PID   TID   Time         Message

[...]

35835 ModuleA 11000 11640 17:27:28.720 LoadImageEvent: \Device\HarddiskVolume2\Windows\System32\userinit.exe PId 5208

[…]

37684 ModuleA 12332 9576  17:27:29.063 LoadImageEvent: \Windows\System32\userinit.exe PId 573C

[…]

37687 ModuleA 12332 9576  17:27:29.064 LoadImageEvent: \Windows\System32\userinit.exe PId 573C

[…]
What we are looking here is for message invariant like “.exe” but interested in the occurrence of specific path structures like \Device\HarddiskVolume because in our troubleshooting context they signify process launch sequence during terminal session initialization.
- Dmitry Vostokov @ DumpAnalysis.org + TraceAnalysis.org -
If you like the completeness, grand complete memory dumps, multi-volume oeuvres (the more volumes the better) and natural memory visualization you would then like to open this box and listen to this complete performance achievement to get energy and inspiration for long debugging sessions:
Liszt: The Complete Piano Music
- Dmitry Vostokov @ DumpAnalysis.org + TraceAnalysis.org -
Today we introduce an icon for Missing Component (static linking, user mode) pattern:
B/W
![]()
Color
![]()
- Dmitry Vostokov @ DumpAnalysis.org + TraceAnalysis.org -
Whereas Stack Trace Collection pattern covers all thread stack traces from a memory dump Stack Trace Set pattern covers only unique non-duplicated thread stack traces differing for example, in stack frame modules and function names. In user process memory dumps it is !uniqstack WinDbg command (don’t forget that command has optional parameters, for example, -v to simulate verbose ~*kv output):
0:000> ~

.  0  Id: f00.f04 Suspend: 0 Teb: 7efdd000 Unfrozen

   1  Id: f00.f18 Suspend: 1 Teb: 7efda000 Unfrozen

   2  Id: f00.f1c Suspend: 1 Teb: 7efd7000 Unfrozen
0:000> ~*kc
. 0 Id: f00.f04 Suspend: 0 Teb: 7efdd000 Unfrozen
ntdll!NtWaitForMultipleObjects

KERNELBASE!WaitForMultipleObjectsEx

kernel32!WaitForMultipleObjectsExImplementation

kernel32!WaitForMultipleObjects

kernel32!WerpReportFaultInternal

kernel32!WerpReportFault

kernel32!BasepReportFault

kernel32!UnhandledExceptionFilter

ntdll!__RtlUserThreadStart

ntdll!_EH4_CallFilterFunc

ntdll!_except_handler4

ntdll!ExecuteHandler2

ntdll!ExecuteHandler

ntdll!KiUserExceptionDispatcher

KERNELBASE!DebugBreak

ApplicationK!main

ApplicationK!__tmainCRTStartup

kernel32!BaseThreadInitThunk

ntdll!__RtlUserThreadStart

ntdll!_RtlUserThreadStart
1 Id: f00.f18 Suspend: 1 Teb: 7efda000 Unfrozen
ntdll!NtDelayExecution

KERNELBASE!SleepEx

KERNELBASE!Sleep

kernel32!WerpReportFault

kernel32!BasepReportFault

kernel32!UnhandledExceptionFilter

ntdll!__RtlUserThreadStart

ntdll!_EH4_CallFilterFunc

ntdll!_except_handler4

ntdll!ExecuteHandler2

ntdll!ExecuteHandler

ntdll!KiUserExceptionDispatcher

ApplicationK!thread_two

ApplicationK!_callthreadstart

ApplicationK!_threadstart

kernel32!BaseThreadInitThunk

ntdll!__RtlUserThreadStart

ntdll!_RtlUserThreadStart
2 Id: f00.f1c Suspend: 1 Teb: 7efd7000 Unfrozen
ntdll!NtDelayExecution

KERNELBASE!SleepEx

KERNELBASE!Sleep

kernel32!WerpReportFault

kernel32!BasepReportFault

kernel32!UnhandledExceptionFilter

ntdll!__RtlUserThreadStart

ntdll!_EH4_CallFilterFunc

ntdll!_except_handler4

ntdll!ExecuteHandler2

ntdll!ExecuteHandler

ntdll!KiUserExceptionDispatcher

ApplicationK!thread_two

ApplicationK!_callthreadstart

ApplicationK!_threadstart

kernel32!BaseThreadInitThunk

ntdll!__RtlUserThreadStart

ntdll!_RtlUserThreadStart
0:000> !uniqstack

Processing 3 threads, please wait
.  0  Id: f00.f04 Suspend: 0 Teb: 7efdd000 Unfrozen

      Start: ApplicationK!mainCRTStartup (013a137c)

      Priority: 0  Priority class: 32  Affinity: 3

ChildEBP RetAddr

0037f1a4 770d0bdd ntdll!NtWaitForMultipleObjects+0x15

0037f240 7529162d KERNELBASE!WaitForMultipleObjectsEx+0x100

0037f288 75291921 kernel32!WaitForMultipleObjectsExImplementation+0xe0

0037f2a4 752b9b2d kernel32!WaitForMultipleObjects+0x18

0037f310 752b9bca kernel32!WerpReportFaultInternal+0x186

0037f324 752b98f8 kernel32!WerpReportFault+0x70

0037f334 752b9875 kernel32!BasepReportFault+0x20

0037f3c0 77b10df7 kernel32!UnhandledExceptionFilter+0x1af

0037f3c8 77b10cd4 ntdll!__RtlUserThreadStart+0x62

0037f3dc 77b10b71 ntdll!_EH4_CallFilterFunc+0x12

0037f404 77ae6ac9 ntdll!_except_handler4+0x8e

0037f428 77ae6a9b ntdll!ExecuteHandler2+0x26

0037f4d8 77ab010f ntdll!ExecuteHandler+0x24

0037f4d8 770d280c ntdll!KiUserExceptionDispatcher+0xf

0037f824 013a1035 KERNELBASE!DebugBreak+0x2

0037f828 013a1325 ApplicationK!main+0x25

0037f870 75293677 ApplicationK!__tmainCRTStartup+0xfb

0037f87c 77ad9f02 kernel32!BaseThreadInitThunk+0xe

0037f8bc 77ad9ed5 ntdll!__RtlUserThreadStart+0x70

0037f8d4 00000000 ntdll!_RtlUserThreadStart+0x1b
.  1  Id: f00.f18 Suspend: 1 Teb: 7efda000 Unfrozen

      Start: ApplicationK!_threadstart (013a10d1)

      Priority: 0  Priority class: 32  Affinity: 3

ChildEBP RetAddr

0080f9ac 770d31bb ntdll!NtDelayExecution+0x15

0080fa14 770d3a8b KERNELBASE!SleepEx+0x65

0080fa24 752d28dd KERNELBASE!Sleep+0xf

0080fa38 752b98f8 kernel32!WerpReportFault+0x3f

0080fa48 752b9875 kernel32!BasepReportFault+0x20

0080fad4 77b10df7 kernel32!UnhandledExceptionFilter+0x1af

0080fadc 77b10cd4 ntdll!__RtlUserThreadStart+0x62

0080faf0 77b10b71 ntdll!_EH4_CallFilterFunc+0x12

0080fb18 77ae6ac9 ntdll!_except_handler4+0x8e

0080fb3c 77ae6a9b ntdll!ExecuteHandler2+0x26

0080fbec 77ab010f ntdll!ExecuteHandler+0x24

0080fbec 013a1000 ntdll!KiUserExceptionDispatcher+0xf

0080ff38 013a10ab ApplicationK!thread_two

0080ff70 013a1147 ApplicationK!_callthreadstart+0x1b

0080ff78 75293677 ApplicationK!_threadstart+0x76

0080ff84 77ad9f02 kernel32!BaseThreadInitThunk+0xe

0080ffc4 77ad9ed5 ntdll!__RtlUserThreadStart+0x70

0080ffdc 00000000 ntdll!_RtlUserThreadStart+0x1b
Total threads: 3

Duplicate callstacks: 1(windbg thread #s follow):

2
Generally, any property can be chosen to form such a set from a collection of stack traces.
- Dmitry Vostokov @ DumpAnalysis.org + TraceAnalysis.org -
Today we introduce an icon for Missing Component (general) pattern:
B/W
![]()
Color
![]()
- Dmitry Vostokov @ DumpAnalysis.org + TraceAnalysis.org -
This is a new pattern about activation contexts. Here we have software exceptions STATUS_SXS_*, for example:
STATUS_SXS_EARLY_DEACTIVATION 0xC015000F
STATUS_SXS_INVALID_DEACTIVATION 0xC0150010
0:000> !analyze -v
[...]
EXCEPTION_RECORD:  ffffffff -- (.exr 0xffffffffffffffff)

ExceptionAddress: 77a54441 (ntdll!RtlDeactivateActivationContext+0x00000154)

   ExceptionCode: c015000f

  ExceptionFlags: 00000000

NumberParameters: 3

   Parameter[0]: 00000000

   Parameter[1]: 0056cbe8

   Parameter[2]: 0056cc18
EXCEPTION_CODE: (NTSTATUS) 0xc015000f - The activation context being deactivated is not the most recently activated one.
CONTEXT:  003df6c8 -- (.cxr 0x3df6c8)

eax=003df9bc ebx=13050002 ecx=00000000 edx=00000000 esi=0056cbe8 edi=0056cc18

eip=77a54441 esp=003df9b0 ebp=003dfa0c iopl=0  nv up ei pl nz na pe nc

cs=0023  ss=002b  ds=002b  es=002b  fs=0053  gs=002b  efl=00000206

ntdll!RtlDeactivateActivationContext+0x154:

77a54441 8b36 mov    esi,dword ptr [esi]  ds:002b:0056cbe8=0056cbb8

Resetting default scope
STACK_TEXT:

003dfa0c 755aa138 005507d0 13050002 003dfa7c ntdll!RtlDeactivateActivationContext+0×154

003dfa1c 002b1235 00000000 13050002 3a92c68c kernel32!DeactivateActCtx+0×31

003dfa7c 002b13b5 00000001 01f01e98 01f01ec8 TestActCtx!wmain+0×225

003dfac4 75593677 7efde000 003dfb10 77a09f02 TestActCtx!__tmainCRTStartup+0xfa

003dfad0 77a09f02 7efde000 7e35c89d 00000000 kernel32!BaseThreadInitThunk+0xe

003dfb10 77a09ed5 002b140c 7efde000 ffffffff ntdll!__RtlUserThreadStart+0×70

003dfb28 00000000 002b140c 7efde000 00000000 ntdll!_RtlUserThreadStart+0×1b
The ReactOS code for RtlDeactivateActivationContext function suggests the following line of inquiry:
0:000> dt _TEB

TestActCtx!_TEB

   +0x000 NtTib            : _NT_TIB

   +0x01c EnvironmentPointer : Ptr32 Void

   +0x020 ClientId         : _CLIENT_ID

   +0x028 ActiveRpcHandle  : Ptr32 Void

   +0x02c ThreadLocalStoragePointer : Ptr32 Void

   +0x030 ProcessEnvironmentBlock : Ptr32 _PEB

   +0x034 LastErrorValue   : Uint4B

   +0x038 CountOfOwnedCriticalSections : Uint4B

   +0x03c CsrClientThread  : Ptr32 Void

   +0x040 Win32ThreadInfo  : Ptr32 Void

   +0x044 User32Reserved   : [26] Uint4B

   +0x0ac UserReserved     : [5] Uint4B

   +0x0c0 WOW32Reserved    : Ptr32 Void

   +0x0c4 CurrentLocale    : Uint4B

   +0x0c8 FpSoftwareStatusRegister : Uint4B

   +0x0cc SystemReserved1  : [54] Ptr32 Void

   +0x1a4 ExceptionCode    : Int4B

   +0×1a8 ActivationContextStack : _ACTIVATION_CONTEXT_STACK

   +0×1bc SpareBytes1      : [24] UChar

   +0×1d4 GdiTebBatch      : _GDI_TEB_BATCH

   +0×6b4 RealClientId     : _CLIENT_ID

   +0×6bc GdiCachedProcessHandle : Ptr32 Void

   +0×6c0 GdiClientPID     : Uint4B

   +0×6c4 GdiClientTID     : Uint4B

   +0×6c8 GdiThreadLocalInfo : Ptr32 Void

   +0×6cc Win32ClientInfo  : [62] Uint4B

   +0×7c4 glDispatchTable  : [233] Ptr32 Void

   +0xb68 glReserved1      : [29] Uint4B

   +0xbdc glReserved2      : Ptr32 Void

   +0xbe0 glSectionInfo    : Ptr32 Void

   +0xbe4 glSection        : Ptr32 Void

   +0xbe8 glTable          : Ptr32 Void

   +0xbec glCurrentRC      : Ptr32 Void

   +0xbf0 glContext        : Ptr32 Void

   +0xbf4 LastStatusValue  : Uint4B

   +0xbf8 StaticUnicodeString : _UNICODE_STRING

   +0xc00 StaticUnicodeBuffer : [261] Wchar

   +0xe0c DeallocationStack : Ptr32 Void

   +0xe10 TlsSlots         : [64] Ptr32 Void

   +0xf10 TlsLinks         : _LIST_ENTRY

   +0xf18 Vdm              : Ptr32 Void

   +0xf1c ReservedForNtRpc : Ptr32 Void

   +0xf20 DbgSsReserved    : [2] Ptr32 Void

   +0xf28 HardErrorMode    : Uint4B

   +0xf2c Instrumentation  : [16] Ptr32 Void

   +0xf6c WinSockData      : Ptr32 Void

   +0xf70 GdiBatchCount    : Uint4B

   +0xf74 InDbgPrint       : UChar

   +0xf75 FreeStackOnTermination : UChar

   +0xf76 HasFiberData     : UChar

   +0xf77 IdealProcessor   : UChar

   +0xf78 Spare3           : Uint4B

   +0xf7c ReservedForPerf  : Ptr32 Void

   +0xf80 ReservedForOle   : Ptr32 Void

   +0xf84 WaitingOnLoaderLock : Uint4B

   +0xf88 Wx86Thread       : _Wx86ThreadState

   +0xf94 TlsExpansionSlots : Ptr32 Ptr32 Void

   +0xf98 ImpersonationLocale : Uint4B

   +0xf9c IsImpersonating  : Uint4B

   +0xfa0 NlsCache         : Ptr32 Void

   +0xfa4 pShimData        : Ptr32 Void

   +0xfa8 HeapVirtualAffinity : Uint4B

   +0xfac CurrentTransactionHandle : Ptr32 Void

   +0xfb0 ActiveFrame      : Ptr32 _TEB_ACTIVE_FRAME

   +0xfb4 FlsData          : Ptr32 Void
0:000> dt _ACTIVATION_CONTEXT_STACK

TestActCtx!_ACTIVATION_CONTEXT_STACK

   +0x000 Flags            : Uint4B

   +0x004 NextCookieSequenceNumber : Uint4B

   +0x008 ActiveFrame      : Ptr32 _RTL_ACTIVATION_CONTEXT_STACK_FRAME

   +0x00c FrameListCache   : _LIST_ENTRY
0:000> dt _RTL_ACTIVATION_CONTEXT_STACK_FRAME

ntdll!_RTL_ACTIVATION_CONTEXT_STACK_FRAME

   +0x000 Previous         : Ptr32 _RTL_ACTIVATION_CONTEXT_STACK_FRAME

   +0x004 ActivationContext : Ptr32 _ACTIVATION_CONTEXT

   +0x008 Flags            : Uint4B
0:000> dd 0056cc18 l4

0056cc18  0056cbe8 0056ca6c 00000028 13050003
0:000> dd 0056cbe8

0056cbe8  0056cbb8 0056c934 00000028 13050002

0056cbf8  00000000 00000000 00000000 00000000

0056cc08  00000000 00000000 00000000 00000000

0056cc18  0056cbe8 0056ca6c 00000028 13050003

0056cc28  00000000 00000000 00000000 00000000

0056cc38  00000000 00000000 00000000 00000000

0056cc48  00000000 00000000 0000000c 00000000

0056cc58  00000000 00000000 00000000 00000000
0:000> dd 0056cbb8

0056cbb8  00000000 0056c7fc 00000028 13050001

0056cbc8  00000000 00000000 00000000 00000000

0056cbd8  00000000 00000000 00000000 00000000

0056cbe8  0056cbb8 0056c934 00000028 13050002

0056cbf8  00000000 00000000 00000000 00000000

0056cc08  00000000 00000000 00000000 00000000

0056cc18  0056cbe8 0056ca6c 00000028 13050003

0056cc28  00000000 00000000 00000000 00000000
We see that a different cookie was found on top of the thread activation stack and the code raised the runtime exception.
For this pattern I have also created a modeling application and present its source code with additional memory dump analysis in a separate post.
- Dmitry Vostokov @ DumpAnalysis.org + TraceAnalysis.org -
Today we introduce an icon for Multiple Exceptions (managed space) pattern:
B/W
![]()
Color
![]()
- Dmitry Vostokov @ DumpAnalysis.org + TraceAnalysis.org -
Due to the need to extend existing basic and intermediate Accelerated Windows Memory Dump Analysis training Memory Dump Analysis Services organises advanced training course. Here is the description and registration information:
Learn how to navigate through memory dump space and Windows data structures to troubleshoot and debug complex software incidents. We use a unique and innovative pattern-driven analysis approach to speed up the learning curve. The training consists of practical step-by-step exercises using WinDbg to diagnose structural and behavioral patterns in 32-bit and 64-bit process, kernel and complete memory dumps.

If you are registered you are allowed to optionally submit your memory dumps before the training. This will allow us in addition to the carefully constructed problems tailor extra examples to the needs of the attendees.
The training consists of one four-hour session and additional homework exercises. When you finish the training you additionally get:
Prerequisites: Basic and intermediate level Windows memory dump analysis: ability to list processors, processes, threads, modules, apply symbols, walk through stack traces and raw stack data, diagnose patterns such as heap corruption, CPU spike, memory and handle leaks, access violation, stack overflow, critical section and resource wait chains and deadlocks. If you don’t feel comfortable with prerequisites then Accelerated Windows Memory Dump Analysis training is recommended to take (or purchase a corresponding book) before attending this course.
Audience: Software developers, software technical support and escalation engineers.
Session: December 9, 2011 4:00 PM - 8:00 PM GMT
Price: 210 USD
Space is limited.
Reserve your remote training seat now at:
https://student.gototraining.com/24s4l/register/3788047691824598784
- Dmitry Vostokov @ DumpAnalysis.org + TraceAnalysis.org -
Finally you can even learn a WinDbg command from a certificate. Memory Dump Analysis Services has created a certificate with dv WinDbg command on it:

Source: http://www.dumpanalysis.com/sample-certificate
- Dmitry Vostokov @ DumpAnalysis.org + TraceAnalysis.org -
Due to popular demand and the need to extend existing Accelerated Windows Memory Dump Analysis training Memory Dump Analysis Services organises the new training course. Here is the description and registration information:
Learn how to analyze .NET application and service crashes and freezes, navigate through memory dump space (managed and unmanaged code) and diagnose corruption, leaks, CPU spikes, blocked threads, deadlocks, wait chains, resource contention, and much more. We use a unique and innovative pattern-driven analysis approach to speed up the learning curve. The training consists of practical step-by-step exercises using WinDbg to diagnose patterns in 32-bit and 64-bit process memory dumps.

If you are registered you are allowed to optionally submit your memory dumps before the training. This will allow us in addition to the carefully constructed problems tailor extra examples to the needs of the attendees.
The training consists of one four-hour session and additional homework exercises. When you finish the training you additionally get:
Prerequisites: Basic .NET programming and debugging.
Audience: Software developers, software technical support and escalation engineers.
Session: October 28, 2011 4:00 PM - 8:00 PM GMT
Price: 210 USD
Space is limited.
Reserve your remote training seat now at:
https://student.gototraining.com/24s4l/register/423991811034037760
- Dmitry Vostokov @ DumpAnalysis.org + TraceAnalysis.org -
Recently when looking at one of process memory dumps with CLR runtime I got this message when trying to load SOS extension from the appropriate Framework location:
0:022> .load [..]\Microsoft.NET\Framework\v2.0.50727\sos.dll

------------------------------------------------------------

sos.dll needs a full memory dump for complete functionality.

You can create one with .dump /ma <filename>

------------------------------------------------------------
So I literally did what was asked by saving a new dump from the dump:
0:022> .dump /ma c:\userdumps\dump-as-asked.dmp

Creating c:\userdumps\dump-as-asked.dmp - mini user dump

Dump successfully written
I got a slightly bigger dump than the original and after that SOS didn’t complain when I opened the new dump and loaded the extension.
- Dmitry Vostokov @ DumpAnalysis.org + TraceAnalysis.org -
I showed this artwork to many people and they responded that they didn’t understand or hope one day they would understand. Only one guy (a professional manager) responded positively with understanding. What I think is that real art can be interpreted in many ways. So I kindly await your criticism.
PS. This Computicart (Computical Art) work was inspired by a pet parrot at home. I’ve been observing its behaviour for more than 6 months and tried to discern a few patterns. Its name is KiKi (not related to Ki* functions).
- Dmitry Vostokov @ DumpAnalysis.org + TraceAnalysis.org -
Finction (or simply Finc) - A function with a flaw, having abnormal behaviour, a candidate for a fix or axing.
Examples: After delivering a hotfix with axed code they were embarrassed to see that finction again on a stack trace.
Etymology: Derives from “function”. Inspired by MDAA V3 errata.
- Dmitry Vostokov @ DumpAnalysis.org + TraceAnalysis.org -
UI Message pattern is very useful for troubleshooting system-wide issues because we can map visual behaviour to various activity regions and consider such messages as significant events.
#    Module  PID  TID  Time         Message

[...]

2782 ModuleA 2124 5648 10:58:03.356 CreateWindow: Title "..." Class "..."

[...]

3512 ModuleA 2124 5648 10:58:08.154 Menu command: Save Data

[...]

3583 ModuleA 2124 5648 10:58:08.155 CreateWindow: Title "Save As" Class "Dialog"

[... Data update and replication related messages ...]

4483 ModuleA 2124 5648 10:58:12.342 DestroyWindow: Title "Save As" Class "Dialog"

[...]
By filtering the emitting module we can create an adjoint thread:
#    Module  PID  TID  Time         Message

[...]

2782 ModuleA 2124 5648 10:58:03.356 CreateWindow: Title "..." Class "..."

3512 ModuleA 2124 5648 10:58:08.154 Menu command: Save Data

3583 ModuleA 2124 5648 10:58:08.155 CreateWindow: Title "Save As" Class "Dialog"

4483 ModuleA 2124 5648 10:58:12.342 DestroyWindow: Title "Save As" Class "Dialog"

[...]
- Dmitry Vostokov @ DumpAnalysis.org + TraceAnalysis.org -
Second Eye (or sometimes a stronger variant “second pair of eyes”) - another engineer you typically need when you don’t see anything useful in a memory dump, software trace or source code for problem resolution purposes. You are anxious to recommend something useful.
Examples: Don’t see anything in this huge trace. I need a second eye.
- Dmitry Vostokov @ DumpAnalysis.org + TraceAnalysis.org -
One way to quickly check for something suspicious in a memory dump is to convert it to a debugger log (for example, stack trace collection) and search for textual strings such as “Waiting for“, “Terminate“, “Stop”, “Mutant“, “Exception“, “Crit“, “MessageBox“, “SuspendCount“, etc. The vocabulary, of course, is OS dependent, can have false positives, and can change over time. We name this pattern Problem Vocabulary. It is similar to Vocabulary Index software trace analysis pattern.
For example, recently in a complete memory dump involving lots of ALPC wait chains with potential inter-process deadlock we found the following thread having long waiting time (exceeding ALPC threads waiting times) pointing to a process object to examine further:
THREAD fffffa801338b950  Cid 02a0.7498  Teb: 000007fffffd8000 Win32Thread: 0000000000000000 WAIT: (UserRequest) UserMode Non-Alertable

    fffffa8012a39b30  ProcessObject

Not impersonating

DeviceMap                 fffff8a000008a70

Owning Process            fffffa800a31d040       Image:         smss.exe

Attached Process          N/A            Image:         N/A

Wait Start TickCount      9752080        Ticks: 5334204 (0:23:09:06.937)

Context Switch Count      38

UserTime                  00:00:00.000

KernelTime                00:00:00.000

Win32 Start Address ntdll!TppWorkerThread (0×000000007722fbc0)

Stack Init fffff88020259db0 Current fffff88020259900

Base fffff8802025a000 Limit fffff88020254000 Call 0

Priority 11 BasePriority 11 UnusualBoost 0 ForegroundBoost 0 IoPriority 2 PagePriority 5

Kernel stack not resident.

Child-SP          RetAddr           Call Site

fffff880`20259940 fffff800`01693f92 nt!KiSwapContext+0×7a

fffff880`20259a80 fffff800`016967af nt!KiCommitThreadWait+0×1d2

fffff880`20259b10 fffff800`01984b2e nt!KeWaitForSingleObject+0×19f

fffff880`20259bb0 fffff800`0168df93 nt!NtWaitForSingleObject+0xde

fffff880`20259c20 00000000`7726135a nt!KiSystemServiceCopyEnd+0×13 (TrapFrame @ fffff880`20259c20)

00000000`0048f648 00000000`48026517 ntdll!NtWaitForSingleObject+0xa

00000000`0048f650 00000000`480269c4 smss!SmpTerminateCSR+0xa3

00000000`0048f6a0 00000000`48023670 smss!SmpStopCsr+0×44

00000000`0048f6d0 00000000`77288137 smss!SmpApiCallback+0×338

00000000`0048f900 00000000`7722feff ntdll! ?? ::FNODOBFM::`string’+0×1f718

00000000`0048f990 00000000`77274a00 ntdll!TppWorkerThread+0×3f8

00000000`0048fc90 00000000`00000000 ntdll!RtlUserThreadStart+0×25
In that process we could see a blocking module and recommended to contact its vendor:
- Dmitry Vostokov @ DumpAnalysis.org + TraceAnalysis.org -
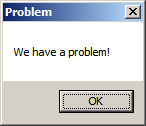
As a part of unified debugging pattern and generative debugging approach we extend software behavior analysis patterns such as memory dump and software trace analysis with UI abnormal behaviour patterns. Here by abnormality we mean behavior that users should not encounter while using software. Typical example is some error message or GUI distortion during execution of a functional use case. Such patterns will extend software behavior analysis pattern language we use for description of various post-construction software problems.
The first pattern we start with is called Error Message Box and we link it to Message Box and Self-Diagnosis memory analysis patterns. You can download x86 and x64 modeling examples from this location:
When we start the application it shows a message box:
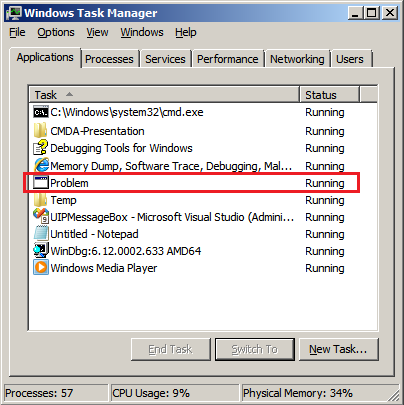
We then launch Task Manager and find the window:
Then we save a crash dump using right-click context menu:
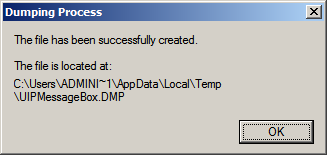
When we open the process memory dump we see this stack trace:
0:000> ~*kL
.  0  Id: d30.71c Suspend: 0 Teb: 000007ff`fffdd000 Unfrozen

Child-SP          RetAddr           Call Site

00000000`002ff1e8 00000000`77837214 user32!ZwUserWaitMessage+0xa

00000000`002ff1f0 00000000`778374a5 user32!DialogBox2+0x274

00000000`002ff280 00000000`778827f0 user32!InternalDialogBox+0x135

00000000`002ff2e0 00000000`77881ae5 user32!SoftModalMessageBox+0x9b4

00000000`002ff410 00000000`7788133b user32!MessageBoxWorker+0x31d

00000000`002ff5d0 00000000`77881232 user32!MessageBoxTimeoutW+0xb3

00000000`002ff6a0 00000001`3ffa101d user32!MessageBoxW+0×4e

00000000`002ff6e0 00000001`3ffa1039 UIPMessageBox!bar+0×1d

00000000`002ff710 00000001`3ffa1052 UIPMessageBox!foo+0×9

00000000`002ff740 00000001`3ffa11ea UIPMessageBox!wmain+0×12

00000000`002ff770 00000000`7770f56d UIPMessageBox!__tmainCRTStartup+0×15a

00000000`002ff7b0 00000000`77942cc1 kernel32!BaseThreadInitThunk+0xd

00000000`002ff7e0 00000000`00000000 ntdll!RtlUserThreadStart+0×1d
We see there that foo function called bar function which displayed the message box. In real scenarios function name could me more meaningful and give a clue for troubleshooting and debugging in addition to message text:
0:000> ub 00000001`3ffa101d

UIPMessageBox!__unguarded_readlc_active+0xfff:

00000001`3ffa0fff add     byte ptr [rax-7Dh],cl

00000001`3ffa1002 in      al,dx

00000001`3ffa1003 sub     byte ptr [rbp+33h],al

00000001`3ffa1006 leave

00000001`3ffa1007 lea     r8,[UIPMessageBox!__mnames+0×28 (00000001`3ffa83c8)]

00000001`3ffa100e lea     rdx,[UIPMessageBox!__mnames+0×38 (00000001`3ffa83d8)]

00000001`3ffa1015 xor     ecx,ecx

00000001`3ffa1017 call    qword ptr [UIPMessageBox!_imp_MessageBoxW (00000001`3ffa71d8)]
0:000> du 00000001`3ffa83c8

00000001`3ffa83c8  “Problem”
0:000> du 00000001`3ffa83d8

00000001`3ffa83d8  “We have a problem!”
- Dmitry Vostokov @ DumpAnalysis.org + TraceAnalysis.org -

