Archive for March 22nd, 2012

Trace Analysis Patterns (Part 46)

Thursday, March 22nd, 2012

Narrative theory distinguishes between frame types such as (Fludernik, McHale, Nelles, Wolf):

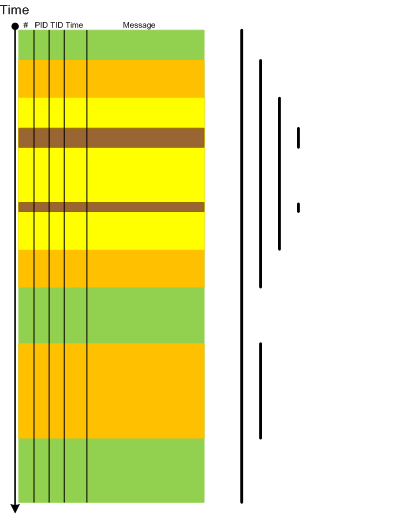
- introductory framing (missing end frame) [—————————-

- terminal framing (missing opening frame) —————————-]

- [—————————-]

- interpolated framing [—-[  ]—-[     ]——–]

At the level of the software trace or an adjoint thread as a whole the first 3 types correspond to various types of this pattern Partition: Head, Prologue, Core, Epilogue, Tail where certain parts are missing. The first 2 types can also be instances of Truncated Trace pattern. Interpolated framing can be an instance of multiple discontinuities. All 4 types also correspond to foreground component messages and in general we have multiple Trace Frames as depicted:

- Dmitry Vostokov @ DumpAnalysis.org + TraceAnalysis.org -

Crash Dump Analysis Patterns (Part 169)

Thursday, March 22nd, 2012

This is another “blockage” pattern called Blocked DPC. Here we have blocked per-processor Deferred Procedure Call queues because of threads running on processors with IRQL > DISPATCH_LEVEL. For example, on the processor 11 (0×0b):

11: kd> !dpcs
CPU Type      KDPC       Function
3: Normal  : 0x8accacec 0xf710567a DriverA

5: Normal  : 0x89f449e4 0xf595b83a DriverB

7: Normal  : 0x8a63664c 0xf59e3f04 USBPORT!USBPORT_IsrDpc

11: Normal  : 0x8acb2cec 0xf710567a DriverA
11: Normal  : 0x8b5e955c 0xf73484e6 ACPI!ACPIInterruptServiceRoutineDPC

11: kd> !thread
THREAD 89806428  Cid 0934.0944  Teb: 7ffdb000 Win32Thread: bc17dda0 RUNNING on processor b
Not impersonating
DeviceMap                 e1002258
Owning Process            89972290       Image:         ApplicationA.exe
Attached Process          N/A            Image:         N/A
Wait Start TickCount      2863772        Ticks: 368905 (0:01:36:04.140)
Context Switch Count      145085                 LargeStack
UserTime                  00:00:00.015
KernelTime                01:36:04.203
Win32 Start Address MSVCR90!_threadstartex (0×7854345e)
Start Address kernel32!BaseThreadStartThunk (0×77e617ec)
Stack Init f3f63000 Current f3f62c4c Base f3f63000 Limit f3f5f000 Call 0
Priority 10 BasePriority 10 PriorityDecrement 0
ChildEBP RetAddr  Args to Child
f777d3b0 f3f62d28 00000010 00000000 00000000 hal!KeAcquireInStackQueuedSpinLockRaiseToSynch+0×36
WARNING: Frame IP not in any known module. Following frames may be wrong.
f777d3b4 00000000 00000000 00000000 00000000 0xf3f62d28

- Dmitry Vostokov @ DumpAnalysis.org + TraceAnalysis.org -

Meta-Memory Dump Patterns

Thursday, March 22nd, 2012

A page to reference all different kinds of patterns related to memory dumps as a whole and their properties is necessary, so I created this post:

I’ll update it as soon as I add more similar patterns.

- Dmitry Vostokov @ DumpAnalysis.org + TraceAnalysis.org -