WDPF book is available on Kindle platform

July 22nd, 2010

I’m pleased to announce that my book Windows Debugging: Practical Foundations is available on Amazon Kindle platform. It has been reformatted and edited to make it fit into the smallest Kindle device and pictures were specifically tailored to improve their viewing experience. The price has dropped to $9.99 (excluding possible VAT and international delivery if any). Please let me know if you have any problems with the content and I make any changes as soon as possible.

Windows Debugging: Practical Foundations (Kindle Edition)

Buy Kindle from Amazon

- Dmitry Vostokov @ DumpAnalysis.org + TraceAnalysis.org -

Icons for Memory Dump Analysis Patterns (Part 60)

July 22nd, 2010

Today we introduce an icon for High Contention (processors) pattern:

B/W

Color

- Dmitry Vostokov @ DumpAnalysis.org + TraceAnalysis.org -

Crash Dump Analysis Patterns (Part 29c)

July 21st, 2010

This is a variant of High Contention pattern for processors where we have more threads at the same priority than the available processors. All these threads share the same notification event (or any other similar synchronization mechanism) and rush once it is signalled. If this happens often the system becomes sluggish or even appears frozen.

0: kd> !running

System Processors 3 (affinity mask)
  Idle Processors 0

Prcbs  Current   Next   
  0    ffdff120  89a92020            O...............
  1    f7737120  89275020            W...............

0: kd> !ready
Processor 0: Ready Threads at priority 8
    THREAD 894a1db0  Cid 1a98.25c0  Teb: 7ffde000 Win32Thread: bc19cea8 READY
    THREAD 897c4818  Cid 11d8.1c5c  Teb: 7ffa2000 Win32Thread: bc2c5ba8 READY
    THREAD 8911fd18  Cid 2730.03f4  Teb: 7ffd9000 Win32Thread: bc305830 READY
Processor 1: Ready Threads at priority 8
    THREAD 89d89db0  Cid 1b10.20ac  Teb: 7ffd7000 Win32Thread: bc16e680 READY
    THREAD 891f24a8  Cid 1e2c.20d0  Teb: 7ffda000 Win32Thread: bc1b9ea8 READY
    THREAD 89214db0  Cid 1e2c.24d4  Teb: 7ffd7000 Win32Thread: bc24ed48 READY
    THREAD 89a28020  Cid 1b10.21b4  Teb: 7ffa7000 Win32Thread: bc25b3b8 READY
    THREAD 891e03b0  Cid 1a98.05c4  Teb: 7ffdb000 Win32Thread: bc228bb0 READY
    THREAD 891b0020  Cid 1cd0.0144  Teb: 7ffde000 Win32Thread: bc205ea8 READY

All these threads have common stack trace (I show only a few threads here):

0: kd> !thread 89a92020 1f
THREAD 89a92020  Cid 11d8.27d8  Teb: 7ffd9000 Win32Thread: bc1e6860 RUNNING on processor 0
Not impersonating
DeviceMap                 e502b248
Owning Process            89e2a020       Image:         ProcessA.exe
Attached Process          N/A            Image:         N/A
Wait Start TickCount      336581         Ticks: 0
Context Switch Count      61983                 LargeStack
UserTime                  00:00:00.156
KernelTime                00:00:00.281
Win32 Start Address ntdll!RtlpWorkerThread (0x7c839f2b)
Start Address kernel32!BaseThreadStartThunk (0x77e617ec)
Stack Init f3730000 Current f372f7e0 Base f3730000 Limit f372c000 Call 0
Priority 8 BasePriority 8 PriorityDecrement 0
ChildEBP RetAddr 
f3cc98e8 f6e21915 DriverA+0x1e4d
[...]
f3cc9ac0 f67f05dc nt!IofCallDriver+0x45
[...]
02e7ff44 7c83aa3b ntdll!RtlpWorkerCallout+0x71
02e7ff64 7c83aab2 ntdll!RtlpExecuteWorkerRequest+0x4f
02e7ff78 7c839f90 ntdll!RtlpApcCallout+0x11
02e7ffb8 77e6482f ntdll!RtlpWorkerThread+0x61
02e7ffec 00000000 kernel32!BaseThreadStart+0x34

0: kd> !thread 89275020 1f
THREAD 89275020  Cid 1cd0.2510  Teb: 7ffa9000 Win32Thread: bc343180 RUNNING on processor 1
Not impersonating
DeviceMap                 e1390978
Owning Process            89214708       Image:         ProcessB.exe
Attached Process          N/A            Image:         N/A
Wait Start TickCount      336581         Ticks: 0
Context Switch Count      183429                 LargeStack
UserTime                  00:00:00.171
KernelTime                00:00:00.484
Win32 Start Address ntdll!RtlpWorkerThread (0x7c839f2b)
Start Address kernel32!BaseThreadStartThunk (0x77e617ec)
Stack Init b9f6e000 Current b9f6d7e0 Base b9f6e000 Limit b9f6a000 Call 0
Priority 8 BasePriority 8 PriorityDecrement 0
ChildEBP RetAddr 
b9f6d87c f6e22d4b nt!KeWaitForSingleObject+0x497
b9f6d8e8 f6e21915 DriverA+0x1e4d
[...]
b9f6dac0 f67f05dc nt!IofCallDriver+0x45
[...]
0507ff44 7c83aa3b ntdll!RtlpWorkerCallout+0x71
0507ff64 7c83aab2 ntdll!RtlpExecuteWorkerRequest+0x4f
0507ff78 7c839f90 ntdll!RtlpApcCallout+0x11
0507ffb8 77e6482f ntdll!RtlpWorkerThread+0x61
0507ffec 00000000 kernel32!BaseThreadStart+0x34

0: kd> !thread 89d89db0 1f
THREAD 89d89db0  Cid 1b10.20ac  Teb: 7ffd7000 Win32Thread: bc16e680 READY
Not impersonating
DeviceMap                 e4e3a0b8
Owning Process            898cb020       Image:         ProcessC.exe
Attached Process          N/A            Image:         N/A
Wait Start TickCount      336581         Ticks: 0
Context Switch Count      159844                 LargeStack
UserTime                  00:00:00.234
KernelTime                00:00:00.484
Win32 Start Address ntdll!RtlpWorkerThread (0x7c839f2b)
Start Address kernel32!BaseThreadStartThunk (0x77e617ec)
Stack Init b9e1e000 Current b9e1d7e0 Base b9e1e000 Limit b9e1a000 Call 0
Priority 8 BasePriority 8 PriorityDecrement 0
ChildEBP RetAddr 
b9e1d7f8 80831292 nt!KiSwapContext+0x26
b9e1d818 80828c73 nt!KiExitDispatcher+0xf8
b9e1d830 80829c72 nt!KiAdjustQuantumThread+0x109
b9e1d87c f6e22d4b nt!KeWaitForSingleObject+0x536
b9e1d8e8 f6e21915 DriverA+0x1e4d
[...]
b9e1dac0 f67f05dc nt!IofCallDriver+0x45
[...]
014dff44 7c83aa3b ntdll!RtlpWorkerCallout+0x71
014dff64 7c83aab2 ntdll!RtlpExecuteWorkerRequest+0x4f
014dff78 7c839f90 ntdll!RtlpApcCallout+0x11
014dffb8 77e6482f ntdll!RtlpWorkerThread+0x61

They also share the same synchronization object:

0: kd> .thread 89275020
Implicit thread is now 89275020

0: kd> kv 1
ChildEBP RetAddr  Args to Child             
b9f6d87c f6e22d4b f6e25130 00000006 00000001 nt!KeWaitForSingleObject+0×497

0: kd> .thread 89d89db0
Implicit thread is now 89d89db0

0: kd> kv 4
ChildEBP RetAddr  Args to Child             
b9e1d7f8 80831292 f7737120 f7737b50 f7737a7c nt!KiSwapContext+0x26
b9e1d818 80828c73 00000000 89d89db0 89d89e58 nt!KiExitDispatcher+0xf8
b9e1d830 80829c72 f7737a7c 00000102 00000001 nt!KiAdjustQuantumThread+0x109
b9e1d87c f6e22d4b f6e25130 00000006 00000001 nt!KeWaitForSingleObject+0×536

0: kd> dt _DISPATCHER_HEADER f6e25130
ntdll!_DISPATCHER_HEADER
   +0×000 Type             : 0 ”
   +0×001 Absolute         : 0 ”
   +0×001 NpxIrql          : 0 ”
   +0×002 Size             : 0×4 ”
   +0×002 Hand             : 0×4 ”
   +0×003 Inserted         : 0 ”
   +0×003 DebugActive      : 0 ”
   +0×000 Lock             : 262144
   +0×004 SignalState      : 1
   +0×008 WaitListHead     : _LIST_ENTRY [ 0xf6e25138 - 0xf6e25138 ]

- Dmitry Vostokov @ DumpAnalysis.org + TraceAnalysis.org -

Icons for Memory Dump Analysis Patterns (Part 59)

July 21st, 2010

Today we introduce an icon for Early Crash Dump pattern:

B/W

Color

- Dmitry Vostokov @ DumpAnalysis.org + TraceAnalysis.org -

Fabric of Memory Dumps

July 19th, 2010


- Dmitry Vostokov @ DumpAnalysis.org + TraceAnalysis.org -

Forthcoming Webinar: Fundamentals of Complete Crash and Hang Memory Dump Analysis

July 18th, 2010

Complete Memory Dump Analysis Logo

Memory Dump Analysis Services (DumpAnalysis.com) organizes a free webinar

Date: 18th of August 2010
Time: 21:00 (BST) 16:00 (Eastern) 13:00 (Pacific)
Duration: 90 minutes

Topics include:

- User vs. kernel vs. physical (complete) memory space
- Challenges of complete memory dump analysis
- Common WinDbg commands
- Patterns
- Common mistakes
- Fiber bundles
- Hands-on exercise: a complete memory dump analysis
- A guide to DumpAnalysis.org case studies

Prerequisites: working knowledge of basic user process and kernel memory dump analysis or live debugging using WinDbg 

The webinar link will be posted before 18th of August on DumpAnalysis.com

- Dmitry Vostokov @ DumpAnalysis.org + TraceAnalysis.org -

Can A Memory Dump Be Blue?

July 18th, 2010

Yes, it can. Here’s the Dump2Picture image of a kernel memory dump (3 GB) from a 128 GB system:

Now it’s time to listen to Klaus Schulze album In Blue again.

Buy from Amazon

- Dmitry Vostokov @ DumpAnalysis.org + TraceAnalysis.org -

Stack trace collection, special process, LPC and critical section wait chains, blocked thread, coupled machines, thread waiting time and IRP distribution anomaly: pattern cooperation

July 18th, 2010

It was reported that new remote sessions couldn’t be created. A complete memory dump stack trace collection log lists a special process that would not normally be present in a fully initialized session: userinit.exe. One of its threads is blocked waiting for an LPC response:

kd> !process 0 ff
**** NT ACTIVE PROCESS DUMP ****

[...]

PROCESS 89cf4870  SessionId: 0  Cid: 0fa4    Peb: 7ffde000  ParentCid: 0228
    DirBase: 3c9e6000  ObjectTable: e1627410  HandleCount:  81.
    Image: userinit.exe
    VadRoot 89a80168 Vads 161 Clone 0 Private 517. Modified 4. Locked 0.
    DeviceMap e1003170
    Token                             e1575030
    ElapsedTime                       05:34:29.046
    UserTime                          00:00:00.046
    KernelTime                        00:00:00.234
    QuotaPoolUsage[PagedPool]         42916
    QuotaPoolUsage[NonPagedPool]      7176
    Working Set Sizes (now,min,max)  (1289, 50, 345) (5156KB, 200KB, 1380KB)
    PeakWorkingSetSize                1291
    VirtualSize                       33 Mb
    PeakVirtualSize                   34 Mb
    PageFaultCount                    1411
    MemoryPriority                    BACKGROUND
    BasePriority                      8
    CommitCharge                      866

[...]

THREAD 89d475a8  Cid 0fa4.0f48  Teb: 7ffda000 Win32Thread: 00000000 WAIT: (WrLpcReply) UserMode Non-Alertable
    89d4779c  Semaphore Limit 0x1
Waiting for reply to LPC MessageId 0000acfd:
Current LPC port e5501c28
Not impersonating
DeviceMap                 e1003170
Owning Process            0       Image:         <Unknown>
Attached Process          89cf4870       Image:         userinit.exe
Wait Start TickCount      1845699        Ticks: 1284370 (0:05:34:28.281)
Context Switch Count      149            
UserTime                  00:00:00.000
KernelTime                00:00:00.093
Win32 Start Address PAUTOENR!AEMainThreadProc (0×5e95a798)
Start Address kernel32!BaseThreadStartThunk (0×7c8106f9)
Stack Init b88a1000 Current b88a0c50 Base b88a1000 Limit b889e000 Call 0
Priority 7 BasePriority 7 PriorityDecrement 0 DecrementCount 0
Kernel stack not resident.
ChildEBP RetAddr 
b88a0c68 804e1bf2 nt!KiSwapContext+0×2f
b88a0c74 804e1c3e nt!KiSwapThread+0×8a
b88a0c9c 8057d073 nt!KeWaitForSingleObject+0×1c2
b88a0d50 804dd99f nt!NtRequestWaitReplyPort+0×63d
b88a0d50 7c90e514 nt!KiFastCallEntry+0xfc (TrapFrame @ b88a0d64)
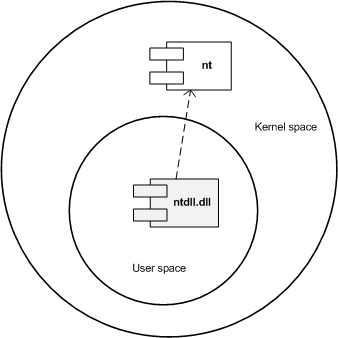
00a8f064 7c90daea ntdll!KiFastSystemCallRet
00a8f068 77e7cac1 ntdll!ZwRequestWaitReplyPort+0xc
00a8f0b4 77e7a33e RPCRT4!LRPC_CCALL::SendReceive+0×228
00a8f0c0 77e7a36f RPCRT4!I_RpcSendReceive+0×24
00a8f0d4 77ef4675 RPCRT4!NdrSendReceive+0×2b
00a8f4b0 76f235e7 RPCRT4!NdrClientCall2+0×222
00a8f4c4 76f2357b DNSAPI!R_ResolverQuery+0×1b
00a8f520 71a526c6 DNSAPI!DnsQuery_W+0×14f
00a8f554 71a5266f mswsock!HostentBlob_Query+0×29
00a8f580 71a51b0a mswsock!Rnr_DoDnsLookup+0×7d
00a8f9c8 71ab32b0 mswsock!NSPLookupServiceNext+0×533
00a8f9e0 71ab3290 WS2_32!NSPROVIDER::NSPLookupServiceNext+0×17
00a8f9fc 71ab325a WS2_32!NSPROVIDERSTATE::LookupServiceNext+0×1c
00a8fa28 71ab31f8 WS2_32!NSQUERY::LookupServiceNext+0xae
00a8fa48 76f775eb WS2_32!WSALookupServiceNextW+0×78
00a8faec 76f6a9d2 WLDAP32!GetHostByNameW+0xef
00a8fb38 76f6667b WLDAP32!OpenLdapServer+0×435
00a8fb58 76f6fb05 WLDAP32!LdapConnect+0×169
00a8fef8 76f704f3 WLDAP32!LdapBind+0×34
00a8ff20 5e95651a WLDAP32!ldap_bind_sW+0×2c
00a8ff68 5e95a887 PAUTOENR!AERobustLdapBind+0xc9
00a8ffb4 7c80b729 PAUTOENR!AEMainThreadProc+0xef
00a8ffec 00000000 kernel32!BaseThreadStart+0×37

We start following the LPC wait chain

kd> !lpc message 0000acfd
Searching message acfd in threads …
    Server thread 89a80328 is working on message acfd                        
Client thread 89d475a8 waiting a reply from acfd                         
Searching thread 89d475a8 in port rundown queues …

Server communication port 0xe12fc438
    Handles: 1   References: 1
    The LpcDataInfoChainHead queue is empty
        Connected port: 0xe5501c28      Server connection port: 0xe1640798

Client communication port 0xe5501c28
    Handles: 1   References: 2
    The LpcDataInfoChainHead queue is empty

Server connection port e1640798  Name: DNSResolver
    Handles: 1   References: 17
    Server process  : 899a0020 (svchost.exe)
    Queue semaphore : 89dabdf0
    Semaphore state 0 (0x0)
    The message queue is empty
    The LpcDataInfoChainHead queue is empty
Done.

kd> !thread 89a80328 1f
THREAD 89a80328  Cid 03c8.0644  Teb: 7ffd7000 Win32Thread: 00000000 WAIT: (WrLpcReply) UserMode Non-Alertable
    89a8051c  Semaphore Limit 0×1
Waiting for reply to LPC MessageId 0000acfe:
Current LPC port e10b6b00
Not impersonating
DeviceMap                 e1b093c8
Owning Process            0       Image:         <Unknown>
Attached Process          899a0020       Image:         svchost.exe
Wait Start TickCount      1845699        Ticks: 1284370 (0:05:34:28.281)
Context Switch Count      1208            
UserTime                  00:00:00.000
KernelTime                00:00:00.000
Win32 Start Address 0×0000acfd
LPC Server thread working on message Id acfd
Start Address kernel32!BaseThreadStartThunk (0×7c8106f9)
Stack Init b7a33000 Current b7a32c50 Base b7a33000 Limit b7a30000 Call 0
Priority 8 BasePriority 8 PriorityDecrement 0 DecrementCount 0
Kernel stack not resident.
ChildEBP RetAddr 
b7a32c68 804e1bf2 nt!KiSwapContext+0×2f
b7a32c74 804e1c3e nt!KiSwapThread+0×8a
b7a32c9c 8057d073 nt!KeWaitForSingleObject+0×1c2
b7a32d50 804dd99f nt!NtRequestWaitReplyPort+0×63d
b7a32d50 7c90e514 nt!KiFastCallEntry+0xfc (TrapFrame @ b7a32d64)
00a9eb3c 7c90daea ntdll!KiFastSystemCallRet
00a9eb40 77e7cac1 ntdll!ZwRequestWaitReplyPort+0xc
00a9eb8c 77e7a33e RPCRT4!LRPC_CCALL::SendReceive+0×228
00a9eb98 77e7a36f RPCRT4!I_RpcSendReceive+0×24
00a9ebac 77ef4675 RPCRT4!NdrSendReceive+0×2b
00a9ef88 662e0c48 RPCRT4!NdrClientCall2+0×222
00a9ef9c 662dafa9 hnetcfg!FwOpenDynamicFwPort+0×1b
00a9f048 71a55025 hnetcfg!IcfOpenDynamicFwPort+0×6a
00a9f0e4 71a590f2 mswsock!WSPBind+0×332
00a9f200 71ab2fd7 mswsock!WSPSendTo+0×230
00a9f250 76f252c0 WS2_32!sendto+0×88
00a9f280 76f251ea DNSAPI!SendMessagePrivate+0×18d
00a9f2a0 76f2517c DNSAPI!SendUsingServerInfo+0×33
00a9f2c8 76f25436 DNSAPI!SendUdpToNextDnsServers+0×80
00a9f314 76f24dec DNSAPI!Dns_SendAndRecvUdp+0×121
00a9f34c 76f24d20 DNSAPI!Dns_SendAndRecv+0×7b
00a9f37c 76f24a7d DNSAPI!Query_SingleName+0×8b
00a9f3b0 7677373a DNSAPI!Query_Main+0×11a
00a9f3c8 7677303f dnsrslvr!ResolverQuery+0×48
00a9f8bc 77e799f4 dnsrslvr!R_ResolverQuery+0×111
00a9f8e4 77ef421a RPCRT4!Invoke+0×30
00a9fcf4 77ef46ee RPCRT4!NdrStubCall2+0×297
00a9fd10 77e794bd RPCRT4!NdrServerCall2+0×19
00a9fd44 77e79422 RPCRT4!DispatchToStubInC+0×38
00a9fd98 77e7934e RPCRT4!RPC_INTERFACE::DispatchToStubWorker+0×113
00a9fdbc 77e7be64 RPCRT4!RPC_INTERFACE::DispatchToStub+0×84
00a9fdf8 77e7bcc1 RPCRT4!LRPC_SCALL::DealWithRequestMessage+0×2db
00a9fe1c 77e7bc05 RPCRT4!LRPC_ADDRESS::DealWithLRPCRequest+0×16d
00a9ff80 77e76caf RPCRT4!LRPC_ADDRESS::ReceiveLotsaCalls+0×310
00a9ff88 77e76ad1 RPCRT4!RecvLotsaCallsWrapper+0xd
00a9ffa8 77e76c97 RPCRT4!BaseCachedThreadRoutine+0×79
00a9ffb4 7c80b729 RPCRT4!ThreadStartRoutine+0×1a
00a9ffec 00000000 kernel32!BaseThreadStart+0×37

We notice that an endpoint is blocked waiting for a critical section:

kd> !lpc message 0000acfe
Searching message acfe in threads …
    Server thread 89b452e8 is working on message acfe
Client thread 89a80328 waiting a reply from acfe                         
Searching thread 89a80328 in port rundown queues …

Server communication port 0xe11152f8
    Handles: 1   References: 1
    The LpcDataInfoChainHead queue is empty
        Connected port: 0xe10b6b00      Server connection port: 0xe1633380

Client communication port 0xe10b6b00
    Handles: 1   References: 4
    The LpcDataInfoChainHead queue is empty

Server connection port e1633380  Name: trkwks
    Handles: 1   References: 19
    Server process  : 89a20858 (svchost.exe)
    Queue semaphore : 89af47e8
    Semaphore state 0 (0x0)
    The message queue is empty
    The LpcDataInfoChainHead queue is empty
Done.

kd> !thread 89b452e8 1f
THREAD 89b452e8  Cid 03a8.0a28  Teb: 7ff94000 Win32Thread: 00000000 WAIT: (UserRequest) UserMode Non-Alertable
    89b466c0  SynchronizationEvent
IRP List:
    89b49008: (0006,01d8) Flags: 00000030  Mdl: 00000000
Not impersonating
DeviceMap                 e1003170
Owning Process            0       Image:         <Unknown>
Attached Process          89a20858       Image:         svchost.exe
Wait Start TickCount      1845699        Ticks: 1284370 (0:05:34:28.281)
Context Switch Count      5            
UserTime                  00:00:00.000
KernelTime                00:00:00.000
Win32 Start Address 0×0000acfe
LPC Server thread working on message Id acfe
Start Address kernel32!BaseThreadStartThunk (0×7c8106f9)
Stack Init b88dd000 Current b88dcca0 Base b88dd000 Limit b88da000 Call 0
Priority 9 BasePriority 8 PriorityDecrement 0 DecrementCount 0
Kernel stack not resident.
ChildEBP RetAddr 
b88dccb8 804e1bf2 nt!KiSwapContext+0×2f
b88dccc4 804e1c3e nt!KiSwapThread+0×8a
b88dccec 8056dff6 nt!KeWaitForSingleObject+0×1c2
b88dcd50 804dd99f nt!NtWaitForSingleObject+0×9a
b88dcd50 7c90e514 nt!KiFastCallEntry+0xfc (TrapFrame @ b88dcd64)
036ef714 7c90df5a ntdll!KiFastSystemCallRet
036ef718 7c91b24b ntdll!ZwWaitForSingleObject+0xc
036ef7a0 7c901046 ntdll!RtlpWaitForCriticalSection+0×132
036ef7a8 6648a33b ntdll!RtlEnterCriticalSection+0×46

036ef7b0 6648c2ed ipnathlp!FwLock+0xa
036ef808 6648c705 ipnathlp!FwDynPortAdd+0×1d
036ef8c4 77e799f4 ipnathlp!FwOpenDynamicFwPort+0×125
036ef8e8 77ef421a RPCRT4!Invoke+0×30
036efcf4 77ef46ee RPCRT4!NdrStubCall2+0×297
036efd10 77e794bd RPCRT4!NdrServerCall2+0×19
036efd44 77e79422 RPCRT4!DispatchToStubInC+0×38
036efd98 77e7934e RPCRT4!RPC_INTERFACE::DispatchToStubWorker+0×113
036efdbc 77e7be64 RPCRT4!RPC_INTERFACE::DispatchToStub+0×84
036efdf8 77e7bcc1 RPCRT4!LRPC_SCALL::DealWithRequestMessage+0×2db
036efe1c 77e7bc05 RPCRT4!LRPC_ADDRESS::DealWithLRPCRequest+0×16d
036eff80 77e76caf RPCRT4!LRPC_ADDRESS::ReceiveLotsaCalls+0×310
036eff88 77e76ad1 RPCRT4!RecvLotsaCallsWrapper+0xd
036effa8 77e76c97 RPCRT4!BaseCachedThreadRoutine+0×79
036effb4 7c80b729 RPCRT4!ThreadStartRoutine+0×1a
036effec 00000000 kernel32!BaseThreadStart+0×37

In order to get a critical section wait chain starting from the above thread we need to set the process context, use !cs WinDbg command, then walk thread stack trace parameters:

kd> .process /r /p 89a20858
Implicit process is now 89a20858

kd> !cs -l -o -s
-----------------------------------------
DebugInfo          = 0x7c97e500
Critical section   = 0x7c980600 (ntdll!FastPebLock+0x0)
LOCKED
LockCount          = 0x10
OwningThread       = 0x000004a8
RecursionCount     = 0x1
LockSemaphore      = 0xC20
SpinCount          = 0x00000000
OwningThread       = .thread 89cd9c10
ntdll!RtlpStackTraceDataBase is NULL. Probably the stack traces are not enabled.
-----------------------------------------
DebugInfo          = 0x000d7f08
Critical section   = 0x01e700d4 (+0x1E700D4)
LOCKED
LockCount          = 0x0
OwningThread       = 0x000001b8
RecursionCount     = 0x1
LockSemaphore      = 0x0
SpinCount          = 0x00000000
OwningThread       = .thread 89b3b348
ntdll!RtlpStackTraceDataBase is NULL. Probably the stack traces are not enabled.
-----------------------------------------
DebugInfo          = 0x000d96e0
Critical section   = 0x767e406c (w32time!g_state+0x24)
LOCKED
LockCount          = 0x3
OwningThread       = 0x00000f70
RecursionCount     = 0x2
LockSemaphore      = 0x7FC
SpinCount          = 0x00000000
OwningThread       = .thread 89a6a268
ntdll!RtlpStackTraceDataBase is NULL. Probably the stack traces are not enabled.
-----------------------------------------
DebugInfo          = 0x000e74f0
Critical section   = 0x01e70cc8 (+0x1E70CC8)
LOCKED
LockCount          = 0x2
OwningThread       = 0x00000514
RecursionCount     = 0x1
LockSemaphore      = 0xBA8
SpinCount          = 0x00000000
OwningThread       = .thread 8996a338
ntdll!RtlpStackTraceDataBase is NULL. Probably the stack traces are not enabled.
-----------------------------------------
DebugInfo          = 0x00103d58
Critical section   = 0x0272a8b4 (+0x272A8B4)
LOCKED
LockCount          = 0x0
OwningThread       = 0x00000d38
RecursionCount     = 0x1
LockSemaphore      = 0x0
SpinCount          = 0x00000000
OwningThread       = .thread 89912860
ntdll!RtlpStackTraceDataBase is NULL. Probably the stack traces are not enabled.
-----------------------------------------
DebugInfo          = 0x0010e8f0
Critical section   = 0x664a3fe0 (ipnathlp!gFwMain+0x0)
LOCKED
LockCount          = 0x6
OwningThread       = 0x000009e8
RecursionCount     = 0x1
LockSemaphore      = 0xC48
SpinCount          = 0x00000000
OwningThread       = .thread 898aa600
ntdll!RtlpStackTraceDataBase is NULL. Probably the stack traces are not enabled.
-----------------------------------------
DebugInfo          = 0x0010a7d8
Critical section   = 0x00138cd0 (+0x138CD0)
LOCKED
LockCount          = 0x0
OwningThread       = 0x00000510
RecursionCount     = 0x1
LockSemaphore      = 0x0
SpinCount          = 0x00000000
OwningThread       = .thread 89a2eda8
ntdll!RtlpStackTraceDataBase is NULL. Probably the stack traces are not enabled.
-----------------------------------------
DebugInfo          = 0x00109cb0
Critical section   = 0x02750f18 (+0x2750F18)
LOCKED
LockCount          = 0x0
OwningThread       = 0x00000c84
RecursionCount     = 0x1
LockSemaphore      = 0x0
SpinCount          = 0x00000000
OwningThread       = .thread 898ba3d0
ntdll!RtlpStackTraceDataBase is NULL. Probably the stack traces are not enabled.

kd> .thread 89b452e8
Implicit thread is now 89b452e8

kd> kv 0n10
ChildEBP RetAddr  Args to Child             
b88dccb8 804e1bf2 89b45358 89b452e8 804e1c3e nt!KiSwapContext+0x2f
b88dccc4 804e1c3e 00000000 00000000 00000000 nt!KiSwapThread+0x8a
b88dccec 8056dff6 00000001 00000006 b88dcd01 nt!KeWaitForSingleObject+0x1c2
b88dcd50 804dd99f 00000c48 00000000 00000000 nt!NtWaitForSingleObject+0x9a
b88dcd50 7c90e514 00000c48 00000000 00000000 nt!KiFastCallEntry+0xfc (TrapFrame @ b88dcd64)
036ef714 7c90df5a 7c91b24b 00000c48 00000000 ntdll!KiFastSystemCallRet
036ef718 7c91b24b 00000c48 00000000 00000000 ntdll!ZwWaitForSingleObject+0xc
036ef7a0 7c901046 004a3fe0 6648a33b 664a3fe0 ntdll!RtlpWaitForCriticalSection+0x132
036ef7a8 6648a33b 664a3fe0 6648c2ed 00000000 ntdll!RtlEnterCriticalSection+0×46
036ef7b0 6648c2ed 00000000 00000000 00000001 ipnathlp!FwLock+0xa

The thread above is waiting for the critical section 664a3fe0 which has the owner thread 898aa600:

[...]
Critical section = 0×664a3fe0 (ipnathlp!gFwMain+0×0)
LOCKED
LockCount = 0×6
OwningThread = 0×000009e8
RecursionCount = 0×1
LockSemaphore = 0xC48
SpinCount = 0×00000000
OwningThread = .thread 898aa600
[…]

kd> .thread 898aa600
Implicit thread is now 898aa600

kd> kv 0n10
ChildEBP RetAddr  Args to Child             
b7b46cb8 804e1bf2 898aa670 898aa600 804e1c3e nt!KiSwapContext+0x2f
b7b46cc4 804e1c3e 00000000 00000000 00000000 nt!KiSwapThread+0x8a
b7b46cec 8056dff6 00000001 00000006 ffffff01 nt!KeWaitForSingleObject+0x1c
b7b46d50 804dd99f 00000c20 00000000 00000000 nt!NtWaitForSingleObject+0x9a
b7b46d50 7c90e514 00000c20 00000000 00000000 nt!KiFastCallEntry+0xfc (TrapFrame @ b7b46d64)
029ef324 7c90df5a 7c91b24b 00000c20 00000000 ntdll!KiFastSystemCallRet
029ef328 7c91b24b 00000c20 00000000 00000000 ntdll!ZwWaitForSingleObject+0xc
029ef3b0 7c901046 00980600 7c910435 7c980600 ntdll!RtlpWaitForCriticalSection+0x132
029ef3b8 7c910435 7c980600 00000000 00000000 ntdll!RtlEnterCriticalSection+0×46
029ef3f8 7c9145d1 00121abe 00121ab0 00000020 ntdll!RtlAcquirePebLock+0×28

The thread 898aa600 is waiting for the critical section 7c980600 which has the owner thread 89cd9c10:

[...]
Critical section = 0×7c980600 (ntdll!FastPebLock+0×0)
LOCKED
LockCount = 0×10
OwningThread = 0×000004a8
RecursionCount = 0×1
LockSemaphore = 0xC20
SpinCount = 0×00000000
OwningThread = .thread 89cd9c10
[…]

kd> .thread 89cd9c10
Implicit thread is now 89cd9c10

kd> kv 100
ChildEBP RetAddr  Args to Child             
b881c8d4 804e1bf2 89cd9c80 89cd9c10 804e1c3e nt!KiSwapContext+0x2f
b881c8e0 804e1c3e 00000000 89e35b08 89e35b34 nt!KiSwapThread+0x8a
b881c908 f783092e 00000000 00000006 00000000 nt!KeWaitForSingleObject+0x1c2
b881c930 f7830a3b 89e35b08 00000000 f78356d8 Mup!PktPostSystemWork+0x3d
b881c94c f7836712 b881c9b0 b881c9b0 b881c9b8 Mup!PktGetReferral+0xce
b881c980 f783644f b881c9b0 b881c9b8 00000000 Mup!PktCreateDomainEntry+0x224
b881c9d0 f7836018 0000000b 00000000 b881c9f0 Mup!DfsFsctrlIsThisADfsPath+0x2bb
b881ca14 f7835829 89a2e130 899ba350 b881caac Mup!CreateRedirectedFile+0x2cd
b881ca70 804e13eb 89f46ee8 89a2e130 89a2e130 Mup!MupCreate+0x1cb
b881ca80 805794b6 89f46ed0 89df3c44 b881cc18 nt!IopfCallDriver+0x31
b881cb60 8056d03b 89f46ee8 00000000 89df3ba0 nt!IopParseDevice+0xa12
b881cbd8 805701e7 00000000 b881cc18 00000042 nt!ObpLookupObjectName+0x53c
b881cc2c 80579b12 00000000 00000000 00003801 nt!ObOpenObjectByName+0xea
b881cca8 80579be1 00cff67c 00100020 00cff620 nt!IopCreateFile+0x407
b881cd04 80579d18 00cff67c 00100020 00cff620 nt!IoCreateFile+0x8e
b881cd44 804dd99f 00cff67c 00100020 00cff620 nt!NtOpenFile+0x27
b881cd44 7c90e514 00cff67c 00100020 00cff620 nt!KiFastCallEntry+0xfc (TrapFrame @ b881cd64)
00cff5f0 7c90d5aa 7c91e8dd 00cff67c 00100020 ntdll!KiFastSystemCallRet
00cff5f4 7c91e8dd 00cff67c 00100020 00cff620 ntdll!ZwOpenFile+0xc
00cff69c 7c831e58 00cff6a8 00460044 0078894a ntdll!RtlSetCurrentDirectory_U+0x169
00cff6b0 7731889e 0078894a 00000000 00000001 kernel32!SetCurrentDirectoryW+0×2b
00cffb84 7730ffbb 00788450 00788b38 00cffbe0 schedsvc!CSchedWorker::RunNTJob+0×221
00cffe34 7730c03a 01ea9108 8ed032d4 00787df8 schedsvc!CSchedWorker::RunJobs+0×304
00cffe74 77310e4d 7c80a749 00000000 00000000 schedsvc!CSchedWorker::RunNextJobs+0×129
00cfff28 77310efc 7730b592 00000000 000ba4bc schedsvc!CSchedWorker::MainServiceLoop+0×6d9
00cfff2c 7730b592 00000000 000ba4bc 0009a2bc schedsvc!SchedMain+0xb
00cfff5c 7730b69f 00000001 000ba4b8 00cfffa0 schedsvc!SchedStart+0×266
00cfff6c 010011cc 00000001 000ba4b8 00000000 schedsvc!SchedServiceMain+0×33
00cfffa0 77df354b 00000001 000ba4b8 0007e898 svchost!ServiceStarter+0×9e
00cfffb4 7c80b729 000ba4b0 00000000 0007e898 ADVAPI32!ScSvcctrlThreadA+0×12
00cfffec 00000000 77df3539 000ba4b0 00000000 kernel32!BaseThreadStart+0×37

kd> du /c 90 0078894a
0078894a  “\\SERVER_B\Share_X$\Folder_Q”

The thread above is blocked trying to set the current directory residing on another server SERVER_B. Its waiting time is almost 13 min 34 sec:

kd> !thread 89cd9c10 7
THREAD 89cd9c10  Cid 03a8.04a8  Teb: 7ffd5000 Win32Thread: e1cdc2c0 WAIT: (UserRequest) KernelMode Non-Alertable
    89e35b34  SynchronizationEvent
IRP List:
    89a2e130: (0006,0094) Flags: 00000884  Mdl: 00000000
    89a13008: (0006,01b4) Flags: 00000000  Mdl: 00000000
Impersonation token:  e2deea00 (Level Impersonation)
DeviceMap                 e1cfe618
Owning Process            0       Image:         <Unknown>
Attached Process          89a20858       Image:         svchost.exe
Wait Start TickCount      4392           Ticks: 3125677 (0:13:33:58.703)
Context Switch Count      202                 LargeStack
UserTime                  00:00:00.031
KernelTime                00:00:00.015
Win32 Start Address ADVAPI32!ScSvcctrlThreadA (0×77df3539)
Start Address kernel32!BaseThreadStartThunk (0×7c8106f9)
Stack Init b881d000 Current b881c8bc Base b881d000 Limit b8819000 Call 0
Priority 8 BasePriority 8 PriorityDecrement 0 DecrementCount 0
ChildEBP RetAddr  Args to Child             
[…] 

Looking at the previous !process 0 ff output we also find the similar system thread running through the same drivers and having the same waiting time:

THREAD 8a04cb30  Cid 0004.0014  Teb: 00000000 Win32Thread: 00000000 WAIT: (Executive) KernelMode Non-Alertable
    89e344a8  SynchronizationEvent
IRP List:
    89901348: (0006,0094) Flags: 00000884  Mdl: 00000000
Not impersonating
DeviceMap                 e1003170
Owning Process            0       Image:         <Unknown>
Attached Process          8a04d830       Image:         System
Wait Start TickCount      4392           Ticks: 3125677 (0:13:33:58.703)
Context Switch Count      1890            
UserTime                  00:00:00.000
KernelTime                00:00:00.109
Start Address nt!ExpWorkerThread (0×804e2311)
Stack Init f78b3000 Current f78b27c0 Base f78b3000 Limit f78b0000 Call 0
Priority 13 BasePriority 13 PriorityDecrement 0 DecrementCount 16
ChildEBP RetAddr 
f78b27d8 804e1bf2 nt!KiSwapContext+0×2f
f78b27e4 804e1c3e nt!KiSwapThread+0×8a
f78b280c f7836328 nt!KeWaitForSingleObject+0×1c2
f78b282c f783622a Mup!MupiIssueQueryRequest+0×2f
f78b2854 f7836069 Mup!MupiResolvePrefix+0×11b
f78b2898 f7835829 Mup!CreateRedirectedFile+0×35d
f78b28f4 804e13eb Mup!MupCreate+0×1cb
f78b2904 805794b6 nt!IopfCallDriver+0×31
f78b29e4 8056d03b nt!IopParseDevice+0xa12
f78b2a5c 805701e7 nt!ObpLookupObjectName+0×53c
f78b2ab0 80579b12 nt!ObOpenObjectByName+0xea
f78b2b2c 80579be1 nt!IopCreateFile+0×407
f78b2b88 80573e2b nt!IoCreateFile+0×8e
f78b2bc8 804dd99f nt!NtCreateFile+0×30
f78b2bc8 804e3597 nt!KiFastCallEntry+0xfc (TrapFrame @ f78b2bfc)
f78b2c6c f78368ca nt!ZwCreateFile+0×11
f78b2cd4 f78306fa Mup!DfsCreateIpcConnection+0×9c
f78b2d60 f7830aae Mup!_PktGetReferral+0×11d
f78b2d7c 804e23d5 Mup!PktWorkInSystemContext+0×4c
f78b2dac 80576316 nt!ExpWorkerThread+0xef
f78b2ddc 804ec6f9 nt!PspSystemThreadStartup+0×34
00000000 00000000 nt!KiThreadStartup+0×16

It has an IRP having file object pointing the same server SERVER_B:

kd> !irp 89901348
Irp is active with 1 stacks 1 is current (= 0×899013b8)
 No Mdl: No System Buffer: Thread 8a04cb30:  Irp stack trace. 
     cmd  flg cl Device   File     Completion-Context
>[  0, 0]   0  0 89f46ee8 899ab170 00000000-00000000   
        \FileSystem\Mup
   Args: f78b2930 03000020 00070080 00000000
kd> !fileobj 899ab170

\SERVER_B\IPC$

Device Object: 0x89f46ee8   \FileSystem\Mup
Vpb is NULL

Flags:  0x2
 Synchronous IO

CurrentByteOffset: 0

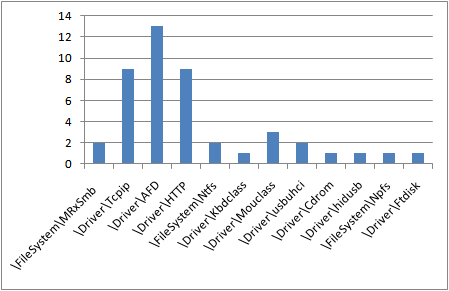
So it looks like we have an instance of Coupled Machines pattern. We also notice that wait chain threads have various Windows socket modules on their thread stacks and we check if there is any IRP distribution anomaly using !irpfind command. Counting IRPs we find the most of them are directed towards HTTP, Tcpip and AFD drivers:

- Dmitry Vostokov @ DumpAnalysis.org + TraceAnalysis.org -

HCI (Debugging Slang, Part 14)

July 16th, 2010

HCI - Hang-Crash Interruption. Based on Human-Computer Interaction.

Examples: I see an HCI issue again and again.

- Dmitry Vostokov @ DumpAnalysis.org + TraceAnalysis.org -

On Unconscious

July 16th, 2010

Computer software is said to be simple and predictable as any mechanism (*). We can debug it, we can completely trace what it is doing. It seems rational to us. Let’s then label it as Conscious. On the outside there is an irrational human being who did program that software. Let’s then label that person’s mind as Unconscious. What about hardware and body? They form parts of HCI (Human-Computer Interaction or Interface).

(*) Is there any life inside Windows?

- Dmitry Vostokov @ DumpAnalysis.org + TraceAnalysis.org -

Icons for Memory Dump Analysis Patterns (Part 58)

July 16th, 2010

Today we introduce an icon for Local Buffer Overflow pattern:

B/W

Color

- Dmitry Vostokov @ DumpAnalysis.org + TraceAnalysis.org -

Crash Dump Analysis Patterns (Part 101)

July 16th, 2010

Sometimes we have threads that wait for a response from another machine (for example, via RPC) and for most of the time Coupled Processes pattern covers that if we assume that processes in that pattern are not restricted to same machine. However, sometimes we have threads that provide hints for dependency on an another machine through their data and that could also involve additional threads from different processes to accomplish the task. Here we have a need for another pattern that I call Coupled Machines. For example, the following thread on a computer SERVER_A is trying to set the current working directory that resides on a computer SERVER_B:

kd> kv 100
ChildEBP RetAddr  Args to Child             
b881c8d4 804e1bf2 89cd9c80 89cd9c10 804e1c3e nt!KiSwapContext+0x2f
b881c8e0 804e1c3e 00000000 89e35b08 89e35b34 nt!KiSwapThread+0x8a
b881c908 f783092e 00000000 00000006 00000000 nt!KeWaitForSingleObject+0x1c2
b881c930 f7830a3b 89e35b08 00000000 f78356d8 Mup!PktPostSystemWork+0x3d
b881c94c f7836712 b881c9b0 b881c9b0 b881c9b8 Mup!PktGetReferral+0xce
b881c980 f783644f b881c9b0 b881c9b8 00000000 Mup!PktCreateDomainEntry+0x224
b881c9d0 f7836018 0000000b 00000000 b881c9f0 Mup!DfsFsctrlIsThisADfsPath+0x2bb
b881ca14 f7835829 89a2e130 899ba350 b881caac Mup!CreateRedirectedFile+0x2cd
b881ca70 804e13eb 89f46ee8 89a2e130 89a2e130 Mup!MupCreate+0x1cb
b881ca80 805794b6 89f46ed0 89df3c44 b881cc18 nt!IopfCallDriver+0x31
b881cb60 8056d03b 89f46ee8 00000000 89df3ba0 nt!IopParseDevice+0xa12
b881cbd8 805701e7 00000000 b881cc18 00000042 nt!ObpLookupObjectName+0x53c
b881cc2c 80579b12 00000000 00000000 00003801 nt!ObOpenObjectByName+0xea
b881cca8 80579be1 00cff67c 00100020 00cff620 nt!IopCreateFile+0x407
b881cd04 80579d18 00cff67c 00100020 00cff620 nt!IoCreateFile+0x8e
b881cd44 804dd99f 00cff67c 00100020 00cff620 nt!NtOpenFile+0x27
b881cd44 7c90e514 00cff67c 00100020 00cff620 nt!KiFastCallEntry+0xfc
00cff5f0 7c90d5aa 7c91e8dd 00cff67c 00100020 ntdll!KiFastSystemCallRet
00cff5f4 7c91e8dd 00cff67c 00100020 00cff620 ntdll!ZwOpenFile+0xc
00cff69c 7c831e58 00cff6a8 00460044 0078894a ntdll!RtlSetCurrentDirectory_U+0x169
00cff6b0 7731889e 0078894a 00000000 00000001 kernel32!SetCurrentDirectoryW+0×2b
00cffb84 7730ffbb 00788450 00788b38 00cffbe0 schedsvc!CSchedWorker::RunNTJob+0×221
00cffe34 7730c03a 01ea9108 8ed032d4 00787df8 schedsvc!CSchedWorker::RunJobs+0×304
00cffe74 77310e4d 7c80a749 00000000 00000000 schedsvc!CSchedWorker::RunNextJobs+0×129
00cfff28 77310efc 7730b592 00000000 000ba4bc schedsvc!CSchedWorker::MainServiceLoop+0×6d9
00cfff2c 7730b592 00000000 000ba4bc 0009a2bc schedsvc!SchedMain+0xb
00cfff5c 7730b69f 00000001 000ba4b8 00cfffa0 schedsvc!SchedStart+0×266
00cfff6c 010011cc 00000001 000ba4b8 00000000 schedsvc!SchedServiceMain+0×33
00cfffa0 77df354b 00000001 000ba4b8 0007e898 svchost!ServiceStarter+0×9e
00cfffb4 7c80b729 000ba4b0 00000000 0007e898 ADVAPI32!ScSvcctrlThreadA+0×12
00cfffec 00000000 77df3539 000ba4b0 00000000 kernel32!BaseThreadStart+0×37

kd> du /c 90 0078894a
0078894a  “\\SERVER_B\Share_X$\Folder_Q”

The next post will discuss a pattern cooperation case study including this pattern in more detail.

- Dmitry Vostokov @ DumpAnalysis.org + TraceAnalysis.org -

!analyze -vostokov

July 16th, 2010

I knew it was my destiny! :-)

kd> !analyze -vostokov

[...]

MANUALLY_INITIATED_CRASH (e2)
The user manually initiated this crash dump.
Arguments:
Arg1: 00000000
Arg2: 00000000
Arg3: 00000000
Arg4: 00000000

Debugging Details:
------------------

[...]

- Dmitry Vostokov @ DumpAnalysis.org + TraceAnalysis.org -

Darwin: The Life of a Tormented Evolutionist

July 15th, 2010

While reading evolution books ranging from popular like Darwin’s Dangerous Idea to specialized like Evolution: The First Four Billion Years and Encyclopedia of Evolution I felt the need to read Darwin’s biography. My first encounter with Darwin was even before a primary school when I was looking at illustrations to his voyages in a library. Later, during my school years in Soviet Union, I saw a movie about him. I vividly remember a Wilberforce and FitzRoy scene. So you might imaging that I was very keen to read 680 page book (not counting notes and bibliography). Unfortunately I found it a bit boring and written in a difficult language compared to other biographies I read in English. May be the language was chosen deliberately to emulate Victorian epoch?

Almost in the middle of reading this book I stumbled across another book: The Darwin Conspiracy: Origins of a Scientific Crime and reading the latter (it’s like a thriller and you can download the free PDF from www.darwin-conspiracy.co.uk) gave me an impulse to continue reading Darwin’s biography with a critical eye. Looking at the same facts your can always interpret them differently and the conspiracy book reminded me to read behind the lines more carefully and remember about politics in science and class issues in society. I’m very interested in memetic engineering Darwin used to delicately arrange and propagate his ideas. The biography mentions Wallace in passing a few times but there is no discussion about the priority and the crucial Linnean Society meeting is not in the focus and doesn’t grab any attention.

One fact I didn’t know before reading this biography is that Darwin was always sick. Now “tormented evolutionist” phrase acquires the new meaning to me. I also got the feeling that Darwin’s hesitation to publish his ideas (if he had any to publish) was caused by sickness as well. Actually the sickness was the main focus of the book. However I really wonder how could such a sick man (as described) could write that huge amount of correspondence, do research and write many books.

One quote I found at the end of the book says that Darwin would not approve anti-religious stance of Dawkins and Co.: 

“Moreover though I am a strong advocate for free thought on all subjects, yet it appears to me (whether rightly or wrongly) that direct arguments against christianity & theism produce hardly any effect on the public; & freedom of thought is best promoted by the gradual illumination of men’s minds, which follows from the advance of science. It has, therefore, been always my object to avoid writing on religion, & I have confined myself to science. I may, however, have been unduly biassed by the pain which it would give some members of my family, if I aided in any way direct attacks on religion.”

http://www.darwinproject.ac.uk/entry-12757

The quote got my attention probably because I recently read another book: The Selfish Genius.

Darwin: The Life of a Tormented Evolutionist

Buy from Amazon

- Dmitry Vostokov @ LiterateScientist.com -

Notepad Debugging :-)

July 14th, 2010

Have you heard about the new method of visual notepad debugging? You don’t even need a debugger, just a notepad. If not, here’s a recipe:

1. Open a buggy application executable file or a DLL file you suspect in notepad.exe


2. Change the font to Webdings 

3. Search for a bang: ‘!’ (a bug in Webdings font)

4. Remove the bug and repeat the search

5. Remove that bug too

6. Find another bug and remove it too

7. You might consider “Replace All” if there are too many bugs in your application

8. Save the debugged file

9. Run it - if it crashes do a postmortem analysis - may be you overfixed your bugs. Or you might see a transmutation, in my case the 32-bit Win32 Application2Debug.exe became an MS-DOS application silently terminating after the launch: 

0:000> kL
ChildEBP RetAddr 
011ef874 76e45500 ntdll!KiFastSystemCallRet
011ef878 76e1b518 ntdll!ZwTerminateProcess+0xc
011ef888 76be41ec ntdll!RtlExitUserProcess+0x7a
011ef89c 0e75c85f kernel32!ExitProcess+0x12
011ef8a4 0e79b07f ntvdm!host_terminate+0x23
011ef8b0 0e781db6 ntvdm!terminate+0x78
011efbfc 0e78094b ntvdm!cmdGetNextCmd+0x294
011efc04 0e769d94 ntvdm!CmdDispatch+0xf
011efc10 0e771882 ntvdm!MS_bop_4+0x2f
011efc14 0e77278a ntvdm!EventVdmBop+0x29
011efc2c 0e73510b ntvdm!cpu_simulate+0x17a
011efc38 0e735086 ntvdm!host_main+0x5f
011efc74 0e7352bd ntvdm!main+0x3a
011efd54 76bed0e9 ntvdm!host_main+0x211
011efd60 76e219bb kernel32!BaseThreadInitThunk+0xe
011efda0 76e2198e ntdll!__RtlUserThreadStart+0x23
011efdb8 00000000 ntdll!_RtlUserThreadStart+0x1b

- Dmitry Vostokov @ DumpAnalysis.org + TraceAnalysis.org -

Crash Dump Analysis Patterns (Part 53b)

July 14th, 2010

This is a specialization of Blocked Thread pattern where a thread is waiting for a hardware I/O response. For example, a frozen system initialization thread is waiting for a response from one of ACPI general register ports:

kd> kL 100
ChildEBP RetAddr 
f7a010bc f74c5a57 hal!READ_PORT_UCHAR+0×7
f7a010c8 f74c5ba4 ACPI!DefReadAcpiRegister+0xa1
f7a010d8 f74b4d78 ACPI!ACPIReadGpeStatusRegister+0×10
f7a010e4 f74b6334 ACPI!ACPIGpeIsEvent+0×14
f7a01100 8054157d ACPI!ACPIInterruptServiceRoutine+0×16
f7a01100 806d687d nt!KiInterruptDispatch+0×3d
f7a01194 804f9487 hal!HalEnableSystemInterrupt+0×79
f7a011d8 8056aac4 nt!KeConnectInterrupt+0×95
f7a011fc f74c987c nt!IoConnectInterrupt+0xf2
f7a0123c f74d13f0 ACPI!OSInterruptVector+0×76
f7a01250 f74b5781 ACPI!ACPIInitialize+0×154
f7a01284 f74cf824 ACPI!ACPIInitStartACPI+0×71
f7a012b0 f74b1e12 ACPI!ACPIRootIrpStartDevice+0xc0
f7a012e0 804ee129 ACPI!ACPIDispatchIrp+0×15a
f7a012f0 8058803b nt!IopfCallDriver+0×31
f7a0131c 805880b9 nt!IopSynchronousCall+0xb7
f7a01360 804f515c nt!IopStartDevice+0×4d
f7a0137c 80587769 nt!PipProcessStartPhase1+0×4e
f7a015d4 804f5823 nt!PipProcessDevNodeTree+0×1db
f7a01618 804f5ab3 nt!PipDeviceActionWorker+0xa3
f7a01630 8068afc6 nt!PipRequestDeviceAction+0×107
f7a01694 80687e48 nt!IopInitializeBootDrivers+0×376
f7a0183c 806862dd nt!IoInitSystem+0×712
f7a01dac 805c61e0 nt!Phase1Initialization+0×9b5
f7a01ddc 80541e02 nt!PspSystemThreadStartup+0×34
00000000 00000000 nt!KiThreadStartup+0×16

kd> r
eax=00000000 ebx=00000000 ecx=00000002 edx=0000100c esi=00000000 edi=867d8008
eip=806d664b esp=f7a010c0 ebp=f7a010c8 iopl=1         nv up ei pl zr na pe nc
cs=0008  ss=0010  ds=0023  es=0023  fs=0030  gs=0000             efl=00001246
hal!READ_PORT_UCHAR+0x7:
806d664b c20400          ret     4
 

kd> ub eip
hal!KdRestore+0x9:
806d663f cc              int     3
806d6640 cc              int     3
806d6641 cc              int     3
806d6642 cc              int     3
806d6643 cc              int     3
hal!READ_PORT_UCHAR:
806d6644 33c0            xor     eax,eax
806d6646 8b542404        mov     edx,dword ptr [esp+4]
806d664a ec              in      al,dx

kd> version
[...]
System Uptime: 0 days 0:03:42.140
[...]

kd> !thread
THREAD 867c63e8  Cid 0004.0008  Teb: 00000000 Win32Thread: 00000000 RUNNING on processor 0
IRP List:
    867df008: (0006,0190) Flags: 00000000  Mdl: 00000000
Not impersonating
DeviceMap                 e1005460
Owning Process            0       Image:         <Unknown>
Attached Process          867c6660       Image:         System
Wait Start TickCount      39             Ticks: 1839 (0:00:00:18.416)
Context Switch Count      4            
UserTime                  00:00:00.000
KernelTime                00:00:00.911
Start Address nt!Phase1Initialization (0x80685928)
Stack Init f7a02000 Current f7a014a4 Base f7a02000 Limit f79ff000 Call 0
Priority 31 BasePriority 8 PriorityDecrement 0 DecrementCount 0
[...]

- Dmitry Vostokov @ DumpAnalysis.org + TraceAnalysis.org -

Icons for Memory Dump Analysis Patterns (Part 57)

July 13th, 2010

Today we introduce an icon for IRP Distribution Anomaly pattern:

B/W

Color

- Dmitry Vostokov @ DumpAnalysis.org + TraceAnalysis.org -

Models for Memory and Trace Analysis Patterns (Part 3)

July 13th, 2010

Here we model Message Hooks pattern using MessageHistory tool. It uses window message hooking mechanism to intercept window messages. Download the tool and run either MessageHistory.exe or MessageHistory64.exe and push its Start button. Whenever any process becomes active after that either mhhooks.dll or mhhooks64.dll gets injected into the process virtual address space. Then we run WinDbg x86 or WinDbg x64, run notepad.exe and attach the debugger noninvasively to it:

*** wait with pending attach
Symbol search path is: srv*
Executable search path is:
WARNING: Process 2932 is not attached as a debuggee
         The process can be examined but debug events will not be received
(b74.f44): Wake debugger - code 80000007 (first chance)
USER32!NtUserGetMessage+0xa:
00000000`76f9c92a c3              ret

0:000> .symfix

0:000> .reload

0:000> k
Child-SP          RetAddr           Call Site
00000000`0028f908 00000000`76f9c95e USER32!NtUserGetMessage+0xa
00000000`0028f910 00000000`ff511064 USER32!GetMessageW+0x34
00000000`0028f940 00000000`ff51133c notepad!WinMain+0x182
00000000`0028f9c0 00000000`76e7f56d notepad!DisplayNonGenuineDlgWorker+0x2da
00000000`0028fa80 00000000`770b3281 kernel32!BaseThreadInitThunk+0xd
00000000`0028fab0 00000000`00000000 ntdll!RtlUserThreadStart+0x1d

If we don’t select “Noninvasive” in “Attach to Process” dialog box we need to switch from the debugger injected thread to our main notepad application thread:

0:001> .symfix

0:001> .reload

0:001> k
Child-SP          RetAddr           Call Site
00000000`024bfe18 00000000`77178638 ntdll!DbgBreakPoint
00000000`024bfe20 00000000`76e7f56d ntdll!DbgUiRemoteBreakin+0x38
00000000`024bfe50 00000000`770b3281 kernel32!BaseThreadInitThunk+0xd
00000000`024bfe80 00000000`00000000 ntdll!RtlUserThreadStart+0x1d

0:001> ~0s
USER32!NtUserGetMessage+0xa:
00000000`76f9c92a c3              ret

0:000> k
Child-SP          RetAddr           Call Site
00000000`000af9e8 00000000`76f9c95e USER32!NtUserGetMessage+0xa
00000000`000af9f0 00000000`ff511064 USER32!GetMessageW+0x34
00000000`000afa20 00000000`ff51133c notepad!WinMain+0x182
00000000`000afaa0 00000000`76e7f56d notepad!DisplayNonGenuineDlgWorker+0x2da
00000000`000afb60 00000000`770b3281 kernel32!BaseThreadInitThunk+0xd
00000000`000afb90 00000000`00000000 ntdll!RtlUserThreadStart+0x1d

We then inspect the raw stack data to see any execution residue and find a few related function calls:

0:000> !teb
TEB at 000007fffffdd000
    ExceptionList:        0000000000000000
    StackBase:            0000000000290000
    StackLimit:           000000000027f000
    SubSystemTib:         0000000000000000
    FiberData:            0000000000001e00
    ArbitraryUserPointer: 0000000000000000
    Self:                 000007fffffdd000
    EnvironmentPointer:   0000000000000000
    ClientId:             0000000000000b74 . 0000000000000f44
    RpcHandle:            0000000000000000
    Tls Storage:          000007fffffdd058
    PEB Address:          000007fffffdf000
    LastErrorValue:       0
    LastStatusValue:      c0000034
    Count Owned Locks:    0
    HardErrorMode:        0

0:000> dps 000000000027f000 0000000000290000
[...]
00000000`0028e388  00000000`008bd8e0
00000000`0028e390  00000000`00000000
00000000`0028e398  00000000`00000001
00000000`0028e3a0  00000000`00000282
00000000`0028e3a8  00000000`76f966b2 USER32!SendMessageToUI+0x6a
00000000`0028e3b0  00000000`001406b0
00000000`0028e3b8  00000000`004000f8
00000000`0028e3c0  00000000`00000001
00000000`0028e3c8  00000001`800014b8 mhhooks64!CallWndProc+0×2d8
00000000`0028e3d0  00000000`00000000
00000000`0028e3d8  00000000`002f0664
00000000`0028e3e0  00000000`00000001
00000000`0028e3e8  00000000`76f96a72 USER32!ImeNotifyHandler+0xb4
00000000`0028e3f0  00000000`00000000
00000000`0028e3f8  00000000`004000f8
00000000`0028e400  00000000`00000001
00000000`0028e408  000007fe`ff1213b4 IMM32!CtfImmDispatchDefImeMessage+0×60
00000000`0028e410  00000000`00000000
00000000`0028e418  00000000`002f0664
00000000`0028e420  00000000`00000000
00000000`0028e428  00000000`002f0664
00000000`0028e430  00000000`008bd8e0
00000000`0028e438  00000000`76f96a06 USER32!ImeWndProcWorker+0×3af
00000000`0028e440  00000000`00000282
00000000`0028e448  00000000`00000000
00000000`0028e450  00000000`00000001
00000000`0028e458  00000000`004000f8
00000000`0028e460  00000000`00000000
00000000`0028e468  00000000`00000001
00000000`0028e470  00000000`00000000
00000000`0028e478  00000000`00000000
00000000`0028e480  00000000`00000000
00000000`0028e488  00000000`76f9a078 USER32!_fnDWORD+0×44
00000000`0028e490  00000000`00000000
[…]
00000000`0028f770  00000000`001406b0
00000000`0028f778  000007ff`fffdd000
00000000`0028f780  00000000`0028f8c8
00000000`0028f788  00000000`008bd8e0
00000000`0028f790  00000000`00000018
00000000`0028f798  00000000`76f885a0 USER32!DispatchHookW+0×2c
00000000`0028f7a0  000022b2`00000000
00000000`0028f7a8  00000000`00000001
00000000`0028f7b0  000007fe`ff2d2560 MSCTF!IMCLock::`vftable’
00000000`0028f7b8  00000000`00407c50
00000000`0028f7c0  00000000`000c0e51
00000000`0028f7c8  00000000`00000000
00000000`0028f7d0  00000000`00000000
00000000`0028f7d8  00000000`00000113
00000000`0028f7e0  00000000`00000113
00000000`0028f7e8  00000000`00000001
00000000`0028f7f0  00000000`00000000
00000000`0028f7f8  00000000`76f9c3df USER32!UserCallWinProcCheckWow+0×1cb
00000000`0028f800  00000000`ff510000 notepad!CFileDialogEvents_QueryInterface <PERF> (notepad+0×0)
00000000`0028f808  00000000`00000000
00000000`0028f810  00000000`00000000
00000000`0028f818  00000000`00000000
00000000`0028f820  00000000`00000000
00000000`0028f828  00000000`00000038
00000000`0028f830  00000000`00000000
00000000`0028f838  00000000`00000000
00000000`0028f840  00000000`00000000
00000000`0028f848  00000000`770cfdf5 ntdll!KiUserCallbackDispatcherContinue
00000000`0028f850  00000000`00000048
00000000`0028f858  00000000`00000001
00000000`0028f860  00000000`00000000
[…]

We also see a 3rd-party module in proximity having “hook” in its module name: mhhooks64. We disassemble its address to see yet another message hooking evidence:

0:000> .asm no_code_bytes
Assembly options: no_code_bytes

0:000> ub 00000001`800014b8
mhhooks64!CallWndProc+0×2ae:
00000001`8000148e imul    rcx,rcx,30h
00000001`80001492 lea     rdx,[mhhooks64!sendMessages (00000001`80021030)]
00000001`80001499 mov     dword ptr [rdx+rcx+28h],eax
00000001`8000149d mov     r9,qword ptr [rsp+50h]
00000001`800014a2 mov     r8,qword ptr [rsp+48h]
00000001`800014a7 mov     edx,dword ptr [rsp+40h]
00000001`800014ab mov     rcx,qword ptr [mhhooks64!hCallWndHook (00000001`80021028)]
00000001`800014b2 call    qword ptr [mhhooks64!_imp_CallNextHookEx (00000001`80017280)]

- Dmitry Vostokov @ DumpAnalysis.org + TraceAnalysis.org -

The Battle for WinDbg Ranking Continues

July 13th, 2010

After the previous announcement of WinDbg.org 3rd ranging place I see it moved to the 2nd first level ranking leaving Wikipedia behind. I think it would be impossible to go ahead of WHDC so I calm down and continue to monitor ranking from time to time only :-)

- Dmitry Vostokov @ DumpAnalysis.org + TraceAnalysis.org -

Reading Notebook: 12-July-10

July 12th, 2010

Comments in italics are mine and express my own views, thoughts and opinions

Windows Internals by M. Russinovich, D. Solomon and A. Ionescu:

File and registry virtualization is for 32-bit apps only  (p. 522)

Files (as locations) with executable extensions are excluded from virtualization (p. 524)

luafv.sys - filesystem virtualization driver (pp. 524 - 525)

\Users\<user>\AppData\Local\VirtualStore\Windows\*.* (p. 525)

Admin Approval Mode, over-the-shoulder and consent elevations (p. 529)

appinfo.dll -> consent.exe (p. 529)

Process reparenting (p. 531)

Running regedt32.exe to get virtualized registry view (p. 533)

Typical I/O request flow (pp. 540 - 541) - here is a stack trace example from x64 Windows for a remote file request that reaches network drivers (some irrelevant 3rd-party filter drivers like antivirus were skipped):

Child-SP          RetAddr           Call Site
fffffadf`25d92ff0 fffffadf`28ec5b97 NetworkCardVendor!send_packet+0x33c
fffffadf`25d93250 fffffadf`28ec5903 NDIS!ndisMProcessSGList+0x8e
fffffadf`25d932e0 fffffadf`28e85618 NDIS!ndisMAllocSGList+0x17c
fffffadf`25d933a0 fffffadf`26ab57c4 NDIS!ndisMSendX+0x21e
fffffadf`25d934d0 fffffadf`26ab5999 tcpip!ARPSendData+0x23a
fffffadf`25d93540 fffffadf`26ab20ea tcpip!ARPTransmit+0x151
fffffadf`25d935d0 fffffadf`26aaecad tcpip!IPTransmit+0xaf5
fffffadf`25d93850 fffffadf`26aa94c6 tcpip!TCPSend+0x8d5
fffffadf`25d93930 fffffadf`26aafa8c tcpip!TdiSend+0x344
fffffadf`25d939a0 fffffadf`26a4085c tcpip!TCPSendData+0xee
fffffadf`25d93a00 fffffadf`26a4845b netbt!NTSend+0x227
fffffadf`25d93ac0 fffffadf`269a546d netbt!NbtDispatchInternalCtrl+0x38
fffffadf`25d93c50 fffffadf`269cea18 rdbss!RxTdiSend+0x1a2
fffffadf`25d93cf0 fffffadf`2693efcf rdbss!RxCeSend+0x98
fffffadf`25d93d80 fffffadf`268d82fd mrxsmb!VctTranceive+0xa6
fffffadf`25d93de0 fffffadf`2693fea9 mrxsmb!SmbCeTranceive+0x483
fffffadf`25d93e70 fffffadf`2693e94b mrxsmb!SmbTransactExchangeStart+0x558
fffffadf`25d93f20 fffffadf`26940abf mrxsmb!SmbCeInitiateExchange+0x2fd
fffffadf`25d93f70 fffffadf`26940c5b mrxsmb!SmbCeSubmitTransactionRequest+0x148
fffffadf`25d93fe0 fffffadf`269412e0 mrxsmb!_SmbCeTransact+0x1a1
fffffadf`25d940c0 fffffadf`26941625 mrxsmb!MRxSmbQueryFileInformation+0x811
fffffadf`25d94220 fffffadf`26941dfa mrxsmb!MRxSmbQueryFileInformationFromPseudoOpen+0x116
fffffadf`25d94260 fffffadf`2693e94b mrxsmb!SmbPseExchangeStart_Create+0x2da
fffffadf`25d94300 fffffadf`2693f50c mrxsmb!SmbCeInitiateExchange+0x2fd
fffffadf`25d94350 fffffadf`269cc4c1 mrxsmb!MRxSmbCreate+0x5d6
fffffadf`25d94430 fffffadf`269cc730 rdbss!RxCollapseOrCreateSrvOpen+0x154
fffffadf`25d944d0 fffffadf`269c7a92 rdbss!RxCreateFromNetRoot+0x399
fffffadf`25d94570 fffffadf`269a2a77 rdbss!RxCommonCreate+0x49a
fffffadf`25d94680 fffffadf`269343e8 rdbss!RxFsdCommonDispatch+0x51c
fffffadf`25d94780 fffffadf`290bfdb3 mrxsmb!MRxSmbFsdDispatch+0x211
fffffadf`25d947d0 fffffadf`290bfdb3 fltmgr!FltpCreate+0x353
[...]
fffffadf`25d98460 fffff800`012840b4 nt!IopParseDevice+0x1088
fffffadf`25d98610 fffff800`012887d7 nt!ObpLookupObjectName+0x931
fffffadf`25d98720 fffff800`01295dad nt!ObOpenObjectByName+0x180
fffffadf`25d98910 fffff800`0129cd87 nt!IopCreateFile+0x630
fffffadf`25d98aa0 fffff800`012987f9 nt!IoCreateFile+0x12f
fffffadf`25d98b80 fffff800`0102e5fd nt!NtOpenFile+0x49
fffffadf`25d98c00 00000000`77ef0d1a nt!KiSystemServiceCopyEnd+0x3
00000000`000ac568 00000000`77d6f7c9 ntdll!NtCreateFile+0xa
00000000`000ac570 000007ff`7fd535c3 kernel32!CreateFileW+0x511