START: Software Trace Analysis in Real Time
May 21st, 2011Memory Dump Analysis Services is working on the “Start It” button:
http://www.dumpanalysis.com/introducing-project-start
![]()
- Dmitry Vostokov @ DumpAnalysis.org + TraceAnalysis.org -
Memory Dump Analysis Services is working on the “Start It” button:
http://www.dumpanalysis.com/introducing-project-start
![]()
- Dmitry Vostokov @ DumpAnalysis.org + TraceAnalysis.org -
Memory Dump Analysis Services offers 5 volumes of Memory Dump Analysis Anthology (in PDF format) with a 50% discount until the end of June:
http://www.dumpanalysis.com/ultimate-memory-analysis-reference
- Dmitry Vostokov @ DumpAnalysis.org + TraceAnalysis.org -
I came to the idea of Memory-Time when reading about Samuel Alexander’s Space-Time (see also Memory Creates God). Here Memory plays the same foundational part as Space with memory-instants paralleling point-instants. I recently found the notion of memory-time (small capitals) appearing in Wittgenstein lectures as cited in Jaakko Hintikka’s paper “Wittgenstein on being and time”. However, it is considered there from the phenomenological subject-based perspective with a role of memory in the creation of time and external world and was only present in the earlier Tractatus-based Wittgenstein’s worldview.
- Dmitry Vostokov @ DumpAnalysis.org + TraceAnalysis.org -
Presentation Software Trace and Memory Dump Analysis: Patterns, Tools, Processes and Best Practices from E2E Virtualization Conference (13th of May, 2011) is available for download:
http://www.dumpanalysis.com/STMDA-materials
- Dmitry Vostokov @ DumpAnalysis.org + TraceAnalysis.org -
In this series we start with our analysis of monsters in the realm of computer memory, software defects, malware, corrupt software structures and their various behaviour. Some of monsters are based on exaggerated crash dump and software trace patterns, some are based on the accumulated debugging and technical support wisdom. The first monster we present today is called Chimera and it lives in DLL Hell. It is based on a exaggerated pattern called Module Variety. When opening a 64-bit memory dump it shows several pages of modules (lm WinDbg command):
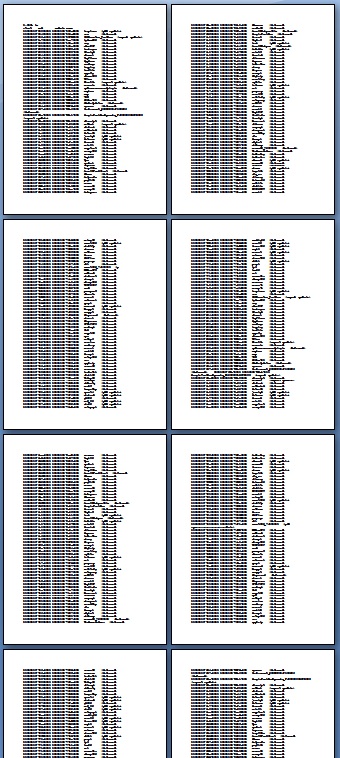
As the monster’s creator explained to me they used an experimental way to represent every class object as a loaded component. And it was a word processor where every paragraph, every sentence, every word and every letter was an object implemented in a separate module! The goal was to have any letter literally dance on a screen if necessary.
- Dmitry Vostokov @ DumpAnalysis.org + TraceAnalysis.org -
I’ve just found that the second edition of the book The IDA Pro Book: The Unofficial Guide to the World’s Most Popular Disassembler is going to be published in June. Looking forward to reading the book.
- Dmitry Vostokov @ DumpAnalysis.org + TraceAnalysis.org -
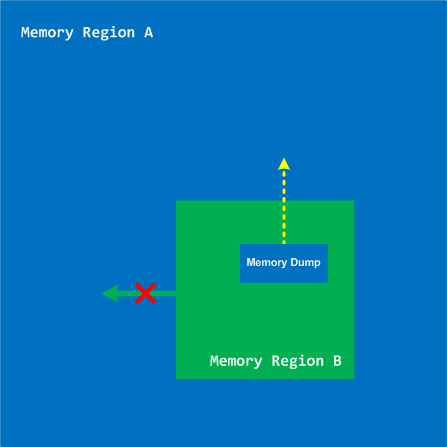
Having written on how Memoidealism explains miracles I now move into explaining the whole discipline of natural theology. I use one of the current definitions of it as “the idea that there exists some link between the world we observe and another transcendent realm” (Alister McGrath, Darwinism and The Divine). One such link is a memory dump from an inaccessible memory region.
- Dmitry Vostokov @ DumpAnalysis.org + TraceAnalysis.org -
Learn how to analyze application, service and system crashes and freezes, navigate through memory dump space and diagnose heap corruption, memory leaks, CPU spikes, blocked threads, deadlocks, wait chains, and much more. We use a unique and innovative pattern-driven analysis approach to speed up the learning curve.

Memory Dump Analysis Services organizes a training course.
If you are registered you are allowed to optionally submit your memory dumps before the training. This will allow us in addition to the carefully constructed problems tailor extra examples to the needs of the attendees. All registrants will receive an optional pre-test before the first session and an optional test after each session.
The training consists of 2 four-hour sessions (4 hours on the first day and 4 hours on the next day). When you finish the training you additionally get:
Prerequisites: Basic Windows troubleshooting
Session 1: August 1, 2011 2:00 PM - 6:00 PM BST
Session 2: August 2, 2011 2:00 PM - 6:00 PM BST
Price: 210 USD
Space is limited.
Reserve your remote training seat now.
- Dmitry Vostokov @ DumpAnalysis.org + TraceAnalysis.org -
This is a forthcoming virtual event to learn analysis of blockages, delays, obstructions, preventions, and stoppages in victimware suffering from software defects and malware. Additional information on how to join will be available soon on the main portal page:
http://www.dumpanalysis.org/stoppages2011
- Dmitry Vostokov @ DumpAnalysis.org + TraceAnalysis.org -
Most of the time software trace messages coming from the same source code fragment (PLOT) contain invariant parts such as function and variable names, descriptions, and mutable parts such as pointer values and error codes. Message Invariant is a pattern useful for comparative analysis of several trace files where we are interested in message differences. For example, in one troubleshooting scenario certain objects were not created correctly for one user. We suspected a different object version was linked to a user profile. Separate application debug traces were recorded for each user and we could see version 0×4 for the problem user and 0×5 for all other normal users:
#    Module  PID  TID  Time         Message

[...]

2782 ModuleA 2124 5648 10:58:03.356 CreateObject: pObject 0×00A83D30 data ([…]) version 0×4

[…]
#    Module  PID  TID  Time         Message

[...]

4793 ModuleA 2376 8480 09:22:01.947 CreateObject: pObject 0×00BA4E20 data ([…]) version 0×5

[…]
- Dmitry Vostokov @ DumpAnalysis.org + TraceAnalysis.org -
To model software behavior at application and system levels, test generative debugging scenarious and construct software defects using metaprogramming I started working on MdTL (Metadefect Template Library). Its consists of C++ templates for structural and behavioral patterns. The simplest examples include Threads<Spike> and Spike<Thread>. The template classes can be more complex, of course, utilizing the full power of C++, STL, and existing libraries like Boost. The unique and novel feature of this library is the inclusion of dual classes of behaviour such as Leak<>, Deadlock<>, Overflow<>, Residue<>, Exception<>, Contention<>, etc. parameterized by various structural memory classes like Process<>, Thread<>, Heap<>, Stack<>, Region<>, Buffer<>, etc. MdTL also includes classes to model software tracing and this will be used for simultaneous software trace and memory dump analysis case study in the forthcoming presentation. I also plan to extend this metaprogramming approach in the future to model malware analysis patterns by introducing Metamalware Template Library (MmTL).
Forthcoming parts will introduce template classes and examples.
- Dmitry Vostokov @ DumpAnalysis.org + TraceAnalysis.org -
The New School of Debugging places pattern-driven memory and software trace analysis as a solid foundation for any debugging methodology, processes, tools and techniques. Unified Debugging Patterns and Generative Debugging Framework are additional features of the new school. To highlight its essentials I’ve created this draft diagram:

- Dmitry Vostokov @ DumpAnalysis.org + TraceAnalysis.org -
Jobs page on Memory Dump, Software Trace, Debugging and Malware Analysis Portal now accepts company job ads related to security research, computer forensics, reverse engineering, and malware analysis in addition to debugging, software defect research, crash / core / memory dump and software trace analysis.
http://www.dumpanalysis.org/jobs
- Dmitry Vostokov @ DumpAnalysis.org + TraceAnalysis.org -
Sometimes I get cold phone calls (once it was from 012345678 number) and a guy asks me if I have a computer. I was always telling him that I’m a security professional and after that hanging up the phone. This morning I tried a different approach (SE - Social Engineer):
SE. We are Windows consulting services. Do you have a home computer?
Me. I’m sorry, we don’t have a computer.
SE. We can sell you the one. Are you interested?
Me. No, we are not. This is a temporary accommodation and we don’t need a computer.
SE. Sorry for bothering you.^x
- Dmitry Vostokov @ DumpAnalysis.org + TraceAnalysis.org -
This pattern is a kernel mode counterpart to Self-Diagnosis in user mode. It is just a collection of bugcheck codes where a problem is usually detected before corruption causes a fault, exception or trap. Typical example would be a detection of a failed assertion or corrupt structures such as:
BAD_POOL_HEADER (19)

The pool is already corrupt at the time of the current request.

This may or may not be due to the caller.

The internal pool links must be walked to figure out a possible cause of the problem, and then special pool applied to the suspect tags or the driver verifier to a suspect driver.

Arguments:

Arg1: 00000020, a pool block header size is corrupt.

Arg2: 8b79d078, The pool entry we were looking for within the page.

Arg3: 8b79d158, The next pool entry.

Arg4: 8a1c0004, (reserved)
More examples would be added in the forthcoming case studies.
- Dmitry Vostokov @ DumpAnalysis.org + TraceAnalysis.org -
It’s time to select a secondary level school for my kids in advance. I wasn’t aware that such books exist and I was delighted when I saw the book in a local library. Unfortunately, my expectations weren’t met: 2/3rds of the book is just the list of schools and the text is too academic and politically correct for any good use except to reinforce common sense although I didn’t expect to hear saucy stories. Just two insights I found useful: some parents don’t enroll their children in the nearest school because they perceive themselves as not very responsible if they do that and don’t blindly trust school ranks in academic examination results as they might be influenced by school size. So my conclusion is that this book might be of some help to reevaluate your commitments if you rely too much on certain knowledge acquisition mechanisms such as “grapevine”, never thought about participating in PTA (Parent Teacher Association) or want to hear what Principles carefully say from their side. Some bibliography might be useful if you want to continue this research further on. However, the authors warn that no so much of it exists for Ireland.
Choosing a School: Second Level Education in Ireland
- Dmitry Vostokov @ LiterateScientist.com -
Here we continue with Technology-Specific Subtrace pattern series started earlier with COM interface invocation example. In this part we consider dynamic memory allocation example in kernel space (kernel pool). Usually pool corruption is detected during pool memory allocation or release with a special bugcheck code, for example:
BAD_POOL_HEADER (19)

The pool is already corrupt at the time of the current request.

This may or may not be due to the caller.

The internal pool links must be walked to figure out a possible cause of the problem, and then special pool applied to the suspect tags or the driver verifier to a suspect driver.

Arguments:

Arg1: 00000020, a pool block header size is corrupt.

Arg2: 8b79d078, The pool entry we were looking for within the page.

Arg3: 8b79d158, The next pool entry.

Arg4: 8a1c0004, (reserved)
However, pool corruption might be deeper enough to trigger an access violation even before self-diagnosis. In such cases stack subtraces with functions like ExFreePoolWithTag might point to troubleshooting and debugging directions:
ATTEMPTED_WRITE_TO_READONLY_MEMORY (be)

An attempt was made to write to readonly memory. The guilty driver is on the stack trace (and is typically the current instruction pointer).

When possible, the guilty driver’s name (Unicode string) is printed on the bugcheck screen and saved in KiBugCheckDriver.

Arguments:

Arg1: 00470044, Virtual address for the attempted write.

Arg2: 06d39025, PTE contents.

Arg3: aec0fb30, (reserved)

Arg4: 0000000a, (reserved)
TRAP_FRAME:  aec0fb30 -- (.trap 0xffffffffaec0fb30)

ErrCode = 00000003

eax=8ac12d38 ebx=8b700040 ecx=000001ff edx=00470040 esi=8ac12db8 edi=808b0b40

eip=808949e7 esp=aec0fba4 ebp=aec0fbf0 iopl=0 nv up ei pl nz na po nc

cs=0008  ss=0010  ds=0023  es=0023  fs=0030  gs=0000  efl=00010202

nt!ExFreePoolWithTag+0x6a3:

808949e7 895a04          mov     dword ptr [edx+4],ebx ds:0023:00470044=????????
STACK_TEXT:

aec0faa0 80860121 000000be 00470044 06d39025 nt!KeBugCheckEx+0x1b

aec0fb18 8088e490 00000001 00470044 00000000 nt!MmAccessFault+0xb25

aec0fb18 808949e7 00000001 00470044 00000000 nt!KiTrap0E+0xdc

aec0fbf0 808d93b5 8ac12dc0 00000000 00000000 nt!ExFreePoolWithTag+0×6a3

aec0fc08 808cd304 e5ae5770 8ac12dc0 8aa77db0 nt!CmpFreePostBlock+0×4d

aec0fc3c 8082ea53 8ac12dc0 aec0fc88 aec0fc7c nt!CmpPostApc+0xde

aec0fc8c 80833eec 00000000 00000000 00000000 nt!KiDeliverApc+0xf9

aec0fcc4 808290bd aec0fd64 8099781c 0160fd44 nt!KiSwapThread+0×300

aec0fd0c 809978a0 00000001 00000000 f77275e0 nt!KeDelayExecutionThread+0×2ab

aec0fd54 8088b45c 00000000 0160fd74 0160fd9c nt!NtDelayExecution+0×84

aec0fd54 7c82847c 00000000 0160fd74 0160fd9c nt!KiFastCallEntry+0xfc

WARNING: Frame IP not in any known module. Following frames may be wrong.

0160fd9c 00000000 00000000 00000000 00000000 0×7c82847c
1: kd> !pool 8ac12dc0

Pool page 8ac12dc0 region is Nonpaged pool

 8ac12000 size:  858 previous size:    0  (Allocated)  TWPG

 8ac12858 size:    8 previous size:  858  (Free)       ….

 8ac12860 size:   20 previous size:    8  (Allocated)  VadS

 8ac12880 size:    8 previous size:   20  (Free)       NtFs

 8ac12888 size:   20 previous size:    8  (Allocated)  VadS

 8ac128a8 size:   28 previous size:   20  (Allocated)  Ntfn

 8ac128d0 size:   30 previous size:   28  (Allocated)  Vad

 8ac12900 size:   40 previous size:   30  (Allocated)  Muta (Protected)

 8ac12940 size:   38 previous size:   40  (Allocated)  Sema (Protected)

 8ac12978 size:   40 previous size:   38  (Allocated)  Muta (Protected)

 8ac129b8 size:  270 previous size:   40  (Allocated)  Thre (Protected)

 8ac12c28 size:   40 previous size:  270  (Allocated)  Ntfr

 8ac12c68 size:   d0 previous size:   40  (Allocated)  DRIV

8ac12d38 is not a valid large pool allocation, checking large session pool…

8ac12d38 is freed (or corrupt) pool

Bad previous allocation size @8ac12d38, last size was 1a
***

*** An error (or corruption) in the pool was detected;

*** Attempting to diagnose the problem.

***

*** Use !poolval 8ac12000 for more details.

***
Pool page [ 8ac12000 ] is __inVALID.
Analyzing linked list...

[ 8ac12c68 --> 8ac12db8 (size = 0x150 bytes)]: Corrupt region

Scanning for single bit errors...
None found
- Dmitry Vostokov @ DumpAnalysis.org + TraceAnalysis.org -
Module Hint pattern is frequently observed in dynamic memory corruption incidents. It is similar to Execution Residue or String Parameter patterns were we have ASCII or UNICODE fragments providing troubleshooting and debugging hints. Module Hint is therefore a more specialized pattern where we can link module names to raw data. For example, a kernel memory dump saved after the detected pool corruption shows P12345.DLL module name in a pool entry that can provide a link to the corresponding functionally to be reconfigured or removed:
BAD_POOL_HEADER (19)

The pool is already corrupt at the time of the current request.

This may or may not be due to the caller.

The internal pool links must be walked to figure out a possible cause of the problem, and then special pool applied to the suspect tags or the driver verifier to a suspect driver.

Arguments:

Arg1: 00000020, a pool block header size is corrupt.

Arg2: 8b79d078, The pool entry we were looking for within the page.

Arg3: 8b79d158, The next pool entry.

Arg4: 8a1c0004, (reserved)
STACK_TEXT:

b3e0aa4c 808947bb 00000019 00000020 8b79d078 nt!KeBugCheckEx+0x1b

b3e0aab4 b368c00f 8b79d080 00000000 00000000 nt!ExFreePoolWithTag+0×477

b3e0aac4 b366c68e 8b79d080 00000000 00000000 DriverA!MemFree+0xf

[…]

b3e0ac44 8081e0c3 808f77c9 b3e0ac64 808f77c9 nt!IovCallDriver+0×112

b3e0ac50 808f77c9 8a8eef60 8b6862a8 8a8eeef0 nt!IofCallDriver+0×13

b3e0ac64 808f856b 8ce456b0 8a8eeef0 8b6862a8 nt!IopSynchronousServiceTail+0×10b

b3e0ad00 808f109a 000009dc 00000000 00000000 nt!IopXxxControlFile+0×5e5

b3e0ad34 8088b45c 000009dc 00000000 00000000 nt!NtDeviceIoControlFile+0×2a

b3e0ad34 7c82847c 000009dc 00000000 00000000 nt!KiFastCallEntry+0xfc

WARNING: Frame IP not in any known module. Following frames may be wrong.

00f5fb18 00000000 00000000 00000000 00000000 0×7c82847c
2: kd> !pool 8b79d080

Pool page 8b79d080 region is Unknown

 8b79d000 size:   30 previous size:    0  (Allocated)  FSfm

 8b79d030 size:   28 previous size:   30  (Allocated)  VadS

 8b79d058 size:   20 previous size:   28  (Allocated)  ReEv

*8b79d078 size:   e0 previous size:   20  (Allocated) *DRIV

  Owning component : Unknown (update pooltag.txt)

8b79d158 is not a valid large pool allocation, checking large session pool…

8b79d158 is freed (or corrupt) pool

Bad previous allocation size @8b79d158, last size was 1c
***

*** An error (or corruption) in the pool was detected;

*** Pool Region unknown (0xFFFFFFFF8B79D158)

***

*** Use !poolval 8b79d000 for more details.

***
2: kd> dc 8b79d078

8b79d078  [...] ..DRIV  ......AP

8b79d088  [...] P12345.DLL……

8b79d098  […] …..<%n……..

8b79d0a8  […] ….$…:.F…X.

[…]
- Dmitry Vostokov @ DumpAnalysis.org + TraceAnalysis.org -
Very simple methodology summarized in just 3 words applicable to any problem solving domain and its activities including software troubleshooting and debugging:
Artifacts. Checklists. Patterns.
As an example of checklists and patterns please see these 3 presentations related to memory dump and software trace artifacts:
Introduction to Pattern-Driven Software Problem Solving
Fundamentals of Complete Crash and Hang Memory Dump Analysis
Pattern-Driven Memory Dump Analysis
I’m now working on a detailed presentation of this methodology.
- Dmitry Vostokov @ DumpAnalysis.org + TraceAnalysis.org -
A page to reference all different kinds of .NET related patterns is necessary, so I created this post:
I’ll update it as soon as I add more similar patterns.
- Dmitry Vostokov @ DumpAnalysis.org + TraceAnalysis.org -