October 18th, 2006
After listening to “An Anthology of Noise and Electronic Music”


and remembering that long time ago I was asked to convert stock charts into sound waves an idea came to me to convert memory dump files into WAV files by appending an appropriate header in front of them. So depending on imposed sampling frequency (Hz), quantization level (bits) and mono/stereo settings you can enjoy listening to dumps. Long time ago I wrote a component for hard-disk recording while working on my voice recognition projects and I’m going to reuse it now.
Forthcoming DumpPlayer will be released this weekend for free download so stay tuned.
If it goes well I promise to write a WinDbg extension to listen to a given memory range.
- Dmitry Vostokov -
Posted in Crash Dump Analysis, Memory Auralization, Tools | 4 Comments »
October 17th, 2006
I’ve been thinking about this since my previous DDV post and came up with the following example of general DDV architecture:
So we need:
- A “Debugger” to debug “Virtualization layer”
- A “Debugger plugin” to help the “Debugger” to understand the “Subject of virtualization”
- Not to mention various virtualized “debuggers” debugging their virtualized subjects
- Dmitry Vostokov -
Posted in Crash Dump Analysis, Software Architecture, Virtualization | No Comments »
October 16th, 2006
Everyone now speaks about virtualization and its benefit. New horizons. I would like to add my 2 cents from dump analysis and debugging perspective. There will be more complex debugging environment as my recent experience with WOW64 tells me:
So if we generalize this to virtualization environment we would come up with the following picture:
- Dmitry Vostokov -
Posted in Crash Dump Analysis, Virtualization | No Comments »
October 15th, 2006
New addition to “History” toolbox: ProcessHistory. It has similar GUI interface as WindowHistory and MessageHistory:
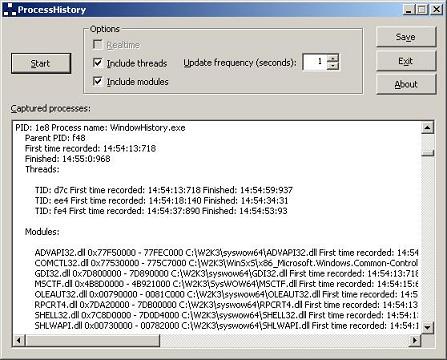
ProcessHistory tracks process creation and exit, thread creation and termination and also modules (DLL, OCX, etc.) and their loading and unloading.
The tool has 2 executables: ProcessHistory.exe for 32-bit platforms and ProcessHistory64.exe for 64-bit platforms. In fact, you need both for your 64-bit platform if you want to track modules: if your application is 32-bit ProcessHistory.exe will correctly show loaded and unloaded 32-bit modules whereas ProcessHistory64.exe will only show WOW64 components.
I’m already working on the next version 2.x which can record changes in real-time and I’m also porting the current version to Windows CE and Windows Mobile.
- Dmitry Vostokov -
Posted in Tools | No Comments »
October 14th, 2006
If you have any troubleshooting or debugging tool idea you can post a comment here, write to me (if you know my Citrix e-mail) or simply drop a message to my personal address.
Full credit and thank you note will be given in About dialog box if I implement the idea. I already developed a nice component for that purpose. Demo will be posted soon.
I write most of my tools using C++/STL/MFC/Win32 API and occasionally plain C (for device drivers). Most of them are released in both 32-bit and 64-bit versions and occasionally ported to Windows Mobile. Written tools don’t carry .NET baggage with them although I plan to utilize managed C++ in future MFC-based tools if certain .NET functionality is required.
Thank you!
- Dmitry Vostokov -
Posted in Tools | 1 Comment »
October 14th, 2006
Part 2 follows the discussion of various dump types depicted here: Dumps for Dummies (Part 1)
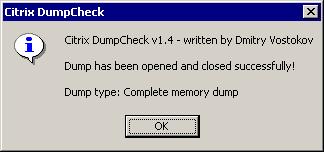
So the question arises: how to make sure the customer got the right dump? And if the dump type is not what you asked for provide a recommendation for further actions. Troubled with such questions during my first years in Citrix technical support I decided to develop a lightweight Explorer extension and a command line version of dump checking tool called Citrix DumpCheck:
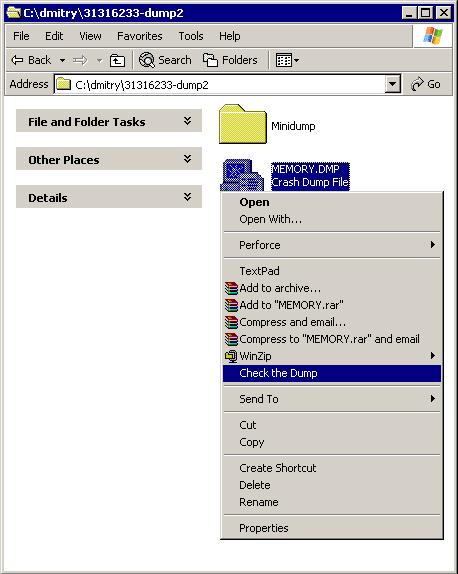
Here it does basic checks for dump validity and shows the dump type: Complete memory dump
If it found small mini dump type (64Kb) the tool would have suggested to change settings in Control Panel.
The extension can be downloaded from Citrix support web site:
Citrix DumpCheck Explorer Extension version 1.4
FAQ:
Q. Is it possible to show more information like process name in a user dump or whether full page heap was enabled?
A. Certainly it is possible to include. However it requires access to OS symbol files during runtime and most customers don’t have them installed or downloaded from MS symbol server. So the design decision was not to include these checks in version 1.x. I consider to include this in next versions 2.x.
Q. The customer doesn’t want to modify environment by installing extension. Is there any command line version of this tool?
A. Yes, there is. The following article contains a download link to a command line version of Citrix DumpCheck:
Citrix DumpCheck Utility (Command Line) version 1.4
Q. Does this extension work in 64-bit Windows?
A. No, but you can use command line equivalent shown in the answer to the previous question. Also I’m planning to port this extension to 64-bit soon and will announce as soon as I release it.
- Dmitry Vostokov @ DumpAnalysis.org -
Posted in Crash Dump Analysis, Crash Dumps for Dummies, Tools | No Comments »
October 12th, 2006
Recently I discovered wonderful WinDbg commands dpu (UNICODE strings) and dpa (ASCII strings). Look at WinDbg help for other d** equivalents like dpp.
I needed to examine raw stack data and check if any pointers on stack were pointing to strings. For example:
0:143> !teb

TEB at 7ff2b000

...

    StackBase:            05e90000

    StackLimit:           05e89000

...

...

...

0:143> dpu 05e89000 05e90000

05e8f58c  00120010 ""

...

...

...

05e8f590  77e7723c "Debugger"

05e8f594  00000000

05e8f598  08dc0154

05e8f59c  01000040

05e8f5a0  05e8f5dc "G:\WINDOWS\system32\faultrep.dll"

05e8f5a4  0633adf0 ""

05e8f5a8  00000000

05e8f5ac  00000001

05e8f5b0  00000012

05e8f5b4  7c8723e0

05e8f5b8  ffffffff

05e8f5bc  00000004

05e8f5c0  69500000

05e8f5c4  00000000

05e8f5c8  00000aac

05e8f5cc  00000002

05e8f5d0  05e8f740

05e8f5d4  0633adfc "drwtsn32 -p %ld -e %ld -g"

05e8f5d8  00000000

...

...

...
Of course, you can apply these commands to any memory range, not only stack.
- Dmitry Vostokov -
Posted in Crash Dump Analysis, WinDbg Tips and Tricks | 1 Comment »
October 10th, 2006
Q: What proportion of Citrix customers uses 64-bit server environment?
Hint: search Citrix support web site but don’t run complex search queries - think Citrix tools
A: If we look at download counts for two Citrix tools ADSCleaner and WindowHistory which were published separately for 32-bit and 64-bit platforms but at the same time (links might require free registration):
http://support.citrix.com/kb/category.jspa?categoryID=682
ADSCleaner 2.0 - 299 downloads
ADSCleaner64 2.0 (for x64 platforms) - 33 downloads
WindowHistory 2.1 - 140 downloads
WindowHistory64 2.1 (for x64 platforms) - 31 downloads
So we have approximately 10 - 20% of Citrix customers using 64-bit environments. 20% is the upper limit. What about lower limit? Let’s look at another published tool:
Repair CBD Chain - 4282 downloads
RepairCBDChain64 - 60 downloads
Therefore the lower limit is less than 2%.
Conclusion: 2 - 20% of Citrix customers use 64-bit environments 
- Dmitry Vostokov -
Posted in Citrix, Tools | No Comments »
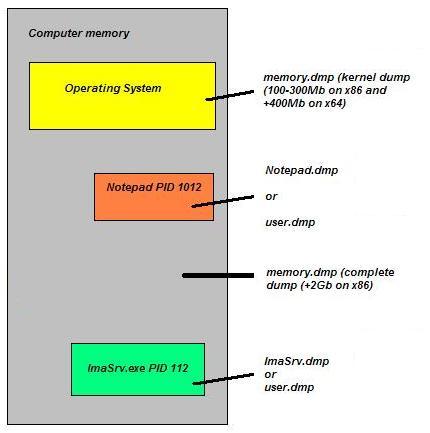
October 9th, 2006
There is much confusion among MS and therefore Citrix customers about different dump types - Windows has 3 major dump types (not including various mini-dumps): complete, kernel and user. Long time ago I created a hand-crafted picture showing how various parts of computer memory are saved in a dump and I want to share it with a wider part of Citrix community and perhaps with the rest of the world:
- Dmitry Vostokov @ DumpAnalysis.org -
Posted in Crash Dump Analysis, Crash Dumps for Dummies | 3 Comments »
October 8th, 2006
I got the impression after reading numerous books and articles about device drivers that UML is almost never used in describing kernel and device driver design and architecture. Everything is described either by words or using proprietary notations. If you don’t know about UML (Unified Modeling Language) it is time to learn because it is an industry standard general purpose modeling language with graphical notation. You can find many good tutorials on the Web and I can recommend the book to start:
UML Distilled: A Brief Guide to the Standard Object Modeling Language, Third Edition


Recently I created some diagrams based on my past experience in using UML to describe and communicate architecture and design:
0. Component diagram depicting major driver interfaces

1. Class and object diagram depicting relationship between drivers and devices

2. Component diagram showing dependencies and interfaces when calling Win32 API function ReadFile

3. Component diagram showing IRP flow in a driver stack (driver-to-driver communication)

Actually I found that some driver books incorrectly depict the ordering of I/O stack locations in IRP stack corresponding to driver or device stack. The correct layout is depicted above. IRP I/O stack locations grow down (to lower addresses) in memory like any other Wintel stack. You can see it from kernel dumps or the following macro from DDK header file wdm.h which shows that next IRP I/O stack location is down in memory (1 is subtracted from current stack location pointer):
#define IoGetNextIrpStackLocation( Irp ) (\

    (Irp)->Tail.Overlay.CurrentStackLocation - 1 )
Dumps (and live debugging) are good in studying component relationships, reconstructing sequence diagrams, etc. For example, this edited fragment below is from crash dump and it shows who calls whom and component dependencies be reconstructed from call stack of Win32 API function GetDriveType: SHELL32 (calls it) -> kernel32 -> ntdll -> nt (ntoskrnl.exe). You can also see various Citrix hooks and filters here (CtxSbxXXX):
kd> kL

CtxSbx!xxx

nt!IovCallDriver

nt!IofCallDriver

CtxAltStr!xxx

nt!IovCallDriver

nt!IofCallDriver

nt!IopParseDevice

nt!ObpLookupObjectName

nt!ObOpenObjectByName

nt!IopCreateFile

nt!IoCreateFile

nt!NtOpenFile

nt!KiSystemService

SharedUserData!SystemCallStub

ntdll!ZwOpenFile

CtxSbxHook!xxx

kernel32!GetDriveTypeW

SHELL32!CMountPoint::_EnumMountPoints
- Dmitry Vostokov -
Posted in Books, Crash Dump Analysis, Kernel Development, Software Architecture | 2 Comments »
October 5th, 2006
I believe studying Linux kernel and playing with it will broaden your conceptual understanding of kernel development and issues and you can apply it to Wintel stuff too. I’m not a complete Windows guy as you might think after reading my previous posts. I spent 1.5 years (before joining Citrix) under RedHat Linux writing C++ software quality tools in C++ using Emacs editor (working for Programming Research Ltd www.programmingresearch.com). And I did multi platform (Windows - Linux - Solaris) architecture, design and programming for Boeing Commercial Airplanes Group 6 years ago (when working for the biggest Russian outsourcing company Luxoft www.luxoft.com). Coupled with all this prior knowledge about Linux I’m on my journey to study the latest Linux kernel (2.6) and I would recommend 2 wonderful books I’m reading now:
Linux Kernel Development, 2nd Edition


Understanding Linux Kernel, 3rd Edition


and another fantastic book about Unix internals in general:
UNIX Internals


- Dmitry Vostokov -
Posted in Books, Kernel Development, Software Architecture | No Comments »
October 3rd, 2006
Noticed as one engineer was frequently switching between WinDbg and Calc. Forget about using calc.exe during debugging or dump analysis sessions. Save your valuable time. Don’t multiprocess. Use ? and .formats commands:
0:000> ? 2 + 2

Evaluate expression: 4 = 00000004

0:000> .formats 4

Evaluate expression:

  Hex:     00000004

  Decimal: 4

  Octal:   00000000004

  Binary:  00000000 00000000 00000000 00000100

  Chars:   ....

  Time:    Thu Jan 01 00:00:04 1970

  Float:   low 5.60519e-045 high 0

  Double:  1.97626e-323
Now you can do your finance calculations in WinDbg too.
The WinDbg Way!
- Dmitry Vostokov -
Posted in Crash Dump Analysis, Tools | No Comments »
October 3rd, 2006
If this scenario happens after some event or user action most likely some notification hooks were involved. WinDbg !thread command on the current processor will most likely catch running thread than IdleLoop thread and !process command will show the current process context. Then from thread stack you can make an educated guess which components were likely responsible for that.
To change the current processor when looking at the dump from multiprocessor platform use ~”p”s command where “p” is zero-based processor number, for example, ~1s changes the current processor to the second processor. Remember that every processor has its own thread and process context. If processor has nothing to do it is looping in KiIdleLoop thread which belongs to Idle process.
- Dmitry Vostokov -
Posted in Crash Dump Analysis | 2 Comments »
September 27th, 2006
HTML version of selected lecture materials from my forthcoming book is available on my personal web site:
http://www.dumpanalysis.org/blog/index.php/foundations-of-debugging-x86/
Topics available online include:
- Memory, registers and simple arithmetic
- Number representations and pointers
- Bytes, words, double words and pointers to memory
- Instruction pointer and disassembling a program with pointers
- Memory and stacks
- Frame pointer and local variables
- Function parameters
- Function pointer parameters
- Virtual memory, processes and threads
- Arrays and structures in memory
In addition to x86 (32-bit) the book covers assembler, C/C++ and crash dump analysis on the following platforms:
- x64 Windows
- Windows Mobile (ARM processors)
It will include an educational version of x86/x64/ARM4 assembler and interpreter written using modern C++ and STL (including UML diagrams of all classes and components) and much more! Although all this bonus stuff is still under development it is actually working, compiling, loading and executing/interpreting small assembly language programs.
I’m also planning to publish an Internet version of this assembly language interpreter to run small educational assembly language programs anytime, anywhere. The latter Citrix-like goal is actually the part of my Masters degree project.
- Dmitry Vostokov -
Posted in Crash Dump Analysis | No Comments »
September 15th, 2006
During development of one of my projects for Windows Mobile I needed full information about windows on my pocket PC devices. I needed that information gathered in real-time and when I was not connected to my host PC so I couldn’t use remote SPY++ from MS Windows CE tools. The decision was to port existing Citrix WindowHistory tool to Windows CE. It worked well and I tested it on Windows Pocket PC 2003 emulator and on real devices running Windows Mobile 5.0 (Acer n300 and mobile phone Mio A701 both have ARM processors). It should work on any other mobile device powered by ARM/XScale processor.
- Dmitry Vostokov -
Posted in Tools, Windows Mobile | No Comments »
September 13th, 2006
Don’t expect me to talk about Netscaler stuff. I’m a Windows guy. It’s started in 1989 when I got PS/2 with 2Mb of memory on board and Windows 2.x as a GUI appliance to an IBM thermal printer. And then suddenly Windows 3.0 appeared and I didn’t have a clue about programming on it (I was an MS DOS guy). Thanks to BBS (some of you probably have never heard about it - it was mini Internet at that time) I got a text file - that wonderful book “Programming Windows” 1st edition written by Charles Petzold and read it twice and being facinated by Windows GUI independence from hardware went straight programming Norton Commander variant. Enough nostalgia. Let’s come back to Citrix and hardware.
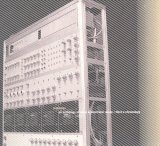
I’m a big fan of OSR. Read their articles and bought some hardware from them to learn about USB driver programming, like this one:
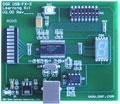
This is a real USB device! You connect it via cable to your USB port and you have a button, switches and indicators. Inspired by this device I’m writing a driver which will monitor the health of a Citrix server by lighting appropiate indicators when your IMA service is gone, showing the number of sessions active, etc. And there is a button which could force a server to show a blue screen (in another words force a system dump to do an analysis later - that’s my job in Citrix) if things go beyond control of a Citrix administrator. Something like a magic to me. Stay tuned.
- Dmitry Vostokov -
Posted in Citrix, Hardware | No Comments »
September 13th, 2006
Finally Citrix has got its own troubleshooting tool for capturing window messages. It is similar to what SPY++ does but more easy to use especially in a customer environment. Existing tools are useful for developers focusing on specific product where they know its internals or in the process of debugging. Customers and technical support need something different. From my experience, existing tools require too much effort for a customer who sees and tries to use them for the first time. On the other hand technical support needs good traces where nothing has been left out. So I sat down at my 64-bit workstation and spent weekend to develop this lightweight tool to let customers do minimum and record everything and thus avoid usual turnaround in technical support cases requiring capturing messages and at the same time simplify trace analysis (at least for myself).
While developing this tool I discovered its major feature: ability to capture all messages from 64-bit applications (in addition to messages from 32-bit applications). All existing tools I could find capture messages from 32-bit application only.
You can download MessageHistory for free from Citrix support web site (requires free registration):
MessageHistory
Check out also Citrix WindowHistory for 32-bit and WindowHistory for 64-bit platforms.
Currently I’m developing a presentation/class: “Understanding windows and messages: peering inside Citrix troubleshooting tools and their log files (WindowHistory and MessageHistory)”
Further plans are to develop more tools to track the history of various system events (in addition to windows and messages) and finally develop a toolbar to integrate all of them.
- Dmitry Vostokov -
Posted in Tools | No Comments »
September 12th, 2006
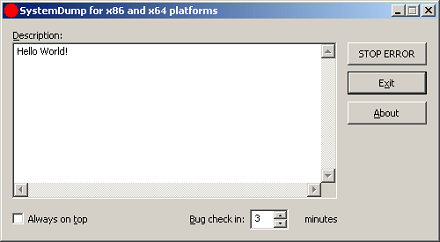
Not really new as it was previously called CtxBSOD v2.1 but was renamed to better show its purpose. In addition to renaming I added a command line option to dump a system remotely or from a command line locally without using its GUI interface. The main motivation for me to write this tool was the absence of similar tools for 64-bit Windows. SystemDump can dump a 64-bit server too!
You can download it form Citrix support web site (requires free registration):
http://support.citrix.com/article/CTX111072
Main features:
- The tool has both GUI and command line interfaces.
- You can type a message/text (or copy it from clipboard) before forcing a memory dump. This message is saved in a dump and a support engineer can read it after loading the dump in WinDbg.exe. This is implemented to encourage writing the symptoms and conditions explaining why the dump has to be forced.
- The tool can stay on top of any window (if you need this to quickly dump the server after a reproduction or during the process of an activity).
- It is supplied with Program Database (PDB) symbols for the driver (32-bit and 64-bit) which is useful when you want to have all symbols present on the bugcheck thread.
- The bugcheck clearly shows that the dump is manually generated.
- The tool can force a memory dump on both 32-bit and 64-bit platforms.
- Before forcing a fatal error on a server, the tool warns about potential damaging consequences: Users are disconnected and all the data which is not saved will be lost. It asks for a confirmation.
- You can specify a period of time (in minutes) when to force a memory dump.
The latter feature is implemented entirely in kernel. Additional command that not covered in the article is
>SystemDump.exe abort
allows you to abort the action if you ran the tool using command line options.
I attached the UML component diagram showing the architecture of this tool. I recently developed a presentation about device drivers architecture and Citrix kernel drivers where I used this tool as one of examples.

- Dmitry Vostokov -
Posted in Crash Dump Analysis, Software Architecture, Tools | 2 Comments »
September 10th, 2006
Still playing with WinDbg scripting and applying them to dump analysis. The following script will uncover deadlocks and critical section contention in user mode processes (including services) if you run it against complete memory dump:
$$

$$ List owned critical sections in user processes

$$

r $t0 = nt!PsActiveProcessHead

.for (r $t1 = poi(@$t0); (@$t1 != 0) & (@$t1 != @$t0); r $t1 = poi(@$t1))

{

    r? $t2 = #CONTAINING_RECORD(@$t1, nt!_EPROCESS, ActiveProcessLinks);

    .process @$t2

    .reload

    !ntsdexts.locks

}
To run it save in a file and use the following command in WinDbg: $$><script.txt
- Dmitry Vostokov -
Posted in Crash Dump Analysis, Tools | 1 Comment »