Archive for the ‘Software Trace Visualization’ Category
Sunday, April 17th, 2011
I’m pleased to announce that MDAA, Volume 5 is available in PDF format:
www.dumpanalysis.org/Memory+Dump+Analysis+Anthology+Volume+5
It features:
- 25 new crash dump analysis patterns
- 11 new pattern interaction case studies (including software tracing)
- 16 new trace analysis patterns
- 7 structural memory patterns
- 4 modeling case studies for memory dump analysis patterns
- Discussion of 3 common analysis mistakes
- Malware analysis case study
- Computer independent architecture of crash analysis report service
- Expanded coverage of software narratology
- Metaphysical and theological implications of memory dump worldview
- More pictures of memory space and physicalist art
- Classification of memory visualization tools
- Memory visualization case studies
- Close reading of the stories of Sherlock Holmes: Dr. Watson’s observational patterns
- Fully cross-referenced with Volume 1, Volume 2, Volume 3, and Volume 4
Its table of contents is available here:
www.dumpanalysis.org/MDAA/MDA-Anthology-V5-TOC.pdf
Paperback and hardcover versions should be available in a week or two. I also started working on Volume 6 that should be available in November-December.
- Dmitry Vostokov @ DumpAnalysis.org + TraceAnalysis.org -
Posted in Aesthetics of Memory Dumps, Analysis Notation, Announcements, AntiPatterns, Archaeology of Computer Memory, Art, Assembly Language, Best Practices, Books, C and C++, CDF Analysis Tips and Tricks, Categorical Debugging, Citrix, Common Mistakes, Common Questions, Complete Memory Dump Analysis, Computer Forensics, Computer Science, Crash Analysis Report Environment (CARE), Crash Dump Analysis, Crash Dump De-analysis, Crash Dump Patterns, Crash Dumps for Dummies, Cyber Warfare, Debugging, Debugging Bureau, Debugging Industry, Debugging Methodology, Debugging Slang, Debugging Trends, Deep Down C++, Dr. Watson, Dublin School of Security, Education and Research, Escalation Engineering, Fun with Crash Dumps, Fun with Debugging, Fun with Software Traces, General Memory Analysis, Hermeneutics of Memory Dumps and Traces, Images of Computer Memory, Kernel Development, Malware Analysis, Mathematics of Debugging, Memiotics (Memory Semiotics), Memory Analysis Forensics and Intelligence, Memory Diagrams, Memory Dump Analysis Services, Memory Dumps in Myths, Memory Space Art, Memory Systems Language, Memory Visualization, Memory and Glitches, Metaphysics of Memory Worldview, Multithreading, Music for Debugging, New Acronyms, New Debugging School, New Words, Pattern Models, Philosophy, Physicalist Art, Publishing, Reverse Engineering, Science of Memory Dump Analysis, Science of Software Tracing, Security, Software Architecture, Software Behavior Patterns, Software Chorography, Software Chorology, Software Defect Construction, Software Engineering, Software Generalist, Software Maintenance Institute, Software Narratology, Software Technical Support, Software Trace Analysis, Software Trace Reading, Software Trace Visualization, Software Tracing for Dummies, Software Troubleshooting Patterns, Software Victimology, Structural Memory Patterns, Structural Trace Patterns, Systems Thinking, Testing, The Way of Philip Marlowe, Tools, Trace Analysis Patterns, Training and Seminars, Troubleshooting Methodology, Victimware, Vista, Webinars, WinDbg Scripting Extensions, WinDbg Scripts, WinDbg Tips and Tricks, WinDbg for GDB Users, Windows 7, Windows Server 2008, Windows System Administration, Workaround Patterns, x64 Windows | No Comments »
Saturday, January 1st, 2011
With the new year starts the new initiative to integrate traditional multidisciplinary debugging approaches and methodologies with multiplatform pattern-driven software problem solving, unified debugging patterns, best practices in memory dump analysis and software tracing, computer security, economics, and the new emerging trends I’m going to write about during this year.
- Dmitry Vostokov @ DumpAnalysis.org + TraceAnalysis.org -
Posted in Announcements, Best Practices, Computer Forensics, Computer Science, Countefactual Debugging, Crash Analysis Report Environment (CARE), Crash Dump Analysis, Crash Dump Patterns, DebugWare Patterns, Debugging, Debugging Industry, Debugging Methodology, Debugging Trends, Dublin School of Security, Economics, Education and Research, Escalation Engineering, First Fault Problem Solving, Malware Analysis, Malware Patterns, Mathematics of Debugging, Memiotics (Memory Semiotics), Memoretics, Memory Analysis Forensics and Intelligence, Memory Analysis Report System, Memory Dump Analysis Services, Memory Systems Language, Memory Visualization, New Debugging School, Science of Memory Dump Analysis, Science of Software Tracing, Security, Software Behavior Patterns, Software Defect Construction, Software Engineering, Software Generalist, Software Maintenance Institute, Software Narratology, Software Trace Analysis, Software Trace Visualization, Software Tracing Implementation Patterns, Software Troubleshooting Patterns, Structural Memory Patterns, Structural Trace Patterns, Systems Thinking, Testing, Tool Objects, Tools, Trace Analysis Patterns, Training and Seminars, Troubleshooting Methodology, Unified Debugging Patterns, Victimware, Visual Dump Analysis, Webinars, Workaround Patterns | No Comments »
Friday, December 17th, 2010
As the new decade is approaching (2011-2020) we would like to make a few previews and predictions:
- Increased complexity of software will bring more methods from biological, social sciences and humanities in addition to existing methods of automated debugging and computer science techniques
- Focus on first fault software problem solving (when aspect)
- Focus on pattern-driven software problem solving (how aspect)
- Fusion of debugging and malware analysis into a unified structural and behavioral pattern framework
- Visual debugging, memory and software trace visualization techniques
- Software maintenance certification
- Focus on domain-driven troubleshooting and debugging tools as a service (debugware TaaS)
- Focus on security issues related to memory dumps and software traces
- New scripting languages and programming language extensions for debugging
- The maturation of the science of memory snapshots and software traces (memoretics)
Imagining is not not limited to the above and more to come and explain in the forthcoming parts.
- Dmitry Vostokov @ DumpAnalysis.org + TraceAnalysis.org -
Posted in Announcements, Anthropology, Archaeology of Computer Memory, Biology, Certification, Computer Science, Countefactual Debugging, Crash Analysis Report Environment (CARE), Crash Dump Analysis, Crash Dump Patterns, DebugWare Patterns, Debugging, Debugging Industry, Debugging Methodology, Debugging Trends, Dublin School of Security, EasyDbg, Economics, Escalation Engineering, Evolution, First Fault Problem Solving, Futuristic Memory Dump Analysis, General Memory Analysis, General Science, Geography, Hardware, Hermeneutics of Memory Dumps and Traces, History, Humanities, Language, Laws of Troubleshooting and Debugging, Logic, Malware Analysis, Malware Patterns, Mathematics of Debugging, Memiotics (Memory Semiotics), Memoretics, Memory Analysis Forensics and Intelligence, Memory Analysis Report System, Memory Dump Analysis and History, Memory Systems Language, Memory Visualization, Paleo-debugging, Pattern Models, Pattern Prediction, Physics, Psychology, Publishing, Science of Memory Dump Analysis, Science of Software Tracing, Security, Social Media, Social Sciences, Software Architecture, Software Behavior Patterns, Software Chorography, Software Chorology, Software Defect Construction, Software Engineering, Software Generalist, Software Maintenance Institute, Software Narrative Fiction, Software Narratology, Software Technical Support, Software Trace Analysis, Software Trace Analysis and History, Software Trace Deconstruction, Software Trace Linguistics, Software Trace Visualization, Software Troubleshooting Patterns, Software Victimology, Statistics, Structural Memory Analysis and Social Sciences, Structural Memory Patterns, Structural Trace Patterns, Systems Thinking, Testing, Tools, Trace Analysis Patterns, Troubleshooting Methodology, Unified Debugging Patterns, Uses of UML, Victimware, Virtualization, Visual Dump Analysis, Windows System Administration, Workaround Patterns | No Comments »
Friday, November 12th, 2010
Five volumes of cross-disciplinary Anthology (dubbed by the author “The Summa Memorianica”) lay the foundation of the scientific discipline of Memoretics (study of computer memory snapshots and their evolution in time) that is also called Memory Dump and Software Trace Analysis.ca
The 5th volume contains revised, edited, cross-referenced, and thematically organized selected DumpAnalysis.org blog posts about crash dump, software trace analysis and debugging written in February 2010 - October 2010 for software engineers developing and maintaining products on Windows platforms, quality assurance engineers testing software on Windows platforms, technical support and escalation engineers dealing with complex software issues, and security researchers, malware analysts and reverse engineers. The fifth volume features:
- 25 new crash dump analysis patterns
- 11 new pattern interaction case studies (including software tracing)
- 16 new trace analysis patterns
- 7 structural memory patterns
- 4 modeling case studies for memory dump analysis patterns
- Discussion of 3 common analysis mistakes
- Malware analysis case study
- Computer independent architecture of crash analysis report service
- Expanded coverage of software narratology
- Metaphysical and theological implications of memory dump worldview
- More pictures of memory space and physicalist art
- Classification of memory visualization tools
- Memory visualization case studies
- Close reading of the stories of Sherlock Holmes: Dr. Watson’s observational patterns
- Fully cross-referenced with Volume 1, Volume 2, Volume 3, and Volume 4
Product information:
- Title: Memory Dump Analysis Anthology, Volume 5
- Author: Dmitry Vostokov
- Language: English
- Product Dimensions: 22.86 x 15.24
- Paperback: 400 pages
- Publisher: Opentask (10 December 2010)
- ISBN-13: 978-1-906717-96-4
- Hardcover: 400 pages
- Publisher: Opentask (10 December 2010)
- ISBN-13: 978-1-906717-97-1

Back cover features memory space art image Hot Computation: Memory on Fire.
- Dmitry Vostokov @ DumpAnalysis.org + TraceAnalysis.org -
Posted in Aesthetics of Memory Dumps, Announcements, Archaeology of Computer Memory, Art, Assembly Language, Books, C and C++, CDF Analysis Tips and Tricks, Categorical Debugging, Common Mistakes, Complete Memory Dump Analysis, Computer Science, Crash Analysis Report Environment (CARE), Crash Dump Analysis, Crash Dump De-analysis, Crash Dump Patterns, Debugging, Debugging Methodology, Debugging Slang, Deep Down C++, Dr. Watson, Dublin School of Security, Education and Research, Escalation Engineering, Fun with Crash Dumps, Fun with Debugging, Fun with Software Traces, General Memory Analysis, Hermeneutics of Memory Dumps and Traces, Images of Computer Memory, Kernel Development, Malware Analysis, Malware Patterns, Mathematics of Debugging, Memiotics (Memory Semiotics), Memoidealism, Memoretics, Memory Analysis Culture, Memory Analysis Forensics and Intelligence, Memory Analysis Report System, Memory Diagrams, Memory Dreams, Memory Dump Analysis Jobs, Memory Dump Analysis Services, Memory Dump Analysis and History, Memory Dumps in Movies, Memory Dumps in Myths, Memory Religion (Memorianity), Memory Space Art, Memory Systems Language, Memory Visualization, Memory and Glitches, Memuonics, Metaphysical Society of Ireland, Minidump Analysis, Movies and Debugging, Multithreading, Museum of Debugging, Music for Debugging, Music of Computation, New Acronyms, New Words, Paleo-debugging, Pattern Models, Pattern Prediction, Philosophy, Physicalist Art, Psychoanalysis of Software Maintenance and Support, Publishing, Science of Memory Dump Analysis, Science of Software Tracing, Security, Software Architecture, Software Behavior Patterns, Software Chorography, Software Chorology, Software Defect Construction, Software Engineering, Software Generalist, Software Maintenance Institute, Software Narratology, Software Technical Support, Software Trace Analysis, Software Trace Analysis and History, Software Trace Deconstruction, Software Trace Reading, Software Trace Visualization, Software Tracing for Dummies, Software Troubleshooting Patterns, Software Victimology, Stack Trace Collection, Structural Memory Analysis and Social Sciences, Structural Memory Patterns, Structural Trace Patterns, Systems Thinking, Testing, Theology, Tool Objects, Tools, Trace Analysis Patterns, Training and Seminars, Troubleshooting Methodology, Uses of UML, Victimware, Virtualization, Vista, Visual Dump Analysis, Webinars, WinDbg Scripts, WinDbg Tips and Tricks, WinDbg for GDB Users, Windows 7, Windows Server 2008, Windows System Administration, Workaround Patterns, x64 Windows | No Comments »
Sunday, September 19th, 2010
Finally, after the delay, the issue is available in print on Amazon and through other sellers:
Debugged! MZ/PE: Multithreading

- Dmitry Vostokov @ DumpAnalysis.org + TraceAnalysis.org -
Posted in .NET Debugging, Announcements, CDF Analysis Tips and Tricks, Citrix, Computer Science, Debugged! MZ/PE, Debugging, Memory Dump Analysis Services, Multithreading, Publishing, Science of Software Tracing, Software Trace Analysis, Software Trace Visualization, Tools, Trace Analysis Patterns, WinDbg Tips and Tricks | No Comments »
Sunday, July 4th, 2010
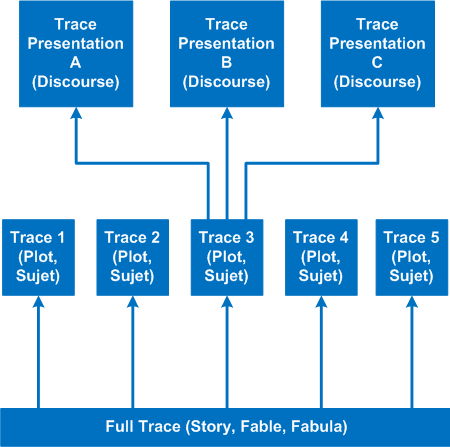
It’s time to introduce a conceptual software narratological framework for viewing software traces (using rich ETW / CDF tracing as our main focus). Here we consider a software story (fabula) as a full trace when every component was selected for tracing and emits debug messages during code execution paths. However, during viewing we can filter on and off certain modules, threads, processes, messages, etc. (adjoint threading) and see a different sub-story or plot (sujet). Every software plot (please do not confuse with PLOT acronym) can be presented differently (using appropriate discourse). Some presentational examples include temporal rearrangement, collapse of repetitive regions, source code hypertext (lexia) and allegorical devices such as message tool-tip comments. Here is a diagram that depicts story (fable, fabula) - plot (sujet) - presentation (discourse):
- Dmitry Vostokov @ DumpAnalysis.org + TraceAnalysis.org -
Posted in CDF Analysis Tips and Tricks, Debugging, Science of Software Tracing, Software Narratology, Software Trace Analysis, Software Trace Reading, Software Trace Visualization | No Comments »
Wednesday, June 23rd, 2010
Looks like reading Darwin biography influenced me in the direction of founding a museum. So I did and here’s its draft logo:

This multi-dimensional museum will show exhibitions dedicated to the history of debugging, memory dump artifacts and art. Stay tuned. The first exhibition opens very soon.
If you would like to donate an exhibit (for example, an old memory dump or a picture related to debugging) please use this page: http://www.dumpanalysis.org/contact. Any donations are greatly appreciated!
- Dmitry Vostokov @ DumpAnalysis.org + TraceAnalysis.org -
Posted in Announcements, Crash Dump Analysis, Debugging, History, Memorian Art, Memory Analysis Culture, Memory Auralization, Memory Dumps in Movies, Memory Dumps in Myths, Memory Space Art, Memory Space Music, Memory Visualization, Movies and Debugging, Museum of Debugging, Opcodism, Paleo-debugging, Physicalist Art, Software Trace Visualization, Stack Trace Collection | 2 Comments »
Tuesday, June 8th, 2010
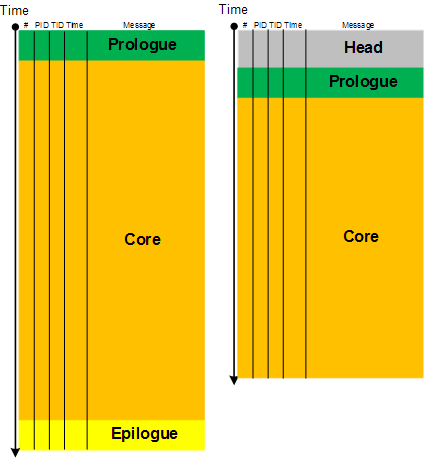
Here we introduce a software narratological partitioning of a trace into Head, Prologue, Core, Epilogue and Tail segments. This is useful for comparative software trace analysis. Suppose, a trace started just before the reproduction steps or a start marker was injected (by CDFMarker, for example) and finished just after the last repro steps or after an end marker was injected. Then its core trace messages are surrounded by prologue and epilogue statements. What is before and after are not necessary for analysis and usually distract an analyst. They are shown as grey areas on the following picture where the left trace is for working (non-working) scenario and the right trace is for non-working (working) scenario:
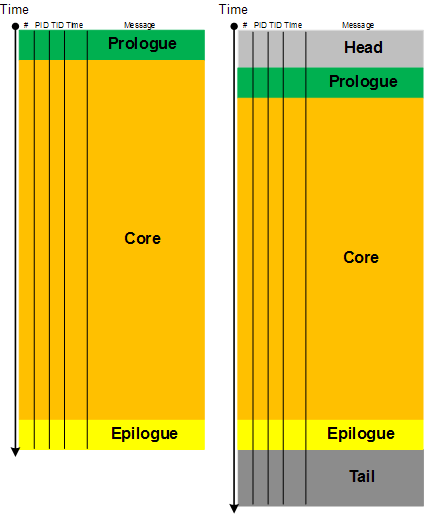
The size of a core segment need not be the same because environments and executed code paths might be different. However, often some traces are truncated (another pattern). Also sometimes it is difficult to establish whether the first trace is normal and the second has a tail or the first one is truncated and the second one is normal with an optional tail. Here artificial markers are important.
- Dmitry Vostokov @ DumpAnalysis.org + TraceAnalysis.org -
Posted in Software Narratology, Software Trace Analysis, Software Trace Reading, Software Trace Visualization, Trace Analysis Patterns | No Comments »
Friday, April 30th, 2010
Memory Dump Analysis Anthology lacks full color inserts. This is rather a current limitation of POD technology that OpenTask publisher uses at the present time. The solution previously announced a year ago is to print a separate full color title with selected articles and illustrations. Finally, it is about to be published next month. The book front and back covers are collages from covers of individual memory dump analysis volumes:
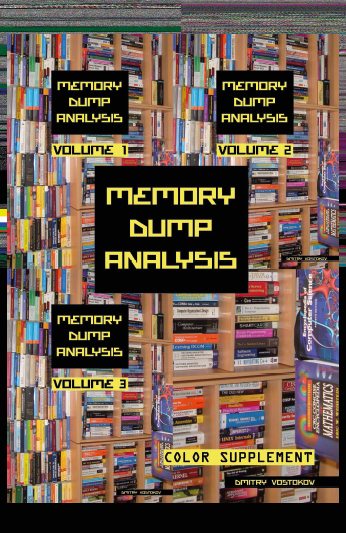
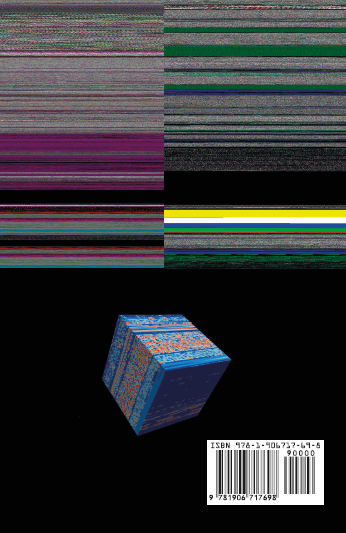
TOC will be available soon. Here is the book data:
- Title: Memory Dump Analysis Anthology: Color Supplement for Volumes 1-3
- Author: Dmitry Vostokov
- Publisher: OpenTask (May 2010)
- Language: English
- Product Dimensions: 21.6 x 14.0
- Paperback: 110 pages
- ISBN-13: 978-1906717698
OpenTask also plans a separate color supplement for volumes 4 and 5 once they are published.
- Dmitry Vostokov @ DumpAnalysis.org + TraceAnalysis.org -
Posted in Announcements, Books, Crash Dump Analysis, Debugging, Fun with Crash Dumps, Memory Space Art, Memory Visualization, Publishing, Software Trace Visualization | 2 Comments »
Sunday, April 18th, 2010
OpenTask to offer first 3 volumes of Memory Dump Analysis Anthology in one set:


The set is available exclusively from OpenTask e-Commerce web site starting from June. Individual volumes are also available from Amazon, Barnes & Noble and other bookstores worldwide.
Product information:
- Title: Modern Memory Dump and Software Trace Analysis: Volumes 1-3
- Author: Dmitry Vostokov
- Language: English
- Product Dimensions: 22.86 x 15.24
- Paperback: 1600 pages
- Publisher: Opentask (31 May 2010)
- ISBN-13: 978-1-906717-99-5
Information about individual volumes:
- Dmitry Vostokov @ DumpAnalysis.org + TraceAnalysis.org -
Posted in .NET Debugging, Aesthetics of Memory Dumps, Announcements, AntiPatterns, Art, Assembly Language, Books, Bugchecks Depicted, C and C++, CDA Pattern Classification, CDF Analysis Tips and Tricks, Categorical Debugging, Certification, Citrix, Code Reading, Common Mistakes, Computational Ghosts and Bug Hauntings, Computer Science, Countefactual Debugging, Crash Analysis Report Environment (CARE), Crash Dump Analysis, Crash Dump Patterns, Crash Dumps for Dummies, Data Recovery, DebugWare Patterns, Debugging, Debugging Methodology, Debugging Slang, Deep Down C++, Dictionary of Debugging, Dr. Watson, Education and Research, Escalation Engineering, Fun with Crash Dumps, Futuristic Memory Dump Analysis, GDB for WinDbg Users, Hardware, History, Horrors of Computation, Hyper-V, Intelligent Memory Movement, Kernel Development, Laws of Troubleshooting and Debugging, Mathematics of Debugging, Memiotics (Memory Semiotics), Memoidealism, Memoretics, Memory Analysis Culture, Memory Analysis Forensics and Intelligence, Memory Auralization, Memory Dump Analysis Jobs, Memory Religion (Memorianity), Memory Space Art, Memory Space Music, Memory Systems Language, Memory Visualization, Memuonics, Minidump Analysis, Multithreading, Music for Debugging, Music of Computation, New Acronyms, New Words, Occult Debugging, Philosophy, Psi-computation, Publishing, Science of Memory Dump Analysis, Science of Software Tracing, Security, Software Architecture, Software Defect Construction, Software Engineering, Software Generalist, Software Maintenance Institute, Software Narratology, Software Technical Support, Software Trace Analysis, Software Trace Visualization, Software Tracing for Dummies, Software Victimology, Stack Trace Collection, Testing, Tools, Trace Analysis Patterns, Training and Seminars, Troubleshooting Methodology, Victimware, Virtualization, Vista, Visual Dump Analysis, WinDbg Scripts, WinDbg Tips and Tricks, WinDbg for GDB Users, Windows 7, Windows Server 2008, Windows System Administration | No Comments »
Friday, April 9th, 2010
Plan to start providing training and seminars in my free time. If you are interested please answer these questions (you can either respond here in comments or use this form for private communication http://www.dumpanalysis.org/contact):
- Are you interested in on-site training, prefer traveling or attending webinars?
- Are you interested in software trace analysis as well?
- What specific topics are you interested in?
- What training level (beginner, intermediate, advanced) are you interested in? (please provide an example, if possible)
Additional topics of expertise that can be integrated into training include Source Code Reading and Analysis, Debugging, Windows Architecture, Device Drivers, Troubleshooting Tools Design and Implementation, Multithreading, Deep Down C and C++, x86 and x64 Assembly Language Reading.
Looking forward to your responses. Any suggestions are welcome.
- Dmitry Vostokov @ DumpAnalysis.org + TraceAnalysis.org -
Posted in .NET Debugging, Announcements, AntiPatterns, Assembly Language, Bugchecks Depicted, C and C++, CDA Pattern Classification, CDF Analysis Tips and Tricks, Certification, Code Reading, Common Mistakes, Crash Analysis Report Environment (CARE), Crash Dump Analysis, Crash Dump Patterns, Crash Dumps for Dummies, Data Recovery, DebugWare Patterns, Debugging, Debugging Methodology, Deep Down C++, Education and Research, Escalation Engineering, FreeBSD Crash Corner, GDB for WinDbg Users, Hardware, Hyper-V, Java Debugging, Kernel Development, Laws of Troubleshooting and Debugging, Linux Crash Corner, Mac Crash Corner, Memory Analysis Forensics and Intelligence, Memory Visualization, Minidump Analysis, Multithreading, Security, Software Architecture, Software Defect Construction, Software Engineering, Software Generalist, Software Maintenance Institute, Software Narratology, Software Technical Support, Software Trace Analysis, Software Trace Visualization, Software Tracing for Dummies, Software Victimology, Stack Trace Collection, Testing, Tools, Trace Analysis Patterns, Training and Seminars, Troubleshooting Methodology, Victimware, Virtualization, Vista, Visual Dump Analysis, WinDbg Scripts, WinDbg Tips and Tricks, WinDbg for GDB Users, Windows 7, Windows Server 2008, Windows System Administration, Workaround Patterns | No Comments »
Thursday, April 8th, 2010
“Capturing delicate moments, one gives birth to a poetry of traces …”
Ange Leccia, Motionless Journeys, by Fabien Danesi
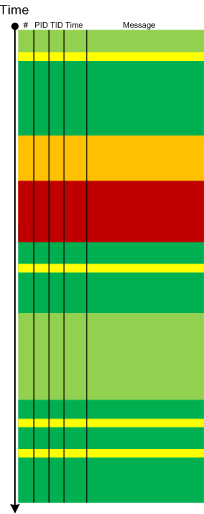
More patterns from software narratology. Now we illustrate Defamiliarizing Effect where we see sudden unfamiliar trace statements across familiar landscape of characteristic blocks and activity regions:
/familar traces/
/new trace from a problem system/
- Dmitry Vostokov @ DumpAnalysis.org + TraceAnalysis.org -
Posted in CDF Analysis Tips and Tricks, Citrix, Debugging, Software Narratology, Software Trace Analysis, Software Trace Visualization, Trace Analysis Patterns | 1 Comment »
Thursday, April 8th, 2010
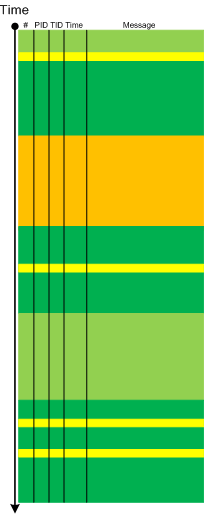
Metaphorical bijection from literary narratology to software narratology provides a pattern of Background and Foreground Components. This can be easily illustrated on pseudo-trace color diagrams. Suppose we troubleshoot a graphical issue using an ETW trace containing the output from all components of the problem system. Graphic components and their messages are foreground for a trace viewer (a person) against numerous background components (for example, database, file and registry access, shown in shades of green):
Trace viewers (for example, CDFAnalyzer) can filter out background component messages and present only foreground components (that I propose to call component foregrounding):
Of course, this process is iterative and parts of what once was foreground become background and candidates for further filtering:
- Dmitry Vostokov @ DumpAnalysis.org + TraceAnalysis.org -
Posted in CDF Analysis Tips and Tricks, Citrix, Debugging, Software Narratology, Software Trace Analysis, Software Trace Visualization, Tools, Trace Analysis Patterns | 2 Comments »
Monday, March 8th, 2010
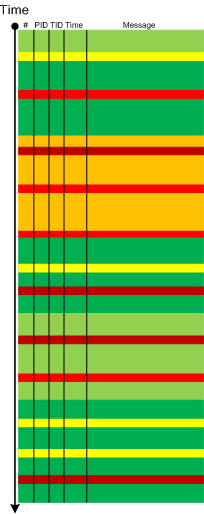
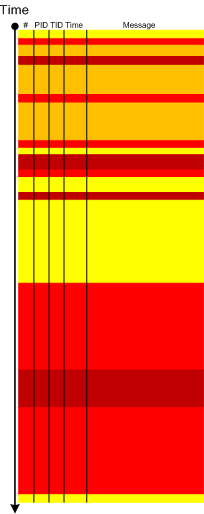
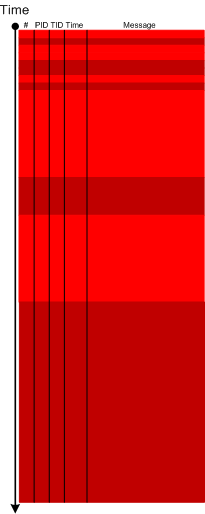
Sometimes we have a sequence of Activity Regions with increasing values of Statement Current, like depicted here:
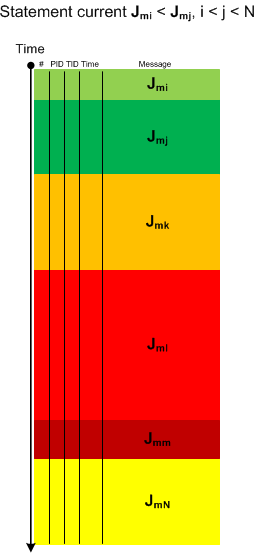
The boundaries of regions may be blurry and arbitrarily drawn. Nevertheless, the current is visibly increasing or decreasing, hence the name of this pattern: Trace Acceleration, by analogy with physical acceleration, second-order derivative. We can also metaphorically use here the notion of a partial derivative for trace statement current and acceleration for Threads of Activity and Adjoint Threads of Activity but whether it is useful remains to be seen.
- Dmitry Vostokov @ DumpAnalysis.org + TraceAnalysis.org -
Posted in CDF Analysis Tips and Tricks, Debugging, Software Trace Analysis, Software Trace Visualization, Trace Analysis Patterns | 1 Comment »
Thursday, February 11th, 2010
This is a revised, edited, cross-referenced and thematically organized volume of selected DumpAnalysis.org blog posts about crash dump analysis and debugging written in July 2009 - January 2010 for software engineers developing and maintaining products on Windows platforms, quality assurance engineers testing software on Windows platforms and technical support and escalation engineers dealing with complex software issues. The fourth volume features:
- 13 new crash dump analysis patterns
- 13 new pattern interaction case studies
- 10 new trace analysis patterns
- 6 new Debugware patterns and case study
- Workaround patterns
- Updated checklist
- Fully cross-referenced with Volume 1, Volume 2 and Volume 3
- New appendixes
Product information:
- Title: Memory Dump Analysis Anthology, Volume 4
- Author: Dmitry Vostokov
- Language: English
- Product Dimensions: 22.86 x 15.24
- Paperback: 410 pages
- Publisher: Opentask (30 March 2010)
- ISBN-13: 978-1-906717-86-5
- Hardcover: 410 pages
- Publisher: Opentask (30 April 2010)
- ISBN-13: 978-1-906717-87-2

Back cover features memory space art image: Internal Process Combustion.
- Dmitry Vostokov @ DumpAnalysis.org + TraceAnalysis.org -
Posted in .NET Debugging, Aesthetics of Memory Dumps, Announcements, AntiPatterns, Art, Assembly Language, Books, C and C++, CDA Pattern Classification, CDF Analysis Tips and Tricks, Categorical Debugging, Certification, Citrix, Code Reading, Common Mistakes, Computer Science, Countefactual Debugging, Crash Analysis Report Environment (CARE), Crash Dump Analysis, Crash Dump Patterns, Crash Dumps for Dummies, DebugWare Patterns, Debugging, Debugging Slang, Education and Research, Escalation Engineering, Fun with Crash Dumps, Games for Debugging, Hardware, Horrors of Computation, Hyper-V, Kernel Development, Laws of Troubleshooting and Debugging, Mathematics of Debugging, Memiotics (Memory Semiotics), Memoidealism, Memoretics, Memory Analysis Culture, Memory Analysis Forensics and Intelligence, Memory Dreams, Memory Dump Analysis Jobs, Memory Dumps in Movies, Memory Space Art, Memory Visualization, Memuonics, Minidump Analysis, Multithreading, Music for Debugging, New Acronyms, New Words, Opcodism, Philosophy, Physicalist Art, Publishing, Science Fiction, Science of Memory Dump Analysis, Science of Software Tracing, Security, Software Architecture, Software Defect Construction, Software Engineering, Software Generalist, Software Maintenance Institute, Software Narratology, Software Technical Support, Software Trace Analysis, Software Trace Visualization, Software Tracing for Dummies, Software Victimology, Stack Trace Collection, Testing, Tools, Trace Analysis Patterns, Training and Seminars, Troubleshooting Methodology, Victimware, Virtualization, Vista, Visual Dump Analysis, WinDbg Scripts, WinDbg Tips and Tricks, WinDbg for GDB Users, Windows 7, Windows Server 2008, Windows System Administration, Workaround Patterns | No Comments »
Sunday, January 17th, 2010
Having considered computational threads as braided strings and after discerning several software trace analysis patterns (just the beginning) we can see formatted and tabulated software trace output in a new light and employ the “fabric of traces” and braid metaphors for an Adjoint Thread concept. This new concept was motivated by reading about Extended Phenotype (*) and extensive analysis of Citrix ETW-based CDF traces using CDFAnalyzer. The term Adjoint was borrowed from mathematics because the concept we discuss below resembles this metaphorical formula: (Thread A, B) = [A, Thread B]. Let me first illustrate adjoint threading using simplified trace tables. Consider this generalized software trace example (date and time column is omitted for visual clarity):
|
#
|
Source Dir
|
PID
|
TID
|
File Name
|
Function
|
Message
|
|
1
|
\src\subsystemA
|
2792
|
5676
|
file1.cpp
|
fooA
|
Message text…
|
|
2
|
\src\subsystemA
|
2792
|
5676
|
file1.cpp
|
fooA
|
Message text…
|
|
3
|
\src\subsystemA
|
2792
|
5676
|
file1.cpp
|
fooA
|
Message text…
|
|
4
|
\src\lib
|
2792
|
5680
|
file2.cpp
|
barA
|
Message text…
|
|
5
|
\src\subsystemA
|
2792
|
5680
|
file1.cpp
|
fooA
|
Message text…
|
|
6
|
\src\subsystemA
|
2792
|
5676
|
file1.cpp
|
fooA
|
Message text…
|
|
7
|
\src\lib
|
2792
|
5680
|
file2.cpp
|
fooA
|
Message text…
|
|
8
|
\src\lib
|
2792
|
5680
|
file2.cpp
|
fooA
|
Message text…
|
|
9
|
\src\subsystemB
|
2792
|
3912
|
file3.cpp
|
barB
|
Message text…
|
|
10
|
\src\subsystemB
|
2792
|
3912
|
file3.cpp
|
barB
|
Message text…
|
|
11
|
\src\subsystemB
|
2792
|
3912
|
file3.cpp
|
barB
|
Message text…
|
|
12
|
\src\subsystemB
|
2792
|
3912
|
file3.cpp
|
barB
|
Message text…
|
|
13
|
\src\subsystemB
|
2792
|
3912
|
file3.cpp
|
barB
|
Message text…
|
|
14
|
\src\subsystemB
|
2792
|
3912
|
file3.cpp
|
barB
|
Message text…
|
|
15
|
\src\subsystemB
|
2792
|
2992
|
file4.cpp
|
fooB
|
Message text…
|
|
16
|
\src\subsystemB
|
2792
|
3008
|
file4.cpp
|
fooB
|
Message text…
|
|
…
|
…
|
…
|
…
|
…
|
…
|
…
|
We see several threads in a process PID 2792. In CDFAnalyzer we can filter trace messages that belong to any column and if we filter by TID we get a view of any Thread of Activity. However, each thread can “run” through any source directory, file name or function. If a function belongs to a library multiple threads would access it. This source location (can be considered as a subsystem), file or function view of activity is called an Adjoint Thread. For example, if we filter only subsystemA column in the trace above we get this table:
|
#
|
Source Dir
|
PID
|
TID
|
File Name
|
Function
|
Message
|
|
1
|
\src\subsystemA
|
2792
|
5676
|
file1.cpp
|
fooA
|
Message …
|
|
2
|
\src\subsystemA
|
2792
|
5676
|
file1.cpp
|
fooA
|
Message …
|
|
3
|
\src\subsystemA
|
2792
|
5676
|
file1.cpp
|
fooA
|
Message …
|
|
5
|
\src\subsystemA
|
2792
|
5680
|
file1.cpp
|
fooA
|
Message …
|
|
6
|
\src\subsystemA
|
2792
|
5676
|
file1.cpp
|
fooA
|
Message …
|
|
7005
|
\src\subsystemA
|
2792
|
5664
|
file1.cpp
|
fooA
|
Message …
|
|
10198
|
\src\subsystemA
|
2792
|
5664
|
file1.cpp
|
fooA
|
Message …
|
|
10364
|
\src\subsystemA
|
2792
|
5664
|
file1.cpp
|
fooA
|
Message …
|
|
10417
|
\src\subsystemA
|
2792
|
5664
|
file1.cpp
|
fooA
|
Message …
|
|
10420
|
\src\subsystemA
|
2792
|
5676
|
file1.cpp
|
fooA
|
Message …
|
|
10422
|
\src\subsystemA
|
2792
|
5680
|
file1.cpp
|
fooA
|
Message …
|
|
10587
|
\src\subsystemA
|
2792
|
5664
|
file1.cpp
|
fooA
|
Message …
|
|
10767
|
\src\subsystemA
|
2792
|
5680
|
file1.cpp
|
fooA
|
Message …
|
|
11126
|
\src\subsystemA
|
2792
|
5668
|
file1.cpp
|
fooA
|
Message …
|
|
11131
|
\src\subsystemA
|
2792
|
5680
|
file1.cpp
|
fooA
|
Message …
|
|
11398
|
\src\subsystemA
|
2792
|
5676
|
file1.cpp
|
fooA
|
Message …
|
|
11501
|
\src\subsystemA
|
2792
|
5668
|
file1.cpp
|
fooA
|
Message …
|
|
11507
|
\src\subsystemA
|
2792
|
5668
|
file1.cpp
|
fooA
|
Message …
|
|
11509
|
\src\subsystemA
|
2792
|
5664
|
file1.cpp
|
fooA
|
Message …
|
|
11513
|
\src\subsystemA
|
2792
|
5680
|
file1.cpp
|
fooA
|
Message …
|
|
11524
|
\src\subsystemA
|
2792
|
5668
|
file1.cpp
|
fooA
|
Message …
|
|
…
|
…
|
…
|
…
|
…
|
…
|
…
|
We can graphically view subsystemA as a braid string that “permeates the fabric of threads”:
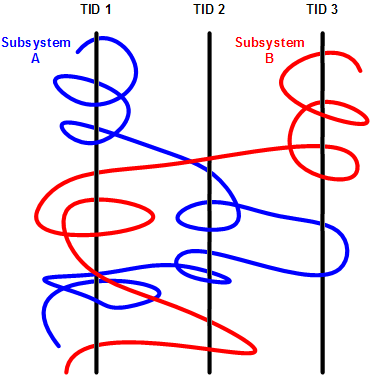
We can get many different braids by changing filters, hence multibraiding. Here is another example of a driver source file view initially permeating 2 process contexts and 4 threads:
|
#
|
Source Dir
|
PID
|
TID
|
File Name
|
Function
|
Message
|
|
41
|
\src\sys\driver
|
3636
|
3848
|
entry.c
|
DriverEntry
|
IOCTL …
|
|
80
|
\src\sys\driver
|
3636
|
3896
|
entry.c
|
DriverEntry
|
IOCTL …
|
|
99
|
\src\sys\driver
|
3636
|
3896
|
entry.c
|
DriverEntry
|
IOCTL …
|
|
102
|
\src\sys\driver
|
3636
|
3896
|
entry.c
|
DriverEntry
|
IOCTL …
|
|
179
|
\src\sys\driver
|
3636
|
3896
|
entry.c
|
DriverEntry
|
IOCTL …
|
|
180
|
\src\sys\driver
|
3636
|
3896
|
entry.c
|
DriverEntry
|
IOCTL …
|
|
311
|
\src\sys\driver
|
3636
|
3896
|
entry.c
|
DriverEntry
|
IOCTL …
|
|
447
|
\src\sys\driver
|
3636
|
3896
|
entry.c
|
DriverEntry
|
IOCTL …
|
|
448
|
\src\sys\driver
|
3636
|
3896
|
entry.c
|
DriverEntry
|
IOCTL …
|
|
457
|
\src\sys\driver
|
2792
|
5108
|
entry.c
|
DriverEntry
|
IOCTL …
|
|
608
|
\src\sys\driver
|
3636
|
3896
|
entry.c
|
DriverEntry
|
IOCTL …
|
|
614
|
\src\sys\driver
|
3636
|
3896
|
entry.c
|
DriverEntry
|
IOCTL …
|
|
655
|
\src\sys\driver
|
3636
|
3896
|
entry.c
|
DriverEntry
|
IOCTL …
|
|
675
|
\src\sys\driver
|
3636
|
3896
|
entry.c
|
DriverEntry
|
IOCTL …
|
|
678
|
\src\sys\driver
|
3636
|
3896
|
entry.c
|
DriverEntry
|
IOCTL …
|
|
680
|
\src\sys\driver
|
3636
|
3896
|
entry.c
|
DriverEntry
|
IOCTL …
|
|
681
|
\src\sys\driver
|
3636
|
3896
|
entry.c
|
DriverEntry
|
IOCTL …
|
|
1145
|
\src\sys\driver
|
3636
|
4960
|
entry.c
|
DriverEntry
|
IOCTL …
|
|
1153
|
\src\sys\driver
|
3636
|
4960
|
entry.c
|
DriverEntry
|
IOCTL …
|
|
1154
|
\src\sys\driver
|
3636
|
4960
|
entry.c
|
DriverEntry
|
IOCTL …
|
|
…
|
…
|
…
|
…
|
…
|
…
|
…
|
(*) A bit of digression. Looks like biology keeps giving insights into software, there is even a software phenotype metaphor albeit a bit restricted to code, I just thought that we need also an Extended Software Phenotype.
- Dmitry Vostokov @ DumpAnalysis.org + TraceAnalysis.org -
Posted in Citrix, Computer Science, Debugging, Mathematics of Debugging, Multithreading, New Words, Science of Software Tracing, Software Trace Analysis, Software Trace Visualization, Trace Analysis Patterns | 2 Comments »
Sunday, December 27th, 2009
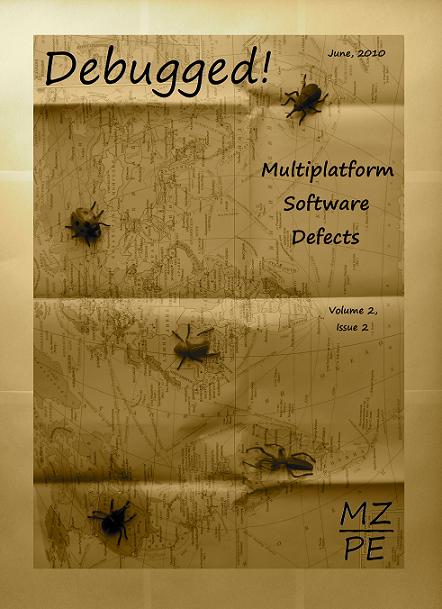
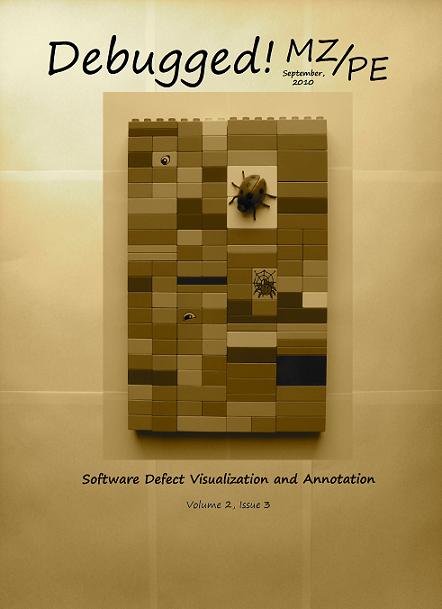
Main topics of Debugged! MZ/PE magazine issues for June and September 2010:
Debugged! MZ/PE: Multiplatform Software Defects, June, 2010 (Paperback, ISBN: 978-1906717902)
Debugged! MZ/PE: Software Defect Visualization and Annotation, September, 2010 (Paperback, ISBN: 978-1906717919)
Here are draft front covers designed today:
- Dmitry Vostokov @ DumpAnalysis.org -
Posted in Announcements, Books, Computer Science, Crash Dump Analysis, Debugged! MZ/PE, Debugging, Memory Visualization, Publishing, Software Engineering, Software Technical Support, Software Trace Analysis, Software Trace Visualization | No Comments »
Sunday, December 20th, 2009
“Memory dumps are facts.”
I’m very excited to announce that Volume 3 is available in paperback, hardcover and digital editions:
Memory Dump Analysis Anthology, Volume 3
Table of Contents
In two weeks paperback edition should also appear on Amazon and other bookstores. Amazon hardcover edition is planned to be available in January 2010.
The amount of information was so voluminous that I had to split the originally planned volume into two. Volume 4 should appear by the middle of February together with Color Supplement for Volumes 1-4.
- Dmitry Vostokov @ DumpAnalysis.org -
Posted in .NET Debugging, Aesthetics of Memory Dumps, Announcements, AntiPatterns, Art, Assembly Language, Books, Bugtations, C and C++, CDA Pattern Classification, CDF Analysis Tips and Tricks, Certification, Citrix, Code Reading, Common Mistakes, Computer Science, Crash Dump Analysis, Crash Dump Patterns, Crash Dumps for Dummies, DebugWare Patterns, Debugging, Debugging Slang, Deep Down C++, Education and Research, Escalation Engineering, Fun with Crash Dumps, Hardware, Horrors of Computation, Kernel Development, Mathematics of Debugging, Memiotics (Memory Semiotics), Memoidealism, Memoretics, Memory Analysis Culture, Memory Analysis Forensics and Intelligence, Memory Space Art, Memory Visualization, Minidump Analysis, Multithreading, Philosophy, Poetry, Publishing, Science of Memory Dump Analysis, Science of Software Tracing, Security, Software Architecture, Software Defect Construction, Software Engineering, Software Narratology, Software Technical Support, Software Trace Analysis, Software Trace Visualization, Software Tracing for Dummies, Software Victimology, Stack Trace Collection, Testing, Tools, Trace Analysis Patterns, Training and Seminars, Troubleshooting Methodology, Victimware, Virtualization, Vista, Visual Dump Analysis, WinDbg Scripts, WinDbg Tips and Tricks, WinDbg for GDB Users, Windows 7, Windows Server 2008, Windows System Administration | 1 Comment »
Wednesday, December 16th, 2009
Finally, after the long delay, the issue is available in print on Amazon and through other sellers:
Debugged! MZ/PE: Software Tracing
- Dmitry Vostokov @ DumpAnalysis.org -
Posted in Announcements, Books, CDF Analysis Tips and Tricks, Computer Science, Crash Dump Analysis, Crash Dump Patterns, Debugged! MZ/PE, Debugging, Education and Research, Fun with Crash Dumps, Memoretics, Memory Visualization, Publishing, Science of Memory Dump Analysis, Science of Software Tracing, Software Technical Support, Software Trace Analysis, Software Trace Visualization, Testing, Tools, Trace Analysis Patterns, Training and Seminars, Troubleshooting Methodology, Visual Dump Analysis | 1 Comment »