Archive for the ‘Software Technical Support’ Category
Wednesday, April 2nd, 2008
Born out of 2008 April Fool’s joke (although I was thinking about it long before) the idea is to have a general framework and associated IDE for analysis activities for various tools that produce logs. Similar to planned GUI Monitor integrating WindowHistory, MesageHistory and ScreenHistory tools but also including Debugger Log Analyzer, Debugging Notebooks, various memory and trace log visualization subsystems. It also has the working title UTF (Unified Tools Framework).
Seems I’m very easy on inceptions  All this will be covered in great detail in the forthcoming book which I tirelessly advertise:
DebugWare: The Art and Craft of Writing Troubleshooting Tools
- Dmitry Vostokov @ DumpAnalysis.org -
Posted in Announcements, Crash Dump Analysis, Crash Dump Patterns, Debugging, Memory Visualization, Minidump Analysis, Software Architecture, Software Technical Support, Stack Trace Collection, Tools, Troubleshooting Methodology | 2 Comments »
Sunday, March 30th, 2008
This is an attempt to revive the forum closed a year ago due to the lack of interest during that time. Now the number of visitors has increased by an order of magnitude and I get more and more requests to help with crash dump analysis but I cannot guarantee immediate response. Therefore I upgraded and reopened Crash Dump Analysis and Debugging Forum and encourage using it. In order to prevent spammers gaining access any new registration has to be approved by me (usually in less than 24 hours).
- Dmitry Vostokov @ DumpAnalysis.org -
Posted in Announcements, Crash Dump Analysis, Crash Dump Patterns, Crash Dumps for Dummies, Debugging, Minidump Analysis, Software Technical Support | No Comments »
Thursday, March 27th, 2008
Ceteris Paribus means “with other things [being] the same” (Latin) and when applied to software troubleshooting and debugging means equal environment and configuration. My favorite example is troubleshooting an issue using two Citrix CDF traces (ETW based): one is for the problem and another for the expected behavior. Say we have a terminal services connectivity problem where a published application doesn’t start on the one particular server in Citrix farm. Here Ceteris Paribus means that the application, connection method, configuration, user name, and so on, are all the same for both traces.
Looks like I have used Latin to obfuscate something obvious but surely many engineers forget it when facing complex issues. This equally applies to debugging as well.
- Dmitry Vostokov @ DumpAnalysis.org -
Posted in Debugging, Software Technical Support, Troubleshooting Methodology | No Comments »
Thursday, March 27th, 2008
Symbolless Analysis is another anti-pattern when an engineer either in a hurry or due to laziness doesn’t apply proper symbols and relies only on timestamps and module/offsets or trusts what WinDbg says and ignores symbol warnings. I usually apply symbols even in obvious cases and in hard ones strive to apply them until all possibilities are exhausted including search using PDBFinder.
Another weak variant is called Imageless Analysis when an engineer doesn’t specify proper Executable Image Search Path when it is necessary perhaps due to ignorance or just plain laziness again. Please see Minidump Analysis example for proper minidump analysis.
- Dmitry Vostokov @ DumpAnalysis.org -
Posted in AntiPatterns, Crash Dump Analysis, Crash Dump Patterns, Minidump Analysis, Software Technical Support | No Comments »
Tuesday, March 25th, 2008
Although the first volume has not been published yet (scheduled for 15th of April, 2008) the planning for the second volume has already begun. Preliminary information is:
- Title: Memory Dump Analysis Anthology, Volume 2
- Paperback: 512 pages (*)
- ISBN-13: 978-0-9558328-7-1
- Author: Dmitry Vostokov
- Publisher: Opentask (01 Oct 2008)
- Language: English
- Product Dimensions: 22.86 x 15.24
Hardcover version is also planned. PDF version will be available for download too.
(*) subject to change
- Dmitry Vostokov @ DumpAnalysis.org -
Posted in Announcements, Assembly Language, Books, Bugchecks Depicted, Crash Dump Analysis, Crash Dump Patterns, Crash Dumps for Dummies, Debugging, Fun with Crash Dumps, Hardware, Kernel Development, Memory Dump Analysis Jobs, Memory Visualization, Minidump Analysis, Science of Memory Dump Analysis, Security, Software Architecture, Software Technical Support, Stack Trace Collection, Tools, Troubleshooting Methodology, Vista, WinDbg Scripts, WinDbg Tips and Tricks, WinDbg for GDB Users, Windows Server 2008 | 1 Comment »
Thursday, March 20th, 2008
Why do we need yet another book about device drivers? There are couple of reasons here:
-
Old books are more about developing the narrow range of legacy drivers than troubleshooting and debugging them.
-
New books shift towards WDF and ignore legacy drivers.
-
Windows Internals book is too big and something lightweight is desperately needed.
-
No published driver books use UML as communication device and discuss driver developement as software factory.
-
Existing books mostly view device drivers as hardware device drivers.
I started collecting and organizing information about Windows drivers 2 years ago and published a few selected materials so you can get an approximate flavour of what is expected in the forthcoming book scheduled for the next year:
UML and Device Drivers
- Title: Windows Device Drivers: An Introduction
- Author: Dmitry Vostokov
- Paperback: 128 pages
- ISBN-13: 978-0-9558328-4-0
- Publisher: Opentask (15 Apr 2009)
- Language: English
- Product Dimensions: 22.86 x 15.24
- Dmitry Vostokov @ DumpAnalysis.org -
Posted in Announcements, Books, Debugging, Hardware, Kernel Development, Software Architecture, Software Technical Support, Tools, Vista, Windows Server 2008 | No Comments »
Thursday, March 20th, 2008
This is a forthcoming reference book for technical support and escalation engineers troubleshooting and debugging complex software issues. The book is also invaluable for software maintenance and development engineers debugging unmanaged, managed and native code.
- Title: Windows® Debugging Notebook: Essential Concepts, WinDbg Commands and Tools
- Author: Dmitry Vostokov
- Hardcover: 256 pages
- ISBN-13: 978-0-9558328-5-7
- Publisher: Opentask (1 September 2008)
- Language: English
- Product Dimensions: 22.86 x 15.24
- Dmitry Vostokov @ DumpAnalysis.org -
Posted in Announcements, Assembly Language, Books, Crash Dump Analysis, Crash Dumps for Dummies, Debugging, Kernel Development, Minidump Analysis, Software Technical Support, Tools, Vista, WinDbg Scripts, WinDbg Tips and Tricks, WinDbg for GDB Users, Windows Server 2008 | No Comments »
Wednesday, March 19th, 2008
This is a forthcoming book about .NET debugging seen in a wider context than .NET runtime environment (CLR). There is the whole new generation of .NET software developers, designers and architects thinking in terms of managed code and associated concepts. However CLR runs in unmanaged environment which finally interfaces with native code. Therefore understanding unmanaged and native code is vital for successful debugging of real customer problems. Preliminary information is:
- Title: Unmanaged Code: Escaping the Matrix of .NET
- Author: Dmitry Vostokov
- Paperback: 512 pages (*)
- ISBN-13: 978-0-9558328-6-4
- Publisher: Opentask (1 Feb 2009)
- Language: English
- Product Dimensions: 22.86 x 15.24
(*) subject to change
- Dmitry Vostokov @ DumpAnalysis.org -
Posted in .NET Debugging, Announcements, Books, Crash Dump Analysis, Debugging, Software Architecture, Software Technical Support | 4 Comments »
Tuesday, February 26th, 2008
Finally release dates are set for the following two books:
DebugWare: The Art and Craft of Writing Troubleshooting and Debugging Tools
- Author: Kapildev Ramlal, Dmitry Vostokov
- Paperback: 256 pages (*)
- ISBN-13: 978-0-9558328-3-3
- Publisher: Opentask (15 Nov 2008)
- Language: English
- Product Dimensions: 22.86 x 15.24
Windows® Crash Dump Analysis
- Author: Dmitry Vostokov
- Paperback: 512 pages (*)
- ISBN-13: 978-0-9558328-2-6
- Publisher: Opentask (01 Dec 2008)
- Language: English
- Product Dimensions: 22.86 x 15.24
The latter book will be shorter than planned initially and will contain references to Memory Dump Analysis Anthology, Volume I and Volume II.
(*) subject to change
- Dmitry Vostokov @ DumpAnalysis.org -
Posted in Announcements, Books, Crash Dump Analysis, Debugging, Software Architecture, Software Technical Support, Tools, Vista, Windows Server 2008 | No Comments »
Monday, February 18th, 2008
Comparing reference stack traces with the output of !process 0 ff command or just visually inspecting the long log and trying to spot anomalies is very difficult and largely based on personal experience with prior problem cases. A tool is needed and I’m currently writing the one. It will compare logs from problem memory dumps with reference stack traces and other information and automatically pinpoint any anomalies and highlight areas for more detailed manual inspection. This is similar to Kernel Memory Space Analyzer original intent but far more useful. Originally I thought about calling it WinDbg Log Analyzer but later decided to make it more general and extendable to other types of logs from different debuggers like GDB. Some people asked me the question: won’t a WinDbg debugger extension suffice? My answer was no - some companies cannot send complete, kernel and process memory dumps due to security considerations but they can send logs free from sensitive data as explained in my previous article:
Resolving security issues with crash dumps
Additionally I want it to be debugger independent at least in the second version and I want it to be web-based too and free from the choice of the hosting platform.
Stay tuned because the working prototype will be soon as a command line tool first. I personally need it for my day-to-day job. The latter always was my primary motivation to create various tools to automate or semi-automate data gathering and improve customer problem analysis.
The next version will have front-end GUI and I still haven’t decided yet whether to employ embedded HTML control like IE, RichEdit or revive my old text processor project. I’m inclined to choose the former due to endless possibilities with HTML and its platform independence. The choice of command line tool written in C++/STL will help to port it to FreeBSD/Linux/Solaris and adapt to other debuggers like GDB/ADB. The latter is my “wild fantasy” at the moment but its good to think towards other platforms that slowly increase their presence in my professional life
Any suggestions are very welcome especially if you have dealt with large debugger logs including not only backtraces but also various synchronization objects, module information, timing and I/O packet distribution.
- Dmitry Vostokov @ DumpAnalysis.org -
Posted in Announcements, Crash Dump Analysis, Crash Dump Patterns, Debugging, Security, Software Technical Support, Stack Trace Collection, Tools | 2 Comments »
Monday, February 11th, 2008
I started these new series to debunk widespread myths about software technical support. The first one is:
Technical support engineers can’t and don’t write code (myth). Technical support engineers do write code and sometimes fairly advanced one (fact).
There is a prevalent view of a technical support engineer spending all the time on the phone as a shield from introvert software engineers who hate customers. This is not true. There are usually several layers of support from very basic ones requiring only customer communication and foreign language skills to very advanced problem identification and troubleshooting skills that requires a thousand page knowledge from Windows Internals book. My point here is that advanced troubleshooting requires tools that sometimes don’t exist and this prompts support engineers to develop their own. Sometimes it is easy to query information from the customer environment and/or fix the problem on the spot by writing a tool or a script. And this is pure unconstrained development limited only by individual imagination, skills and complexity of the task.
The weak form of this myth is the view of a support engineer using only Visual Basic or its scripting variant.
What do you think about this? The idea of these series came from the following book that I’m reading at the moment:
Facts and Fallacies of Software Engineering (Agile Software Development)

- Dmitry Vostokov @ DumpAnalysis.org -
Posted in Books, Software Technical Support | No Comments »
Thursday, February 7th, 2008
It is very easy to become a publisher nowadays. Much easier than I thought. I registered myself as a publisher under the name of OpenTask which is my registered business name in Ireland. I also got the list of ISBN numbers and therefore can announce product details for the first volume of Memory Dump Analysis Anthology series:
Memory Dump Analysis Anthology, Volume 1
- Paperback: 720 pages (*)
- ISBN-13: 978-0-9558328-0-2
- Hardcover: 720 pages (*)
- ISBN-13: 978-0-9558328-1-9
- Author: Dmitry Vostokov
- Publisher: Opentask (15 Apr 2008)
- Language: English
- Product Dimensions: 22.86 x 15.24
(*) subject to change
PDF file will be available for download too.
- Dmitry Vostokov @ DumpAnalysis.org -
Posted in Announcements, Assembly Language, Books, Bugchecks Depicted, Crash Dump Analysis, Crash Dump Patterns, Crash Dumps for Dummies, Debugging, Fun with Crash Dumps, GDB for WinDbg Users, Hardware, Kernel Development, Memory Dump Analysis Jobs, Memory Visualization, Minidump Analysis, Science of Memory Dump Analysis, Security, Software Architecture, Software Technical Support, Stack Trace Collection, Tools, Troubleshooting Methodology, Vista, WinDbg Scripts, WinDbg Tips and Tricks, WinDbg for GDB Users, Windows Server 2008 | 4 Comments »
Thursday, January 31st, 2008
SDT (Structured Debugging and Troubleshooting) is procedural (action-based). Once we get the description of the problem we jump to actions:
- Ask this
- Ask that
- Do this
- Do that
- …
Whereas OODT is centered around objects (systems and customers are also objects):
-
Get objects from the problem description and problem environment
-
Interrogate them sending messages (could be an email at high levels :-)) like changing a registry key is a message to configuration management subsystem
- …
OODT depends on troubleshooting domain and therefore finally we finally come to DDDT.
- Dmitry Vostokov @ DumpAnalysis.org -
Posted in Debugging, Software Technical Support, Tools, Troubleshooting Methodology | No Comments »
Thursday, January 31st, 2008
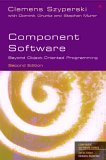
Component identification is one of the main goals of post-mortem memory dump analysis and troubleshooting process in general. Using the definition of components as units of deployment and 3rd-party composition taken from Clemens Szyperski’s seminal book discussing component software in general and COM, CORBA, Java and .NET in particular (highly recommended book)
Component Software: Beyond Object-Oriented Programming (2nd Edition)
I would say that CBDT is centered around component isolation and replacement.
- Dmitry Vostokov @ DumpAnalysis.org -
Posted in Books, Crash Dump Analysis, Debugging, Software Technical Support, Tools, Troubleshooting Methodology | No Comments »
Thursday, January 31st, 2008
OODT pronounced ”Oddity” is not a paradigm shift for support and software maintenance environments but a recognized way to solve problems using object-oriented techniques. In contrast to Structured Debugging and Troubleshooting methods (SDT) where engineers have sequence of questions and structure troubleshooting plans around them OODT is based on targeting specific objects, subsystems and systems (sending “messages” to them) and evaluating response and changes in their behaviour. I have to say more about it later after introducing CBDT (no easy pronunciation for it but any suggestions are welcome :-)).
Note: OODT doesn’t mean troubleshooting OO systems - it means applying OO techniques to troubleshooting
- Dmitry Vostokov @ DumpAnalysis.org -
Posted in Debugging, Software Technical Support, Tools, Troubleshooting Methodology | No Comments »
Sunday, January 20th, 2008
Finally I can pre-order this 1232 page 5th edition! Looking forward to seeing it in the post.
Windows® Internals: Including Windows Server 2008 and Windows Vista, Fifth Edition (PRO-Developer)

I read all previous editions as the part of my knowledge read ahead cache. Here is my short review of the previous 4th edition.
- Dmitry Vostokov @ DumpAnalysis.org -
Posted in Announcements, Books, Debugging, Software Architecture, Software Technical Support, Tools, Vista, Windows Server 2008 | 6 Comments »
Tuesday, January 15th, 2008
Recently became interested in causality, causal models and how they can be applied to software troubleshooting especially when we have various traces and logs. Looking at traces, system and application event logs and logs from other tools, technical support engineers see correlations between various events and build causal models that are used to trace symptoms back to their causes. They use prior knowledge, assumptions, informed guessing and event order to discern causal structure. Clearly event order in logs influences that so it is important to understand how we think in causal terms in order to learn about our biases.
Another important question from software engineering perspective is how to design tracing components to help technical support and software maintenance engineers build correct causal models of software issues. Just finished reading a book about causal modeling:
Review of Causal Models
- Dmitry Vostokov @ DumpAnalysis.org -
Posted in Debugging, Science of Memory Dump Analysis, Software Technical Support | No Comments »