Archive for the ‘Mathematics of Debugging’ Category
Friday, October 1st, 2010
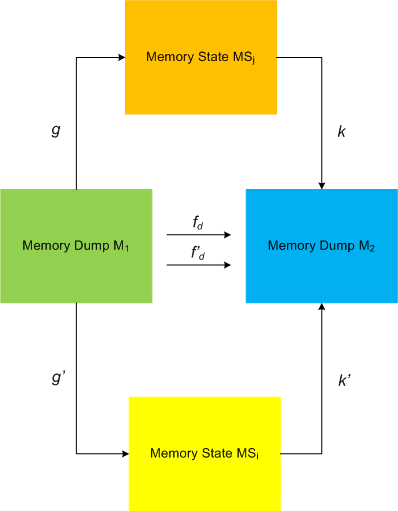
Now we propose the next group of general patterns related to memory regions (the terminology was partially influenced from topology). The first one we call Memory Region, for example:
1: kd> dp fffff88005875000 fffff88005875010

fffff880`05875000  039b5000`6e696268 00000000`00002000

fffff880`05875010  00000000`00000000
There are Open and Closed memory regions. We can extend the former ones in one or both directions:
1: kd> dp fffff88005875000-10 fffff88005875010+10

fffff880`05874ff0  6ab90c4f`039ba1b8 039b8050`fffffff8

fffff880`05875000  039b5000`6e696268 00000000`00002000

fffff880`05875010  00000000`00000000 00000000`00000000

fffff880`05875020  00000294`ffffffd0
The closed regions cannot be read past its boundary, like this kernel stack region [fffff880`05874000 fffff8800587d000):
1: kd> dp fffff88005874000-30

fffff880`05873fd0  ????????`???????? ????????`????????

fffff880`05873fe0  ????????`???????? ????????`????????

fffff880`05873ff0  ????????`???????? ????????`????????

fffff880`05874000  039ba000`6e696268 00000000`00001000

fffff880`05874010  00000000`00000000 00000000`00000000

fffff880`05874020  00206b6e`ffffffa8 01cae7bd`b8aca323

fffff880`05874030  039b6698`00000000 00000000`00000001

fffff880`05874040  ffffffff`039bafe8 039b6710`00000004
1: kd> dp fffff8800587d000-30

fffff880`0587cfd0  00000000`00000000 00000000`00000000

fffff880`0587cfe0  00000000`00000000 00000000`00000000

fffff880`0587cff0  00000000`00000000 00000000`00000000

fffff880`0587d000  ????????`???????? ????????`????????

fffff880`0587d010  ????????`???????? ????????`????????

fffff880`0587d020  ????????`???????? ????????`????????

fffff880`0587d030  ????????`???????? ????????`????????

fffff880`0587d040  ????????`???????? ????????`????????
- Dmitry Vostokov @ DumpAnalysis.org + TraceAnalysis.org -
Posted in Crash Dump Analysis, Debugging, Mathematics of Debugging, Memoretics, Memory Analysis Forensics and Intelligence, Structural Memory Patterns | 1 Comment »
Sunday, April 18th, 2010
OpenTask to offer first 3 volumes of Memory Dump Analysis Anthology in one set:


The set is available exclusively from OpenTask e-Commerce web site starting from June. Individual volumes are also available from Amazon, Barnes & Noble and other bookstores worldwide.
Product information:
- Title: Modern Memory Dump and Software Trace Analysis: Volumes 1-3
- Author: Dmitry Vostokov
- Language: English
- Product Dimensions: 22.86 x 15.24
- Paperback: 1600 pages
- Publisher: Opentask (31 May 2010)
- ISBN-13: 978-1-906717-99-5
Information about individual volumes:
- Dmitry Vostokov @ DumpAnalysis.org + TraceAnalysis.org -
Posted in .NET Debugging, Aesthetics of Memory Dumps, Announcements, AntiPatterns, Art, Assembly Language, Books, Bugchecks Depicted, C and C++, CDA Pattern Classification, CDF Analysis Tips and Tricks, Categorical Debugging, Certification, Citrix, Code Reading, Common Mistakes, Computational Ghosts and Bug Hauntings, Computer Science, Countefactual Debugging, Crash Analysis Report Environment (CARE), Crash Dump Analysis, Crash Dump Patterns, Crash Dumps for Dummies, Data Recovery, DebugWare Patterns, Debugging, Debugging Methodology, Debugging Slang, Deep Down C++, Dictionary of Debugging, Dr. Watson, Education and Research, Escalation Engineering, Fun with Crash Dumps, Futuristic Memory Dump Analysis, GDB for WinDbg Users, Hardware, History, Horrors of Computation, Hyper-V, Intelligent Memory Movement, Kernel Development, Laws of Troubleshooting and Debugging, Mathematics of Debugging, Memiotics (Memory Semiotics), Memoidealism, Memoretics, Memory Analysis Culture, Memory Analysis Forensics and Intelligence, Memory Auralization, Memory Dump Analysis Jobs, Memory Religion (Memorianity), Memory Space Art, Memory Space Music, Memory Systems Language, Memory Visualization, Memuonics, Minidump Analysis, Multithreading, Music for Debugging, Music of Computation, New Acronyms, New Words, Occult Debugging, Philosophy, Psi-computation, Publishing, Science of Memory Dump Analysis, Science of Software Tracing, Security, Software Architecture, Software Defect Construction, Software Engineering, Software Generalist, Software Maintenance Institute, Software Narratology, Software Technical Support, Software Trace Analysis, Software Trace Visualization, Software Tracing for Dummies, Software Victimology, Stack Trace Collection, Testing, Tools, Trace Analysis Patterns, Training and Seminars, Troubleshooting Methodology, Victimware, Virtualization, Vista, Visual Dump Analysis, WinDbg Scripts, WinDbg Tips and Tricks, WinDbg for GDB Users, Windows 7, Windows Server 2008, Windows System Administration | No Comments »
Monday, April 5th, 2010
I’m very pleased to announce that the Korean edition is available:

The book can be found on:
- Dmitry Vostokov @ DumpAnalysis.org + TraceAnalysis.org -
Posted in Announcements, AntiPatterns, Assembly Language, Books, Books (Korean), C and C++, Computer Science, Crash Dump Analysis, Crash Dump Patterns, Crash Dumps for Dummies, Debugging, Dr. Watson, Escalation Engineering, Fun with Crash Dumps, GDB for WinDbg Users, Hardware, Kernel Development, Mathematics of Debugging, Memiotics (Memory Semiotics), Memoretics, Memory Space Music, Memory Visualization, Minidump Analysis, Multithreading, Publishing, Science of Memory Dump Analysis, Security, Software Architecture, Software Engineering, Software Technical Support, Testing, Tools, Troubleshooting Methodology, Virtualization, Vista, WinDbg Scripts, WinDbg Tips and Tricks, WinDbg for GDB Users, Windows Server 2008, Windows System Administration | No Comments »
Monday, March 22nd, 2010
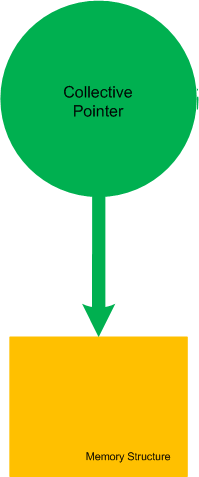
Let’s now introduce collective pointers or pointer cones. Suppose we have a set of pointers pointing to fields of some memory structure. This set of pointers could be another structure as well or just a collection of pointers that can be logically brought together:
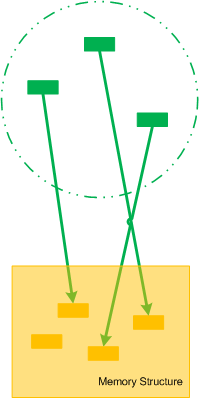
If we make the boundary opaque we can name such set of pointers as Collective Pointer (or Pointer Cone):
Another example is when we split the perception field of a pointer into disjoint collective pointers (the perception field as a whole is already a trivial collective pointer):

- Dmitry Vostokov @ DumpAnalysis.org + TraceAnalysis.org -
Posted in Categorical Debugging, Mathematics of Debugging, Memoretics, Science of Memory Dump Analysis | No Comments »
Thursday, February 11th, 2010
This is a revised, edited, cross-referenced and thematically organized volume of selected DumpAnalysis.org blog posts about crash dump analysis and debugging written in July 2009 - January 2010 for software engineers developing and maintaining products on Windows platforms, quality assurance engineers testing software on Windows platforms and technical support and escalation engineers dealing with complex software issues. The fourth volume features:
- 13 new crash dump analysis patterns
- 13 new pattern interaction case studies
- 10 new trace analysis patterns
- 6 new Debugware patterns and case study
- Workaround patterns
- Updated checklist
- Fully cross-referenced with Volume 1, Volume 2 and Volume 3
- New appendixes
Product information:
- Title: Memory Dump Analysis Anthology, Volume 4
- Author: Dmitry Vostokov
- Language: English
- Product Dimensions: 22.86 x 15.24
- Paperback: 410 pages
- Publisher: Opentask (30 March 2010)
- ISBN-13: 978-1-906717-86-5
- Hardcover: 410 pages
- Publisher: Opentask (30 April 2010)
- ISBN-13: 978-1-906717-87-2

Back cover features memory space art image: Internal Process Combustion.
- Dmitry Vostokov @ DumpAnalysis.org + TraceAnalysis.org -
Posted in .NET Debugging, Aesthetics of Memory Dumps, Announcements, AntiPatterns, Art, Assembly Language, Books, C and C++, CDA Pattern Classification, CDF Analysis Tips and Tricks, Categorical Debugging, Certification, Citrix, Code Reading, Common Mistakes, Computer Science, Countefactual Debugging, Crash Analysis Report Environment (CARE), Crash Dump Analysis, Crash Dump Patterns, Crash Dumps for Dummies, DebugWare Patterns, Debugging, Debugging Slang, Education and Research, Escalation Engineering, Fun with Crash Dumps, Games for Debugging, Hardware, Horrors of Computation, Hyper-V, Kernel Development, Laws of Troubleshooting and Debugging, Mathematics of Debugging, Memiotics (Memory Semiotics), Memoidealism, Memoretics, Memory Analysis Culture, Memory Analysis Forensics and Intelligence, Memory Dreams, Memory Dump Analysis Jobs, Memory Dumps in Movies, Memory Space Art, Memory Visualization, Memuonics, Minidump Analysis, Multithreading, Music for Debugging, New Acronyms, New Words, Opcodism, Philosophy, Physicalist Art, Publishing, Science Fiction, Science of Memory Dump Analysis, Science of Software Tracing, Security, Software Architecture, Software Defect Construction, Software Engineering, Software Generalist, Software Maintenance Institute, Software Narratology, Software Technical Support, Software Trace Analysis, Software Trace Visualization, Software Tracing for Dummies, Software Victimology, Stack Trace Collection, Testing, Tools, Trace Analysis Patterns, Training and Seminars, Troubleshooting Methodology, Victimware, Virtualization, Vista, Visual Dump Analysis, WinDbg Scripts, WinDbg Tips and Tricks, WinDbg for GDB Users, Windows 7, Windows Server 2008, Windows System Administration, Workaround Patterns | No Comments »
Tuesday, January 26th, 2010
In part 1 we defined MemP category and the operating field of a pointer as its link to a memory location it is pointing to. This operating field value can be in a different pseudo-memory plane if its value is outside memory bounds, for example, 8FFFFFF0 for a memory with the highest possible address 7FFFFFFF:

We define the closure of memory as the smallest MemP category that includes memory for operating fields of every pointer for the current memory snapshot. For example above, by adding another memory location that has a pointer value pointing back to the original memory region we have the following operating closure:
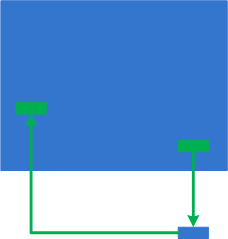
We can also add more memory as well:

- Dmitry Vostokov @ DumpAnalysis.org + TraceAnalysis.org -
Posted in Categorical Debugging, Mathematics of Debugging, Memoretics, Science of Memory Dump Analysis | No Comments »
Sunday, January 17th, 2010
Having considered computational threads as braided strings and after discerning several software trace analysis patterns (just the beginning) we can see formatted and tabulated software trace output in a new light and employ the “fabric of traces” and braid metaphors for an Adjoint Thread concept. This new concept was motivated by reading about Extended Phenotype (*) and extensive analysis of Citrix ETW-based CDF traces using CDFAnalyzer. The term Adjoint was borrowed from mathematics because the concept we discuss below resembles this metaphorical formula: (Thread A, B) = [A, Thread B]. Let me first illustrate adjoint threading using simplified trace tables. Consider this generalized software trace example (date and time column is omitted for visual clarity):
|
#
|
Source Dir
|
PID
|
TID
|
File Name
|
Function
|
Message
|
|
1
|
\src\subsystemA
|
2792
|
5676
|
file1.cpp
|
fooA
|
Message text…
|
|
2
|
\src\subsystemA
|
2792
|
5676
|
file1.cpp
|
fooA
|
Message text…
|
|
3
|
\src\subsystemA
|
2792
|
5676
|
file1.cpp
|
fooA
|
Message text…
|
|
4
|
\src\lib
|
2792
|
5680
|
file2.cpp
|
barA
|
Message text…
|
|
5
|
\src\subsystemA
|
2792
|
5680
|
file1.cpp
|
fooA
|
Message text…
|
|
6
|
\src\subsystemA
|
2792
|
5676
|
file1.cpp
|
fooA
|
Message text…
|
|
7
|
\src\lib
|
2792
|
5680
|
file2.cpp
|
fooA
|
Message text…
|
|
8
|
\src\lib
|
2792
|
5680
|
file2.cpp
|
fooA
|
Message text…
|
|
9
|
\src\subsystemB
|
2792
|
3912
|
file3.cpp
|
barB
|
Message text…
|
|
10
|
\src\subsystemB
|
2792
|
3912
|
file3.cpp
|
barB
|
Message text…
|
|
11
|
\src\subsystemB
|
2792
|
3912
|
file3.cpp
|
barB
|
Message text…
|
|
12
|
\src\subsystemB
|
2792
|
3912
|
file3.cpp
|
barB
|
Message text…
|
|
13
|
\src\subsystemB
|
2792
|
3912
|
file3.cpp
|
barB
|
Message text…
|
|
14
|
\src\subsystemB
|
2792
|
3912
|
file3.cpp
|
barB
|
Message text…
|
|
15
|
\src\subsystemB
|
2792
|
2992
|
file4.cpp
|
fooB
|
Message text…
|
|
16
|
\src\subsystemB
|
2792
|
3008
|
file4.cpp
|
fooB
|
Message text…
|
|
…
|
…
|
…
|
…
|
…
|
…
|
…
|
We see several threads in a process PID 2792. In CDFAnalyzer we can filter trace messages that belong to any column and if we filter by TID we get a view of any Thread of Activity. However, each thread can “run” through any source directory, file name or function. If a function belongs to a library multiple threads would access it. This source location (can be considered as a subsystem), file or function view of activity is called an Adjoint Thread. For example, if we filter only subsystemA column in the trace above we get this table:
|
#
|
Source Dir
|
PID
|
TID
|
File Name
|
Function
|
Message
|
|
1
|
\src\subsystemA
|
2792
|
5676
|
file1.cpp
|
fooA
|
Message …
|
|
2
|
\src\subsystemA
|
2792
|
5676
|
file1.cpp
|
fooA
|
Message …
|
|
3
|
\src\subsystemA
|
2792
|
5676
|
file1.cpp
|
fooA
|
Message …
|
|
5
|
\src\subsystemA
|
2792
|
5680
|
file1.cpp
|
fooA
|
Message …
|
|
6
|
\src\subsystemA
|
2792
|
5676
|
file1.cpp
|
fooA
|
Message …
|
|
7005
|
\src\subsystemA
|
2792
|
5664
|
file1.cpp
|
fooA
|
Message …
|
|
10198
|
\src\subsystemA
|
2792
|
5664
|
file1.cpp
|
fooA
|
Message …
|
|
10364
|
\src\subsystemA
|
2792
|
5664
|
file1.cpp
|
fooA
|
Message …
|
|
10417
|
\src\subsystemA
|
2792
|
5664
|
file1.cpp
|
fooA
|
Message …
|
|
10420
|
\src\subsystemA
|
2792
|
5676
|
file1.cpp
|
fooA
|
Message …
|
|
10422
|
\src\subsystemA
|
2792
|
5680
|
file1.cpp
|
fooA
|
Message …
|
|
10587
|
\src\subsystemA
|
2792
|
5664
|
file1.cpp
|
fooA
|
Message …
|
|
10767
|
\src\subsystemA
|
2792
|
5680
|
file1.cpp
|
fooA
|
Message …
|
|
11126
|
\src\subsystemA
|
2792
|
5668
|
file1.cpp
|
fooA
|
Message …
|
|
11131
|
\src\subsystemA
|
2792
|
5680
|
file1.cpp
|
fooA
|
Message …
|
|
11398
|
\src\subsystemA
|
2792
|
5676
|
file1.cpp
|
fooA
|
Message …
|
|
11501
|
\src\subsystemA
|
2792
|
5668
|
file1.cpp
|
fooA
|
Message …
|
|
11507
|
\src\subsystemA
|
2792
|
5668
|
file1.cpp
|
fooA
|
Message …
|
|
11509
|
\src\subsystemA
|
2792
|
5664
|
file1.cpp
|
fooA
|
Message …
|
|
11513
|
\src\subsystemA
|
2792
|
5680
|
file1.cpp
|
fooA
|
Message …
|
|
11524
|
\src\subsystemA
|
2792
|
5668
|
file1.cpp
|
fooA
|
Message …
|
|
…
|
…
|
…
|
…
|
…
|
…
|
…
|
We can graphically view subsystemA as a braid string that “permeates the fabric of threads”:
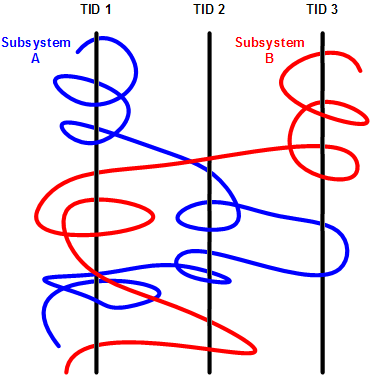
We can get many different braids by changing filters, hence multibraiding. Here is another example of a driver source file view initially permeating 2 process contexts and 4 threads:
|
#
|
Source Dir
|
PID
|
TID
|
File Name
|
Function
|
Message
|
|
41
|
\src\sys\driver
|
3636
|
3848
|
entry.c
|
DriverEntry
|
IOCTL …
|
|
80
|
\src\sys\driver
|
3636
|
3896
|
entry.c
|
DriverEntry
|
IOCTL …
|
|
99
|
\src\sys\driver
|
3636
|
3896
|
entry.c
|
DriverEntry
|
IOCTL …
|
|
102
|
\src\sys\driver
|
3636
|
3896
|
entry.c
|
DriverEntry
|
IOCTL …
|
|
179
|
\src\sys\driver
|
3636
|
3896
|
entry.c
|
DriverEntry
|
IOCTL …
|
|
180
|
\src\sys\driver
|
3636
|
3896
|
entry.c
|
DriverEntry
|
IOCTL …
|
|
311
|
\src\sys\driver
|
3636
|
3896
|
entry.c
|
DriverEntry
|
IOCTL …
|
|
447
|
\src\sys\driver
|
3636
|
3896
|
entry.c
|
DriverEntry
|
IOCTL …
|
|
448
|
\src\sys\driver
|
3636
|
3896
|
entry.c
|
DriverEntry
|
IOCTL …
|
|
457
|
\src\sys\driver
|
2792
|
5108
|
entry.c
|
DriverEntry
|
IOCTL …
|
|
608
|
\src\sys\driver
|
3636
|
3896
|
entry.c
|
DriverEntry
|
IOCTL …
|
|
614
|
\src\sys\driver
|
3636
|
3896
|
entry.c
|
DriverEntry
|
IOCTL …
|
|
655
|
\src\sys\driver
|
3636
|
3896
|
entry.c
|
DriverEntry
|
IOCTL …
|
|
675
|
\src\sys\driver
|
3636
|
3896
|
entry.c
|
DriverEntry
|
IOCTL …
|
|
678
|
\src\sys\driver
|
3636
|
3896
|
entry.c
|
DriverEntry
|
IOCTL …
|
|
680
|
\src\sys\driver
|
3636
|
3896
|
entry.c
|
DriverEntry
|
IOCTL …
|
|
681
|
\src\sys\driver
|
3636
|
3896
|
entry.c
|
DriverEntry
|
IOCTL …
|
|
1145
|
\src\sys\driver
|
3636
|
4960
|
entry.c
|
DriverEntry
|
IOCTL …
|
|
1153
|
\src\sys\driver
|
3636
|
4960
|
entry.c
|
DriverEntry
|
IOCTL …
|
|
1154
|
\src\sys\driver
|
3636
|
4960
|
entry.c
|
DriverEntry
|
IOCTL …
|
|
…
|
…
|
…
|
…
|
…
|
…
|
…
|
(*) A bit of digression. Looks like biology keeps giving insights into software, there is even a software phenotype metaphor albeit a bit restricted to code, I just thought that we need also an Extended Software Phenotype.
- Dmitry Vostokov @ DumpAnalysis.org + TraceAnalysis.org -
Posted in Citrix, Computer Science, Debugging, Mathematics of Debugging, Multithreading, New Words, Science of Software Tracing, Software Trace Analysis, Software Trace Visualization, Trace Analysis Patterns | 2 Comments »
Friday, January 8th, 2010
I started applying category theory (as an alternative to traditional set-theoretic approach of memory bits) to memory dump analysis, debugging and software trace analysis in parallel to my studies of that branch of mathematics and reading the book Memory Evolutive Systems . In addition to complex systems modelled in the latter book I apply evolutive systems approach to computer memory. Here is a picture illustrating MemD category of memory dumps (snapshots) as category objects and category arrows as different ways in arriving at the same memory picture:
This category definitely applies to software traces as well if we consider every individual trace message or statement as a minidump. We currently consider software trace category MemT as a subcategory of MemD.
Configuration category of a computer memory dump represents its memory internals at an instant t (ideal memory dumps) or at a time interval T: components and links, pointers, wait chains, causal relations, data flows, … .
Pointers and their links are also objects and arrows to form a category, called MemP(tr). The following picture illustrates it with the last pointer shown as a dereference fixpoint:
The perception field of a pointer is a category of all links to its memory location:
However, the operating field of a pointer is its link to a memory location it is pointing to.
- Dmitry Vostokov @ DumpAnalysis.org -
Posted in Categorical Debugging, Mathematics of Debugging, Memoretics, Memory Visualization, Philosophy, Science of Memory Dump Analysis, Science of Software Tracing | 3 Comments »
Sunday, December 20th, 2009
“Memory dumps are facts.”
I’m very excited to announce that Volume 3 is available in paperback, hardcover and digital editions:
Memory Dump Analysis Anthology, Volume 3
Table of Contents
In two weeks paperback edition should also appear on Amazon and other bookstores. Amazon hardcover edition is planned to be available in January 2010.
The amount of information was so voluminous that I had to split the originally planned volume into two. Volume 4 should appear by the middle of February together with Color Supplement for Volumes 1-4.
- Dmitry Vostokov @ DumpAnalysis.org -
Posted in .NET Debugging, Aesthetics of Memory Dumps, Announcements, AntiPatterns, Art, Assembly Language, Books, Bugtations, C and C++, CDA Pattern Classification, CDF Analysis Tips and Tricks, Certification, Citrix, Code Reading, Common Mistakes, Computer Science, Crash Dump Analysis, Crash Dump Patterns, Crash Dumps for Dummies, DebugWare Patterns, Debugging, Debugging Slang, Deep Down C++, Education and Research, Escalation Engineering, Fun with Crash Dumps, Hardware, Horrors of Computation, Kernel Development, Mathematics of Debugging, Memiotics (Memory Semiotics), Memoidealism, Memoretics, Memory Analysis Culture, Memory Analysis Forensics and Intelligence, Memory Space Art, Memory Visualization, Minidump Analysis, Multithreading, Philosophy, Poetry, Publishing, Science of Memory Dump Analysis, Science of Software Tracing, Security, Software Architecture, Software Defect Construction, Software Engineering, Software Narratology, Software Technical Support, Software Trace Analysis, Software Trace Visualization, Software Tracing for Dummies, Software Victimology, Stack Trace Collection, Testing, Tools, Trace Analysis Patterns, Training and Seminars, Troubleshooting Methodology, Victimware, Virtualization, Vista, Visual Dump Analysis, WinDbg Scripts, WinDbg Tips and Tricks, WinDbg for GDB Users, Windows 7, Windows Server 2008, Windows System Administration | 1 Comment »
Wednesday, November 11th, 2009
A nibble is a (0,1)-matrix, a byte is a cubic 0,1-lattice and the next cubic byte-boundary 0,1-lattice represents a 64-bit qword:

This is what I call a natural memory representation as memory building blocks or qubic memory (do not mistaken it with qubit memory). This elevates bytes and 64-bit quadruple words as natural addresses and shows that 32-bit addresses are unnatural.
This also allows to us to visualize certain overlapped memory patterns in dump files (same vertice, edge or side).
- Dmitry Vostokov @ DumpAnalysis.org -
Posted in Computer Science, Mathematics of Debugging, Memoretics, Memory Visualization, New Words, Science of Memory Dump Analysis | 2 Comments »
Saturday, September 26th, 2009
This is a revised, edited, cross-referenced and thematically organized volume of selected DumpAnalysis.org blog posts about crash dump analysis and debugging written in October 2008 - June 2009 for software engineers developing and maintaining products on Windows platforms, quality assurance engineers testing software on Windows platforms and technical support and escalation engineers dealing with complex software issues. The third volume features:
- 15 new crash dump analysis patterns
- 29 new pattern interaction case studies
- Trace analysis patterns
- Updated checklist
- Fully cross-referenced with Volume 1 and Volume 2
- New appendixes
Product information:
- Title: Memory Dump Analysis Anthology, Volume 3
- Author: Dmitry Vostokov
- Language: English
- Product Dimensions: 22.86 x 15.24
- Paperback: 404 pages
- Publisher: Opentask (20 December 2009)
- ISBN-13: 978-1-906717-43-8
- Hardcover: 404 pages
- Publisher: Opentask (30 January 2010)
- ISBN-13: 978-1-906717-44-5

Back cover features 3D computer memory visualization image.
- Dmitry Vostokov @ DumpAnalysis.org -
Posted in Announcements, AntiPatterns, Art, Assembly Language, Books, C and C++, CDF Analysis Tips and Tricks, Certification, Citrix, Code Reading, Common Mistakes, Computational Ghosts and Bug Hauntings, Computer Science, Countefactual Debugging, Crash Dump Analysis, Crash Dump Patterns, Crash Dumps for Dummies, DebugWare Patterns, Debugging, Debugging Slang, Deep Down C++, Education and Research, Escalation Engineering, Fun with Crash Dumps, Futuristic Memory Dump Analysis, Games for Debugging, Hardware, Horrors of Computation, Hyper-V, Intelligent Memory Movement, Kernel Development, Mathematics of Debugging, Memiotics (Memory Semiotics), Memoidealism, Memoretics, Memory Analysis Culture, Memory Analysis Forensics and Intelligence, Memory Dreams, Memory Dump Analysis Jobs, Memory Space Music, Memory Visualization, Memuonics, Minidump Analysis, Multithreading, Music for Debugging, New Acronyms, New Words, Occult Debugging, Philosophy, Poetry, Psi-computation, Publishing, Science of Memory Dump Analysis, Science of Software Tracing, Security, Software Architecture, Software Defect Construction, Software Engineering, Software Generalist, Software Narratology, Software Technical Support, Software Trace Analysis, Software Tracing for Dummies, Testing, Tools, Trace Analysis Patterns, Training and Seminars, Troubleshooting Methodology, Virtualization, Vista, Visual Dump Analysis, WinDbg Scripts, WinDbg Tips and Tricks, WinDbg for GDB Users, Windows 7, Windows Server 2008, Windows System Administration | No Comments »
Sunday, August 9th, 2009
Last week I was comparing the existing collection of memory dump analysis patterns to the collection of trace analysis patterns (in formation) in the search of isomorphism (or more correctly, general morphism) similar to Missing Component pattern. It is not a coincidence that such pattern pairs can be formed. For example, it is possible to discern deadlocks from both crash dumps and software traces (if appropriate information is available there). Fundamentally, it is implied by the definition of a software trace as some sort of a memory dump. And we can see traces in memory dumps too, for example, Execution Residue pattern. Because raw stack data resides in stack pages and in contemporary operating systems they are created from zero pages (metaphorically, out of the void) we can say that stack regions of threads are sorted by their creation time, for example, in this process user memory dump:
0:017> !runaway 4

 Elapsed Time

  Thread       Time

   0:49c       0 days 5:16:31.076

   4:4d8       0 days 5:16:30.967

   3:4d0       0 days 5:16:30.967

   2:4cc       0 days 5:16:30.967

   1:4c8       0 days 5:16:30.967

   5:4e8       0 days 5:16:30.936

   6:b6c       0 days 5:16:15.695

   7:b70       0 days 5:16:15.679

   9:b88       0 days 5:16:15.586

   8:b84       0 days 5:16:15.586

  11:348       0 days 5:16:12.934

  10:bfc       0 days 5:16:12.934

  12:1200      0 days 5:15:16.528

  15:1298      0 days 5:15:15.220

  14:1290      0 days 5:15:15.220

  13:128c      0 days 5:15:15.220

  17:12e4      0 days 5:15:13.257

  16:12dc      0 days 5:15:13.257

  18:12ec      0 days 5:15:13.117

  20:12f4      0 days 5:15:13.085

  19:12f0      0 days 5:15:13.085

  21:17a0      0 days 5:13:16.321

  22:1628      0 days 5:13:15.729

  24:1778      0 days 1:35:50.773

  23:17ec      0 days 1:35:50.773

  25:1570      0 days 1:27:54.190

  26:1724      0 days 1:27:10.151

  27:1490      0 days 0:05:46.732

  28:1950      0 days 0:02:28.153

  29:19b4      0 days 0:00:58.108

  30:177c      0 days 0:00:38.358

  31:1798      0 days 0:00:23.351

  32:1a7c      0 days 0:00:08.343
If we have complete memory dumps we can also account for other processes and their elapsed time. Within stack pages we have partial stack traces but do not have exact timing information between them except for stack frames from the current frozen thread stack trace or, if we are lucky, from a partial stack trace from the past execution. However, the timing between frames from different stacks is undefined and we can only guess it from higher level considerations like semantics of procedure calls and other information.
These considerations and the notion of a poset (partially ordered set) let me thinking about memory dumps as posets. I even created my interpretation of POSET abbreviation for this occasion:
POSET
Partially Ordered Software Execution Trace
- Dmitry Vostokov @ DumpAnalysis.org -
Posted in Crash Dump Analysis, Crash Dump Patterns, Debugging, Mathematics of Debugging, New Acronyms, Science of Memory Dump Analysis, Science of Software Tracing, Software Trace Analysis | No Comments »
Sunday, July 12th, 2009
When complete memory dumps are huge (in case of x64 systems) we can dump specific processes and then force a kernel memory dump. Here we have a product of spaces similar to a fiber bundle illustrated by the following intuitive picture:
- Dmitry Vostokov @ DumpAnalysis.org -
Posted in Crash Dump Analysis, Debugging, Mathematics of Debugging, Science of Memory Dump Analysis | 1 Comment »
Tuesday, May 26th, 2009
What is a software trace from a mathematical standpoint? Before any software writes its trace data, it assembles it in memory. Therefore, generally, a software trace is a linear ordered sequence of specifically prepared memory fragments (trace statements):
(ts1, ts2, …, tsn)
where every tsi is a sequence of bits, bytes or other discrete units (see the definition of a memory dump):
(s11, s12, …, s1k, s21, s22, …, s2l, …, …, …, sn1, sn2, …, snm)
These trace statements can also be minidumps, selected regions of memory space. In the limit, if every tsi is a full memory snapshot saved at an instant of time (ti) we have a sequence of memory dumps:
(mt1, mt2, …, mtn)
Like with memory dump analysis we need symbol files to interpret saved memory fragments unless they were already interpreted during their construction. For example, traces written according ETW specification (Event Tracing for Windows), need TMF files (Trace Message Format) for their interpretation and viewing. Usually these files are generated from PDB files and therefore we have this correspondence:
memory dump file -> software trace file
PDB file -> TMF file
- Dmitry Vostokov @ TraceAnalysis.org -
Posted in Announcements, Debugging, Mathematics of Debugging, Science of Software Tracing, Software Trace Analysis | 5 Comments »
Sunday, February 15th, 2009
An idea struck me today while I was walking in People’s Park near Dun Laoghaire to formalize various effective intuitive notions in memory dump analysis, debugging and troubleshooting using topos theory. More on this later.
- Dmitry Vostokov @ DumpAnalysis.org -
Posted in Crash Dump Analysis, Debugging, Mathematics of Debugging, Science of Memory Dump Analysis | No Comments »
Tuesday, February 10th, 2009
Most of (if not all) debugging is arithmetical. Here I would like to introduce a new kind of debugging and troubleshooting approach that interprets observables as objects in their own spaces, for example, the possible space of various GUI forms. These spaces are not necessarily rational-valued spaces of simulation output or discreet arithmetic spaces of memory locations and values.
This geometrical approach applies modeling and systems theory to debugging and troubleshooting by treating them as mappings (or functions in the case of one-to-one or many-to-one mappings) from the space of all possible software environment states (SE) to the space(s) of observables. Here we have a family of mappings to different spaces:
fi: SE → SOi
Some observables can be found fixed like the list of components and the number of mappings can be reduced (i < j):
fj: SEa,b,c,d,… → SOj
In every system and its environment we have something fixed as parameters (a, b, c, d, …) and this could be the list of components as high level ”genotype” or it could be just specific code (low-level “genotype”), specific data or hardware specification. The whole family of mappings become parametrized. If we want, we can reduce mappings even more to treat them as many-valued (one-to-many or many-to-many) if several observables belong to the same kind of space.
Let me illustrate this by an analogy with modeling of a natural system. The system to be modeled is a falling ball together with its environment (Earth). The system obviously has some internal structure (abstract space of states, E) but we don’t know it. Fortunately, we can observe some measurable values like the ball position at any time (Q). So we have these mappings for balls with different masses:
fm: E → Q
We also find that for any individual ball its mass doesn’t change so we abstract it as a parameter:
f: Em → Q
The same modeling approach can be applied to a software system be it an application or a service running inside an operating system or a software system itself running inside a hardware. The case of pure software system abstracted from hardware is simple. In such a case SE space theoretically could be the space of abstract memory dumps. Practically we deal with the space of observables (universal memory dumps) that approximate SE and spaces of software “phenotypes”, observable behaviour, like distorted GUI, for example, or measured values of memory and CPU consumption or disk I/O throughput.
- Dmitry Vostokov @ DumpAnalysis.org -
Posted in Announcements, Crash Dump Analysis, Debugging, Mathematics of Debugging, Memory Visualization, Science of Memory Dump Analysis | No Comments »
Wednesday, October 24th, 2007
This is the first post in Science of Memory Dump Analysis category where I apply philosophy, systems theory, mathematics, physics and computer science ideas. It was inspired after reading Life Itself book written by Robert Rosen where computers are depicted as direct sums of states. As shown in that book, in the case of machines, their synthetic models (direct sums) are equivalent to analytic models (direct product of observables). Taking every single bit as an observable having its values in Z2 set {0, 1} we can make a definition of an ideal memory dump as a direct product or a direct sum of bits saved instantaneously at the given time:
∏i si = ∑i si
Of course, we can also consider bytes having 8 bits as observables having their values from Z256 set, etc.
In our case we can simply rewrite direct sum or product as the list of bits, bytes, words or double words, etc:
(…, si-1, si, si+1, …, sj-1, sj, sj+1, …)
According to Rosen we include hardware states (registers, for example) and partition memory into input, output states for particular computation and other states.
Saving a memory dump takes certain amount of time. Suppose that it takes 3 discrete time events (ticks). During the first tick we save memory up to (…, si-1, si) and that memory has some relationship to sj state. During the second tick sj state changes its value and during the 3rd tick we copy the rest of the memory (si+1, …, sj-1, sj, sj+1, …). Now we see that the final memory dump is inconsistent:
(…, si-1, si, si+1, …, sj-1, sj, sj+1, …)
I explained this earlier in plain words in Inconsistent Dump pattern. Therefore we might consider a real memory dump as a direct sum of disjoint memory areas Mt taken during some time interval (t0, …, tn)
M = ∑t Mt where Mt = ∑k stk or simply
M = ∑t ∑k stk
- Dmitry Vostokov @ DumpAnalysis.org -
Posted in Announcements, Books, Crash Dump Analysis, Crash Dump Patterns, Debugging, Mathematics, Mathematics of Debugging, Science of Memory Dump Analysis | 8 Comments »