Archive for the ‘Malware Analysis’ Category
Sunday, June 24th, 2012
Memory Dump Analysis Services organizes a free webinar on a unified malware and victimware analysis by using behavioral and structural patterns including a live memory dump analysis example.

Date: 2nd of July, 2012
Time: 17:00 (BST) 12:00 (EST) 09:00 (PST)
Duration: 60 minutes
Space is limited.
Reserve your Webinar seat now at:
https://www3.gotomeeting.com/register/332458406
- Dmitry Vostokov @ DumpAnalysis.org + TraceAnalysis.org -
Posted in Announcements, Malware Analysis, Memory Dump Analysis Services, Security, Software Behavior Patterns, Victimware, Webinars | No Comments »
Saturday, April 28th, 2012
Sometimes I hear voices saying that Linux, FreeBSD, and Mac OS X core dumps are uninteresting. This is not true. If you haven’t seen anything interesting there it just simply means you have only encountered a limited amount of abnormal software behaviour. The widespread usage of Windows OS means that most patterns have been diagnosed and described first and other OS are waiting their turn.
My goal is to have a pattern catalog with examples from different OS. For example, currently, all Mac OS X patterns I provide are just examples to existing Windows pattern names. All OS share the same structure and behavior, for example, structural memory analysis patterns and the same computational model. Although structural patterns are different from behavioral patterns I also plan to expand the structural list significantly especially in relation to forthcoming Windows malware analysis training. Regarding behavioral patterns it is possible to model and predict specific pattern examples for another OS by using already existing catalog.
- Dmitry Vostokov @ DumpAnalysis.org + TraceAnalysis.org -
Posted in Core Dump Analysis, Crash Dump Analysis, Crash Dump Patterns, Linux Crash Corner, Mac Crash Corner, Mac OS X, Malware Analysis, Malware Patterns, Pattern Models, Pattern Prediction, Pattern-Driven Debugging, Pattern-Driven Software Support, Software Behavior DNA, Software Behavior Patterns, Software Behavioral Genome, Software Diagnostics | No Comments »
Monday, April 9th, 2012
Memory Dump Analysis Services organizes a free Webinar on Unified Software Diagnostics (USD) and the new scalable cost-effective software support model called Pattern-Driven Software Support devised to address various shortcomings in existing tiered software support organizations. Examples cover Windows, Mac OS and Linux.

Date: 22nd of June, 2012
Time: 17:00 (BST) 12:00 (EST) 09:00 (PST)
Duration: 60 minutes
Space is limited.
Reserve your Webinar seat now at:
https://www3.gotomeeting.com/register/172771078
- Dmitry Vostokov @ DumpAnalysis.org + TraceAnalysis.org -
Posted in Announcements, Best Practices, Crash Dump Analysis, Crash Dump Patterns, Debugging, Debugging Methodology, Debugging Trends, Economics, Escalation Engineering, Event Tracing for Windows (ETW), JIT Crash Analysis, JIT Memory Space Analysis, Malware Analysis, Malware Patterns, Memoretics, Memory Analysis Forensics and Intelligence, Memory Dump Analysis Methodology, Memory Dump Analysis Services, New Acronyms, New Debugging School, Pattern Prediction, Pattern-Driven Debugging, Pattern-Driven Software Support, Root Cause Analysis, Science of Memory Dump Analysis, Science of Software Tracing, Software Behavior DNA, Software Behavior Patterns, Software Behavioral Genome, Software Diagnostics, Software Engineering, Software Narratology, Software Problem Description Patterns, Software Problem Solving, Software Support Patterns, Software Technical Support, Software Trace Analysis, Software Troubleshooting Patterns, Software Victimology, Software and Economics, Structural Memory Patterns, Structural Trace Patterns, Systems Thinking, Testing, Tools, Trace Analysis Patterns, Training and Seminars, Troubleshooting Methodology, UI Problem Analysis Patterns, Unified Debugging Patterns, Unified Software Diagnostics, Victimware, Webinars, Workaround Patterns | No Comments »
Monday, December 12th, 2011
More than 4 years passed since I provided a longer structuralist definition. Recently I came to recognize a pattern-driven iterative and incremental nature of memory and software trace analysis and post-construction software problem solving in general and therefore a one sentence definition became necessary:
“Recognition and interpretation of patterns of software behavior”
- Dmitry Vostokov @ DumpAnalysis.org + TraceAnalysis.org -
Posted in Announcements, Crash Dump Analysis, Crash Dump Patterns, Malware Analysis, Malware Patterns, Memiotics (Memory Semiotics), Memoretics, Memory Analysis Forensics and Intelligence, Science of Memory Dump Analysis, Science of Software Tracing, Software Behavior Patterns, Software Narratology, Software Problem Solving, Software Trace Analysis, Structural Memory Patterns, Structural Trace Patterns, Trace Analysis Patterns, Victimware | No Comments »
Wednesday, September 21st, 2011
Memoretics promotes pattern-driven memory dump and software trace analysis which has many uses but not limited to:
- Software and site reliability
- Software Debugging
- QA and Software Testing
- Computer Security
- Software Troubleshooting
- Malware Research and Analysis
- Tools as a Service (TaaS)
- Supportability
- Software Diagnostics

- Dmitry Vostokov @ DumpAnalysis.org + TraceAnalysis.org -
Posted in Cloud Memory Dump Analysis, Computer Forensics, Crash Dump Analysis, Crash Dump Patterns, DebugWare Patterns, Debugging, Debugging Trends, Escalation Engineering, Malware Analysis, Malware Patterns, Memiotics (Memory Semiotics), Memoretics, Memory Analysis Forensics and Intelligence, Metadefect Template Library, Metamalware, Pattern Models, Pattern Prediction, Reverse Engineering, Root Cause Analysis, Science of Memory Dump Analysis, Science of Software Tracing, Security, Software Behavior DNA, Software Behavior Patterns, Software Behavioral Genome, Software Defect Construction, Software Engineering, Software Generalist, Software Narratology, Software Support Patterns, Software Technical Support, Software Trace Analysis, Software Troubleshooting Patterns, Structural Memory Patterns, Structural Trace Patterns, Systems Thinking, Testing, Tools, Trace Analysis Patterns, Troubleshooting Methodology, UI Problem Analysis Patterns, Unified Debugging Patterns, Victimware, Windows System Administration, Workaround Patterns | No Comments »
Wednesday, September 21st, 2011
Memoretics as a science of memory snapshots borrows many ideas from the following disciplines (the list is not exhaustive):
- Troubleshooting and Debugging
- Intelligence Analysis
- Critical Thinking
- Forensics
- Linguistics
- Archaeology
- Psychoanalysis
- History
- Mathematics: Sets and Categories
- Literary Criticism and Narratology
It also contributes many ideas back. The following diagram depicts such an interaction:

- Dmitry Vostokov @ DumpAnalysis.org + TraceAnalysis.org -
Posted in Archaeology of Computer Memory, Categorical Debugging, Computer Forensics, Computer Science, Countefactual Debugging, Crash Dump Analysis, Crash Dump De-analysis, Crash Dump Patterns, Debugging, Debugging Methodology, Dublin School of Security, Education and Research, Escalation Engineering, General Memory Analysis, Generative Debugging, Hermeneutics of Memory Dumps and Traces, History, Intelligence Analysis Patterns, M->analysis, Malware Analysis, Malware Patterns, Mathematics of Debugging, Memiotics (Memory Semiotics), Memoretics, Memory Analysis Forensics and Intelligence, Memory Dump Analysis and History, Memory Systems Language, Memory Visualization, Metadefect Template Library, Metamalware, New Debugging School, Paleo-debugging, Pattern Models, Pattern Prediction, Psychoanalysis of Software Maintenance and Support, Psychology, Reverse Engineering, Root Cause Analysis, Science of Memory Dump Analysis, Science of Software Tracing, Security, Software Architecture, Software Behavior DNA, Software Behavior Patterns, Software Behavioral Genome, Software Chorography, Software Chorology, Software Defect Construction, Software Engineering, Software Narratology, Software Technical Support, Software Trace Analysis, Software Trace Analysis and History, Software Trace Deconstruction, Software Trace Linguistics, Software Trace Reading, Software Trace Visualization, Software Tracing Implementation Patterns, Software Troubleshooting Patterns, Software Victimology, Software and History, Structural Memory Analysis and Social Sciences, Structural Memory Patterns, Structural Trace Patterns, Systems Thinking, Testing, Tools, Trace Analysis Patterns, Troubleshooting Methodology, UI Problem Analysis Patterns, Unified Debugging Patterns, Victimware, Virtualization, Visual Dump Analysis, Workaround Patterns | No Comments »
Monday, September 12th, 2011
Just noticed this book and pre-ordered it:
Practical Malware Analysis: The Hands-On Guide to Dissecting Malicious Software

I like the cover picture - I recently bought a Dell Alienware laptop just to do malware and victimware analysis 
- Dmitry Vostokov @ DumpAnalysis.org + TraceAnalysis.org -
Posted in Books, Malware Analysis, Victimware | 3 Comments »
Friday, June 3rd, 2011
Finally on the parallels between memory dump and software trace analysis and intelligence (Memoretics is a discipline that studies computer memory snapshots and their evolution in time):
Memoretics ”opens a unique window on” software “affairs”.
John H. Hedley, The Challenges of Intelligence Analysis, Strategic Intelligence, Volume 1
- Dmitry Vostokov @ DumpAnalysis.org + TraceAnalysis.org -
Posted in Bugtations, Crash Dump Analysis, Cyber Warfare, General Memory Analysis, Malware Analysis, Memory Analysis Forensics and Intelligence | No Comments »
Thursday, May 5th, 2011
This is a forthcoming virtual event to learn analysis of blockages, delays, obstructions, preventions, and stoppages in victimware suffering from software defects and malware. Additional information on how to join will be available soon on the main portal page:
http://www.dumpanalysis.org/stoppages2011
- Dmitry Vostokov @ DumpAnalysis.org + TraceAnalysis.org -
Posted in Announcements, Crash Dump Analysis, Debugging, Malware Analysis, Software Trace Analysis, StopPages Conferences, Victimware | No Comments »
Sunday, May 1st, 2011
To model software behavior at application and system levels, test generative debugging scenarious and construct software defects using metaprogramming I started working on MdTL (Metadefect Template Library). Its consists of C++ templates for structural and behavioral patterns. The simplest examples include Threads<Spike> and Spike<Thread>. The template classes can be more complex, of course, utilizing the full power of C++, STL, and existing libraries like Boost. The unique and novel feature of this library is the inclusion of dual classes of behaviour such as Leak<>, Deadlock<>, Overflow<>, Residue<>, Exception<>, Contention<>, etc. parameterized by various structural memory classes like Process<>, Thread<>, Heap<>, Stack<>, Region<>, Buffer<>, etc. MdTL also includes classes to model software tracing and this will be used for simultaneous software trace and memory dump analysis case study in the forthcoming presentation. I also plan to extend this metaprogramming approach in the future to model malware analysis patterns by introducing Metamalware Template Library (MmTL).
Forthcoming parts will introduce template classes and examples.
- Dmitry Vostokov @ DumpAnalysis.org + TraceAnalysis.org -
Posted in C and C++, Crash Dump Patterns, Debugging, Generative Debugging, Malware Analysis, Malware Patterns, Metadefect Template Library, Metamalware, New Acronyms, Software Behavior Patterns, Software Defect Construction, Structural Memory Patterns, Structural Trace Patterns, Tools, Trace Analysis Patterns, Victimware | No Comments »
Tuesday, April 26th, 2011
Jobs page on Memory Dump, Software Trace, Debugging and Malware Analysis Portal now accepts company job ads related to security research, computer forensics, reverse engineering, and malware analysis in addition to debugging, software defect research, crash / core / memory dump and software trace analysis.
http://www.dumpanalysis.org/jobs
- Dmitry Vostokov @ DumpAnalysis.org + TraceAnalysis.org -
Posted in Announcements, Computer Forensics, Cyber Warfare, Malware Analysis, Memory Dump Analysis Jobs, Reverse Engineering, Security | No Comments »
Sunday, April 17th, 2011
I’m pleased to announce that MDAA, Volume 5 is available in PDF format:
www.dumpanalysis.org/Memory+Dump+Analysis+Anthology+Volume+5
It features:
- 25 new crash dump analysis patterns
- 11 new pattern interaction case studies (including software tracing)
- 16 new trace analysis patterns
- 7 structural memory patterns
- 4 modeling case studies for memory dump analysis patterns
- Discussion of 3 common analysis mistakes
- Malware analysis case study
- Computer independent architecture of crash analysis report service
- Expanded coverage of software narratology
- Metaphysical and theological implications of memory dump worldview
- More pictures of memory space and physicalist art
- Classification of memory visualization tools
- Memory visualization case studies
- Close reading of the stories of Sherlock Holmes: Dr. Watson’s observational patterns
- Fully cross-referenced with Volume 1, Volume 2, Volume 3, and Volume 4
Its table of contents is available here:
www.dumpanalysis.org/MDAA/MDA-Anthology-V5-TOC.pdf
Paperback and hardcover versions should be available in a week or two. I also started working on Volume 6 that should be available in November-December.
- Dmitry Vostokov @ DumpAnalysis.org + TraceAnalysis.org -
Posted in Aesthetics of Memory Dumps, Analysis Notation, Announcements, AntiPatterns, Archaeology of Computer Memory, Art, Assembly Language, Best Practices, Books, C and C++, CDF Analysis Tips and Tricks, Categorical Debugging, Citrix, Common Mistakes, Common Questions, Complete Memory Dump Analysis, Computer Forensics, Computer Science, Crash Analysis Report Environment (CARE), Crash Dump Analysis, Crash Dump De-analysis, Crash Dump Patterns, Crash Dumps for Dummies, Cyber Warfare, Debugging, Debugging Bureau, Debugging Industry, Debugging Methodology, Debugging Slang, Debugging Trends, Deep Down C++, Dr. Watson, Dublin School of Security, Education and Research, Escalation Engineering, Fun with Crash Dumps, Fun with Debugging, Fun with Software Traces, General Memory Analysis, Hermeneutics of Memory Dumps and Traces, Images of Computer Memory, Kernel Development, Malware Analysis, Mathematics of Debugging, Memiotics (Memory Semiotics), Memory Analysis Forensics and Intelligence, Memory Diagrams, Memory Dump Analysis Services, Memory Dumps in Myths, Memory Space Art, Memory Systems Language, Memory Visualization, Memory and Glitches, Metaphysics of Memory Worldview, Multithreading, Music for Debugging, New Acronyms, New Debugging School, New Words, Pattern Models, Philosophy, Physicalist Art, Publishing, Reverse Engineering, Science of Memory Dump Analysis, Science of Software Tracing, Security, Software Architecture, Software Behavior Patterns, Software Chorography, Software Chorology, Software Defect Construction, Software Engineering, Software Generalist, Software Maintenance Institute, Software Narratology, Software Technical Support, Software Trace Analysis, Software Trace Reading, Software Trace Visualization, Software Tracing for Dummies, Software Troubleshooting Patterns, Software Victimology, Structural Memory Patterns, Structural Trace Patterns, Systems Thinking, Testing, The Way of Philip Marlowe, Tools, Trace Analysis Patterns, Training and Seminars, Troubleshooting Methodology, Victimware, Vista, Webinars, WinDbg Scripting Extensions, WinDbg Scripts, WinDbg Tips and Tricks, WinDbg for GDB Users, Windows 7, Windows Server 2008, Windows System Administration, Workaround Patterns, x64 Windows | No Comments »
Saturday, March 26th, 2011
The presentation materials from the webinar (25th of March, 2011) are available for download:
http://www.dumpanalysis.com/PDSPSI-materials
Thanks to everyone who registered and attended!
- Dmitry Vostokov @ DumpAnalysis.org + TraceAnalysis.org -
Posted in Announcements, Crash Dump Analysis, Crash Dump Patterns, DebugWare Patterns, Debugging, Debugging Methodology, Escalation Engineering, Mac Crash Corner, Malware Analysis, Malware Patterns, Memory Analysis Forensics and Intelligence, Software Architecture, Software Behavior Patterns, Software Engineering, Software Technical Support, Software Trace Analysis, Software Tracing Implementation Patterns, Software Troubleshooting Patterns, Structural Memory Patterns, Structural Trace Patterns, Tools, Trace Analysis Patterns, Training and Seminars, Troubleshooting Methodology, Unified Debugging Patterns, Webinars, Workaround Patterns | No Comments »
Monday, March 7th, 2011

The first Webinar to start an in-depth discussion of pattern-driven software troubleshooting, debugging and maintenance:
Date: 25th of March 2011
Time: 18:30 (GMT) 14:30 (EST) 11:30 (PST)
Duration: 60 minutes
Space is limited.
Reserve your Webinar seat now at:
https://www3.gotomeeting.com/register/448268158
Topics include:
- A Short History of DumpAnalysis.org
- Memory Dump Analysis Patterns
- Troubleshooting and Debugging Tools (Debugware) Patterns
- Software Trace Analysis Patterns
- From Software Defects to Software Behavior
- Workaround Patterns
- Structural Memory Patterns
- Memory Analysis Domain Pattern Hierarchy
- New Directions
Prerequisites: experience in software troubleshooting and/or debugging.
- Dmitry Vostokov @ DumpAnalysis.org + TraceAnalysis.org -
Posted in .NET Debugging, Analysis Notation, Announcements, AntiPatterns, Best Practices, CDA Pattern Classification, Crash Dump Analysis, Crash Dump Patterns, DebugWare Patterns, Debugging, Debugging Methodology, Debugging Trends, Escalation Engineering, Java Debugging, Linux Crash Corner, Mac Crash Corner, Malware Analysis, Malware Patterns, Memory Analysis Forensics and Intelligence, Memory Dump Analysis Services, Pattern Models, Pattern Prediction, Presentations, Software Behavior Patterns, Software Chorology, Software Engineering, Software Narratology, Software Technical Support, Software Trace Analysis, Software Trace Reading, Software Tracing Implementation Patterns, Software Troubleshooting Patterns, Structural Memory Patterns, Structural Trace Patterns, Systems Thinking, Testing, Trace Analysis Patterns, Training and Seminars, Troubleshooting Methodology, Unified Debugging Patterns, Webinars, Workaround Patterns | No Comments »
Saturday, February 5th, 2011
Got an insider information from Memory Dump Analysis Services that they are developing a Prolog extension for memory dump analysis. Indeed, after asking their development team, I got a proof of concept extension DLL that works on my computer after installing x64 version of SWI-Prolog and copying wdes.dll to pl \ bin installation folder:
0: kd> .load C:\Program Files\pl\bin\wdes.dll
0: kd> !help

Help for Windows Debugging Expert System wdes.dll

   help               - Shows this help

   pload              - Loads Prolog interpretor
0: kd> !pload

SWI-Prolog has been loaded
So far so good. Waiting for more extension commands. Perhaps, one day, this extension realizes my dream reminisced while testing a Python extension.
- Dmitry Vostokov @ DumpAnalysis.org + TraceAnalysis.org -
Posted in Announcements, Artificial Intelligence for Debugging, Crash Analysis Report Environment (CARE), Crash Dump Analysis, Crash Dump Patterns, Debugging, Malware Analysis, Memory Analysis Report System, Memory Dump Analysis Services, Prolog for Debugging, WinDbg Scripting Extensions | No Comments »
Saturday, February 5th, 2011
Finally had time today to test python WinDbg extension. I installed python 2.6.6 and used Debugging Tools for Windows x64. The script I used was from the extension web site blog slightly modified and called processes.py:
from pykd import *

nt = loadModule( "nt" )

processList = typedVarList( nt.PsActiveProcessHead, "nt", "_EPROCESS", "ActiveProcessLinks" )

for process in processList:

    dprintln( "".join( [ chr(i) for i in process.ImageFileName.values() ] ) )

    dprintln( "\r" )
I loaded x64 version of pykd.pyd extension and executed the script:
0: kd> !py c:\PyScripts\processes.py

System

smss.exe

csrss.exe

csrss.exe

psxss.exe

winlogon.exe

wininit.exe

services.exe

lsass.exe

lsm.exe

svchost.exe

svchost.exe

svchost.exe

svchost.exe

svchost.exe

svchost.exe

svchost.exe

svchost.exe

spoolsv.exe

mdm.exe

svchost.exe

svchost.exe

svchost.exe

taskhost.exe

dwm.exe

explorer.exe

DTLite.exe

mmc.exe

WZQKPICK.EXE

concentr.exe

pnamain.exe

jusched.exe

wfcrun32.exe

msdtc.exe

iexplore.exe

iexplore.exe

iexplore.exe

splwow64.exe

iexplore.exe

jucheck.exe

iexplore.exe

notepad.exe

notepad.exe

iexplore.exe

notepad.exe

iexplore.exe

notepad.exe

notepad.exe

iexplore.exe

audiodg.exe

CDViewer.exe

wfica32.exe

iexplore.exe

notepad.exe

cmd.exe

conhost.exe

wuauclt.exe

wfica32.exe

wlrmdr.exe

TrustedInstall

wfica32.exe

notepad.exe

iexplore.exe

wmplayer.exe

VISIO.EXE

mspaint.exe

svchost.exe

sppsvc.exe

windbg.exe

mmc.exe

LogonUI.exe

taskeng.exe

NotMyfault.exe
Very good so far. I’m learning now Python language to write more interesting scripts for crash dump analysis pattern diagnostics, mining statistics, formatting and visualization. After browsing Amazon for some time I chose this book for study:
A Primer on Scientific Programming with Python

About 5 or 6 years ago I was thinking about using a Prolog interpreter to write an expert system for crash dump analysis. I even wrote a simple Prolog program to match product hotfixes and was contemplating writing a WinDbg extension especially after I learnt that SWI-Prolog system I used had an interpreter DLL that could be dynamically loaded into a Win32 API application.
- Dmitry Vostokov @ DumpAnalysis.org + TraceAnalysis.org -
Posted in Artificial Intelligence for Debugging, Crash Analysis Report Environment (CARE), Crash Dump Analysis, Crash Dump Patterns, Debugging, Malware Analysis, Memory Analysis Forensics and Intelligence, Memory Analysis Report System, Memory Visualization, Prolog for Debugging, Python for Debugging, WinDbg Scripting Extensions | No Comments »
Monday, January 3rd, 2011
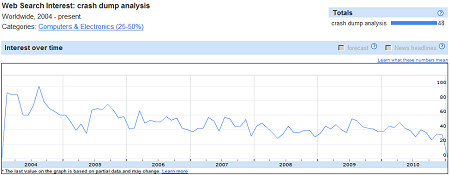
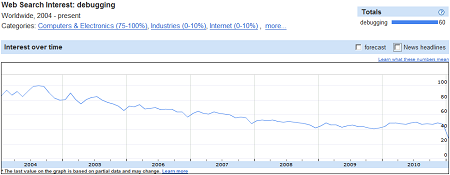
GI Index (Google Insights for Search) shows that crash dump analysis and debugging slowly decline in popularity:
GI for memory dump analysis searches coincides with the birth of DumpAnalysis.org in later 2006 (the only mystery for me is mid 2005 peak):
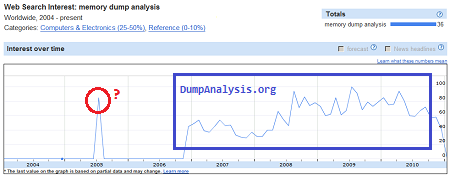
The birth of memory dump analysis as a discipline probably reinforced the emergence of memory forensics in the early 2006:
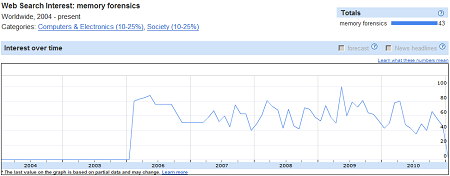
We also see that malware analysis is on the rise and it is not a surprise that DumpAnalysis.org is moving to MARS:
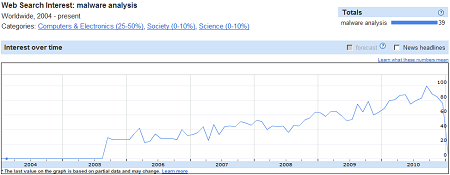
Perhaps mid 2005 peak for memory dump analysis searches coincides with the interest in malware analysis.
- Dmitry Vostokov @ DumpAnalysis.org + TraceAnalysis.org -
Posted in Announcements, Crash Dump Analysis, Debugging, History, Malware Analysis, Memoretics, Memory Analysis Forensics and Intelligence, Security | No Comments »
Saturday, January 1st, 2011
With the new year starts the new initiative to integrate traditional multidisciplinary debugging approaches and methodologies with multiplatform pattern-driven software problem solving, unified debugging patterns, best practices in memory dump analysis and software tracing, computer security, economics, and the new emerging trends I’m going to write about during this year.
- Dmitry Vostokov @ DumpAnalysis.org + TraceAnalysis.org -
Posted in Announcements, Best Practices, Computer Forensics, Computer Science, Countefactual Debugging, Crash Analysis Report Environment (CARE), Crash Dump Analysis, Crash Dump Patterns, DebugWare Patterns, Debugging, Debugging Industry, Debugging Methodology, Debugging Trends, Dublin School of Security, Economics, Education and Research, Escalation Engineering, First Fault Problem Solving, Malware Analysis, Malware Patterns, Mathematics of Debugging, Memiotics (Memory Semiotics), Memoretics, Memory Analysis Forensics and Intelligence, Memory Analysis Report System, Memory Dump Analysis Services, Memory Systems Language, Memory Visualization, New Debugging School, Science of Memory Dump Analysis, Science of Software Tracing, Security, Software Behavior Patterns, Software Defect Construction, Software Engineering, Software Generalist, Software Maintenance Institute, Software Narratology, Software Trace Analysis, Software Trace Visualization, Software Tracing Implementation Patterns, Software Troubleshooting Patterns, Structural Memory Patterns, Structural Trace Patterns, Systems Thinking, Testing, Tool Objects, Tools, Trace Analysis Patterns, Training and Seminars, Troubleshooting Methodology, Unified Debugging Patterns, Victimware, Visual Dump Analysis, Webinars, Workaround Patterns | No Comments »
Saturday, December 25th, 2010
As a part of my efforts to unify malware and forensic analysis with memory dump and software trace analysis from behavioral and structural patterns perspective I created this domain name. The word victimware was borrowed and extended from its previous limited use:
Software Victimology (Part 1)
Software Victimology (Part 2)
- Dmitry Vostokov @ DumpAnalysis.org + TraceAnalysis.org -
Posted in Announcements, Computer Forensics, Malware Analysis, Memory Analysis Forensics and Intelligence, Victimware | No Comments »
Friday, December 24th, 2010
Borrowing routine activity theory (RAT) from criminology I would like to introduce the similar approach to abnormal software behavior with patterning activities that adds additional unmotivated offenders to combine malware (software rats) with unintentional ordinary common bugware:
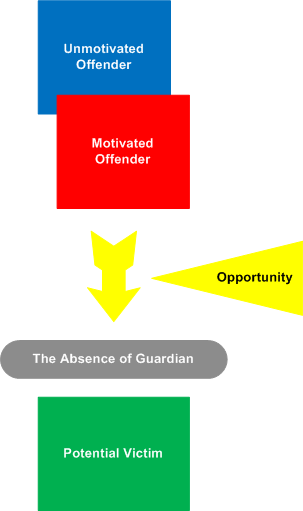
The application of RAT to software can be metaphorically named as Function Activity Theory (FAT).
- Dmitry Vostokov @ DumpAnalysis.org + TraceAnalysis.org -
Posted in Malware Analysis, Security, Software Behavior Patterns, Software Victimology, Structural Memory Patterns, Victimware | No Comments »