Archive for the ‘Log Analysis’ Category
Friday, July 17th, 2020
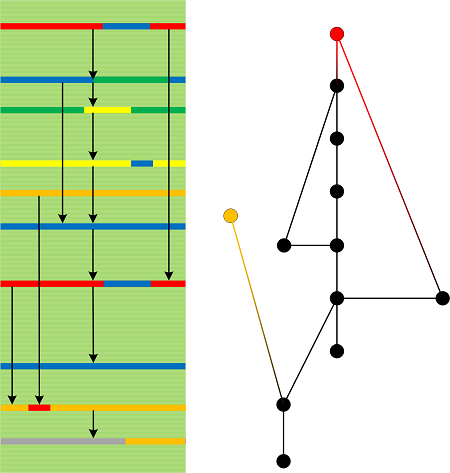
The relations between Causal History messages (0-chains) can be abstracted as Causal Chains (1-chains). Two relations can be linked if an endpoint of one is also a beginning point of another:
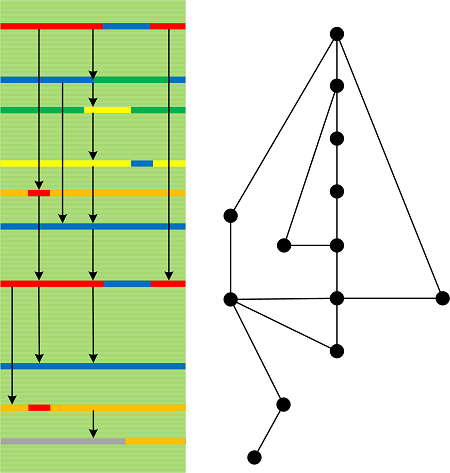
The relations of 1-chains can be abstracted as 2-chains and so on (n-chains):
We took the idea of relation spaces and chains from already quoted “Discreet Causal Theory” book. Causal chain terminology is also used in philosophy.
- Dmitry Vostokov @ DumpAnalysis.org + TraceAnalysis.org -
Posted in Log Analysis, Mathematics of Debugging, Software Trace Analysis, Trace Analysis Patterns, Trace Analysis and Physics | No Comments »
Thursday, July 16th, 2020
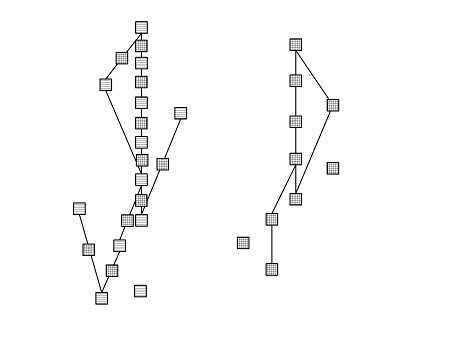
When looking at Causal History we can choose Causal Messages (not necesseraly the top ones):
Causal Messages may not overlap with the trace Defect Group which may not have any causal relevance being only correlation messages.
- Dmitry Vostokov @ DumpAnalysis.org + TraceAnalysis.org -
Posted in Log Analysis, Mathematics of Debugging, Software Trace Analysis, Trace Analysis Patterns, Trace Analysis and Physics | No Comments »
Wednesday, July 15th, 2020
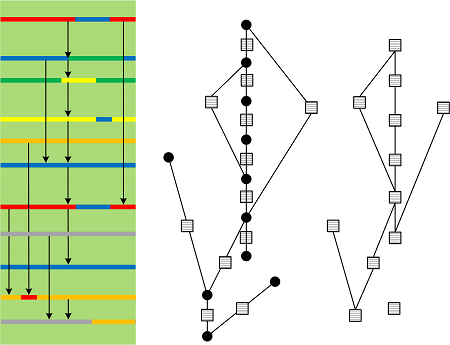
Trace Paths and Back Traces form Causal History of the log where arrows point in the direction of possible causation:
Here we borrow the notion of causal sets from physics and corresponding mathematics. The left diagramming idea was taken from Discrete Causal Theory book and Hasse diagrams (which is inverted in our picture). Also, such graphs are internal to software narratives compared to the more general external space we proposed earlier.
We omit Time arrow as it is possible to consider general traces and logs with their causality markers.
- Dmitry Vostokov @ DumpAnalysis.org + TraceAnalysis.org -
Posted in Log Analysis, Mathematics of Debugging, Software Trace Analysis, Trace Analysis Patterns, Trace Analysis and Physics | No Comments »
Tuesday, July 14th, 2020
Some trace acquisition methods and analysis workflows may require Trace Summaries having some timing and other statistical information to play the role of Indexical Trace when combined together:
- Dmitry Vostokov @ DumpAnalysis.org + TraceAnalysis.org -
Posted in Log Analysis, Software Trace Analysis, Trace Analysis Patterns | 1 Comment »
Monday, July 13th, 2020
Trace analysis gestures that result in CoTrace also produce Trace Path between messages of interest:
Such Trace Paths can also be useful for Trace Homotopy analysis. They also provide the basis for Explanation Traces.
Note that Trace Path is also a reverse for Back Trace analysis pattern. Both are usually selected from Working Set.
- Dmitry Vostokov @ DumpAnalysis.org + TraceAnalysis.org -
Posted in Log Analysis, Mathematics of Debugging, Software Trace Analysis, Trace Analysis Patterns | No Comments »
Saturday, July 11th, 2020
We call the association of external global variables, for example, the number of threads in the system and context switches, Trace Flux analysis pattern. Such variables can be discreet or continuous. Here we adopt the definition of flux as “a global physical variable associated with a surface and a time instant” from Enzo Tonti’s book “The Mathematical Structure of Classical and Relativistic Physics”.
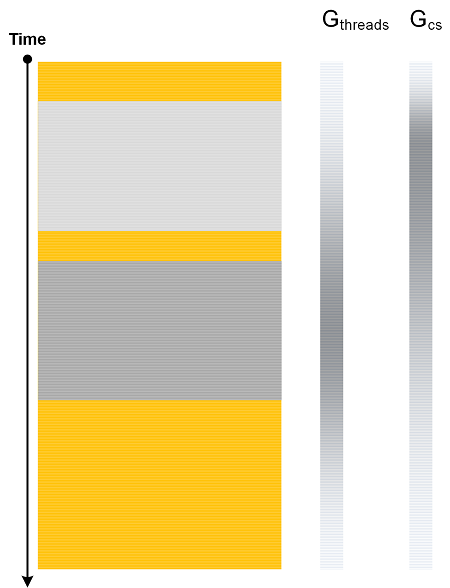
This is different than the internal functional association, Thread Field.
- Dmitry Vostokov @ DumpAnalysis.org + TraceAnalysis.org -
Posted in Log Analysis, Software Trace Analysis, Trace Analysis Patterns | No Comments »
Thursday, July 9th, 2020
Defect Group analysis pattern addresses messages related to source code defects (PLOTs), problem descriptions, and Inter-Correlation with wrong configuration files (Small DA+TA). It differs from Message Set analysis pattern as a predicate to group them may not be easily available.
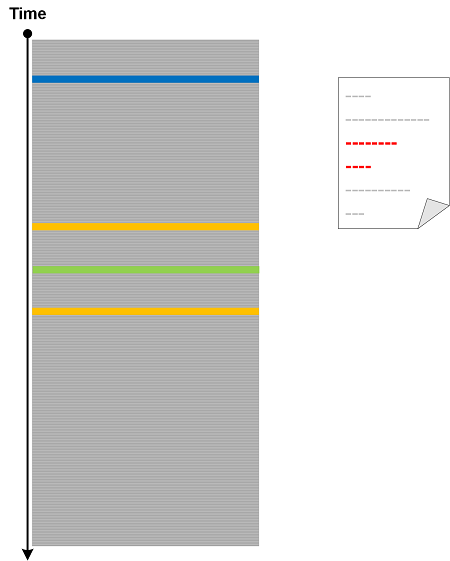
Such Defect Groups can be results of previous analyses activities. The name of the analysis pattern came from representation theory defect group of a block but at present, it is only name analogy.
- Dmitry Vostokov @ DumpAnalysis.org + TraceAnalysis.org -
Posted in Log Analysis, Mathematics of Debugging, Software Narratology, Software Trace Analysis, Trace Analysis Patterns | No Comments »
Tuesday, April 14th, 2020
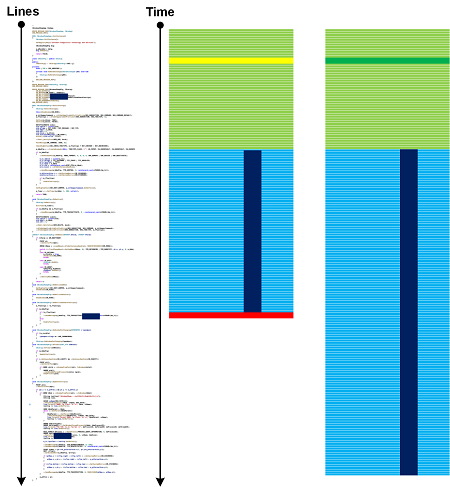
Source code can be considered as a type of a general trace from a corresponding generative narrative plane. We call it Generative Trace since it can generate different traces of execution. If such a trace contains logging code statements, then they form Declarative Trace as a subset of messages. Generative Trace also overlaps with the corresponding Moduli Trace. We can apply many trace and log analysis patterns and even consider line number axis as pseudo-time. The following diagram illustrates Linked Messages analysis pattern in the context of Generative Trace and generated traces:
- Dmitry Vostokov @ DumpAnalysis.org + TraceAnalysis.org -
Posted in Debugging, Log Analysis, Software Narratology, Software Trace Analysis, Trace Analysis Patterns | No Comments »
Wednesday, November 6th, 2019
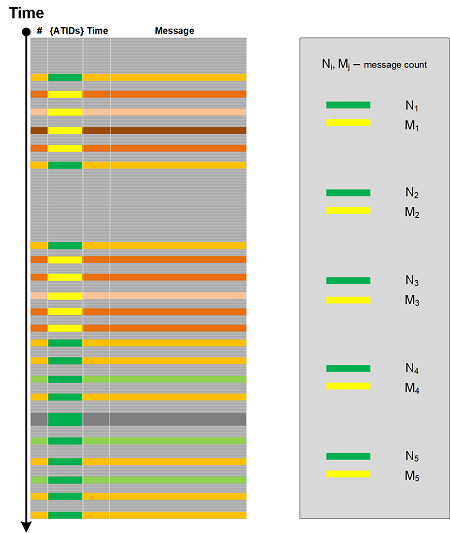
Message Flow trace and log analysis pattern generalizes NetFlow to software narratives. We count messages based on the set of Adjoint Threads of Activity, for example PID.TID. This also subsumes network traces aggregated by Src.Dst. Individual single attributes can also be used, for example, aggregation by Thread of Activity, and also by Message Sets.
- Dmitry Vostokov @ DumpAnalysis.org + TraceAnalysis.org -
Posted in Log Analysis, Network Trace Analysis, Network Trace Analysis Patterns, Software Narratology, Software Trace Analysis, Trace Analysis Patterns | No Comments »
Thursday, October 17th, 2019
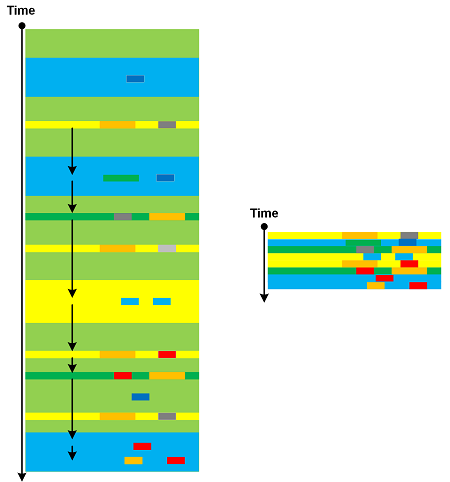
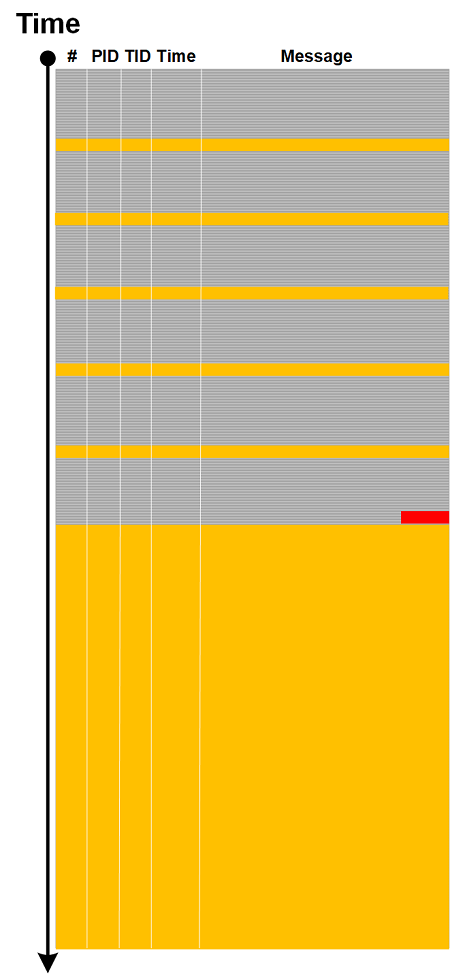
Traces and logs may show drastic qualitative and quantitative pattern changes. We call this analysis pattern Phase Transition by analogy with phase transitions in physical, biological and other complex systems. Usually the goal of the analysis is to find a parameter that caused such transition. Here are a few examples which are self-explanatory.
Change in Statement Density and Current:
Sudden proliferation of (Adjoint) Threads of Activity:
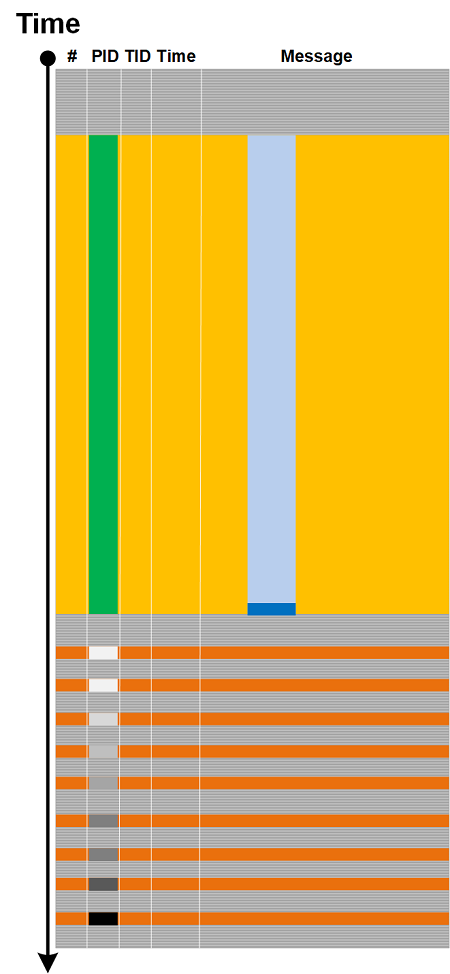
Discontinuity of Activity Region with only Drone Messages left:
- Dmitry Vostokov @ DumpAnalysis.org + TraceAnalysis.org -
Posted in Log Analysis, Software Trace Analysis, Trace Analysis Patterns, Trace Analysis and Physics | No Comments »
Wednesday, October 2nd, 2019
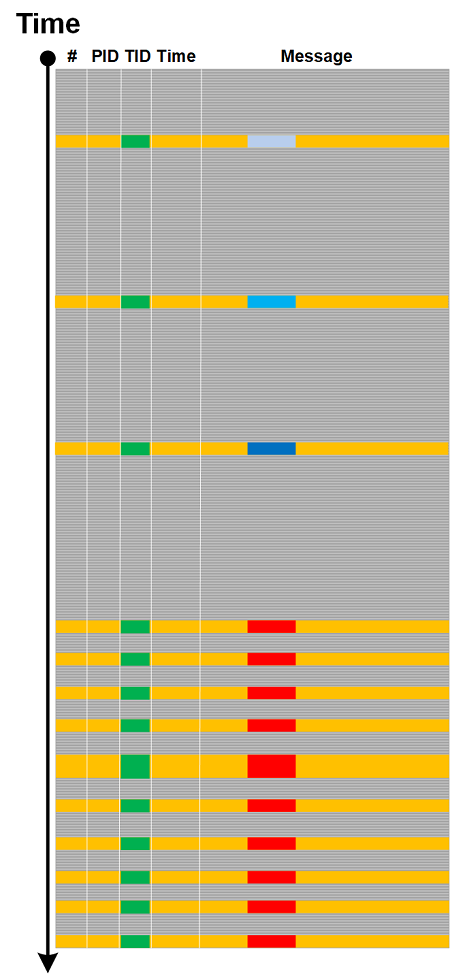
Depending on tracing architecture we may have trace or log messages split into several statements. For example, some API and library tracing tools may log a function call after it returns with a result, but some tools or tracing libraries may log calls in the context of corresponding threads and, therefore, be preempted by other tracing and logging threads, and even interrupted. In the latter cases we may have Split Message like depicted in the following diagram:
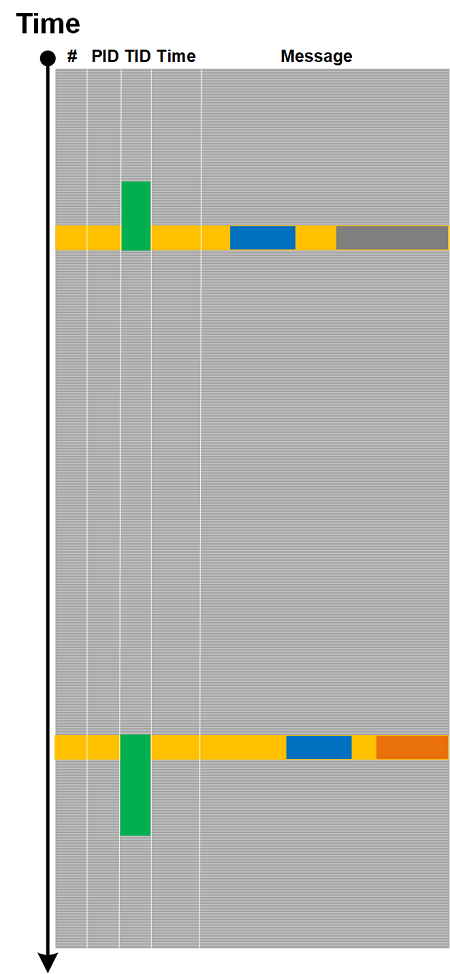
Typical example here is Linux strace. We can recognize such messages by their Message Invariant and Ornament.
Split Message is different from Opposition Messages analysis pattern where we have messages logged from different source code tracing statements, when, for example, a function call result is logged separately. But, in the same vein, when we see an unfinished Split Message we may assume some sort of Discontinuity.
- Dmitry Vostokov @ DumpAnalysis.org + TraceAnalysis.org -
Posted in Linux Tracing and Logging, Log Analysis, Software Trace Analysis, Trace Analysis Patterns | No Comments »
Sunday, September 15th, 2019
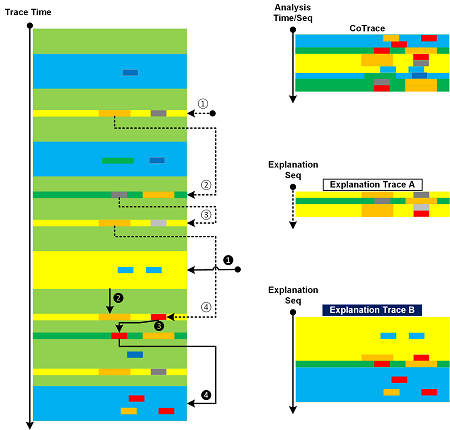
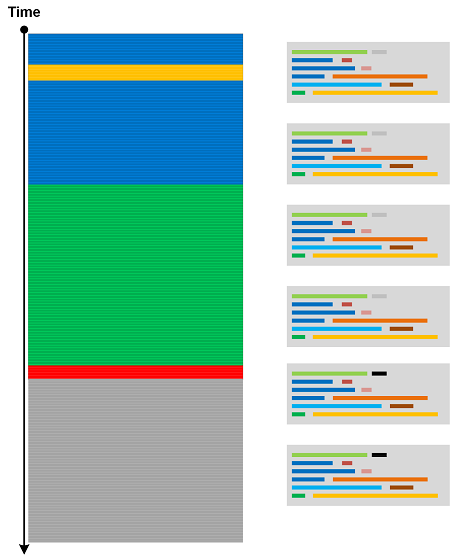
When we analyze a trace or log we may produce CoTrace of analyzed messages and visited regions. But the ultimate goal of any trace and log analysis is to construct the explanation of the observed behavoir to justify the root cause analysis and the proposed mechanism. There may be several proposed explanations each having a different set of messages from the analyzed trace that illustrate them. We call them Explanation Traces. This is illustrated in the picture where we use the same trace from CoTrace analysis pattern.
- Dmitry Vostokov @ DumpAnalysis.org + TraceAnalysis.org -
Posted in Log Analysis, Software Pathology, Software Trace Analysis, Trace Analysis Patterns | No Comments »
Tuesday, July 30th, 2019
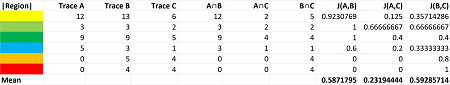
Trace Similarity analysis pattern uses various similarity measures to assess the closeness of one trace or log to another. Here we provide an illustrative example using Jaccard index. Consider three simple logs where sample sets consist from Activity Regions:
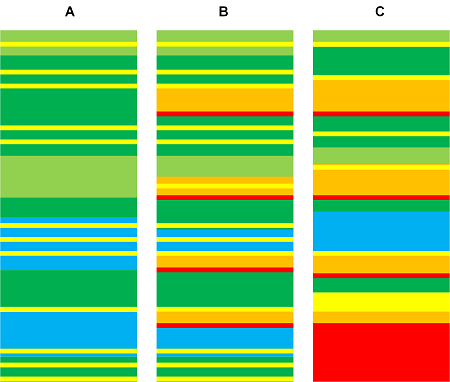
The following table shows calculation of similarity between A and B, A and C, and B and C:
It’s possible to use sample sets consisting of messages instead. For our toy example we get similar index numbers:
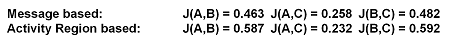
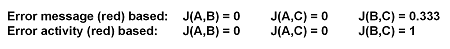
We get different indexes though for individual regions and messages, for example:
- Dmitry Vostokov @ DumpAnalysis.org + TraceAnalysis.org -
Posted in Anomaly Detection, Log Analysis, Mathematics of Debugging, Software Trace Analysis, Trace Analysis Patterns, Trace Analysis and Topology | No Comments »
Saturday, July 27th, 2019
In addition to Declarative Trace we have code statements that may be intercepted by external API tracing tools (CreateFile, CloseHandle):
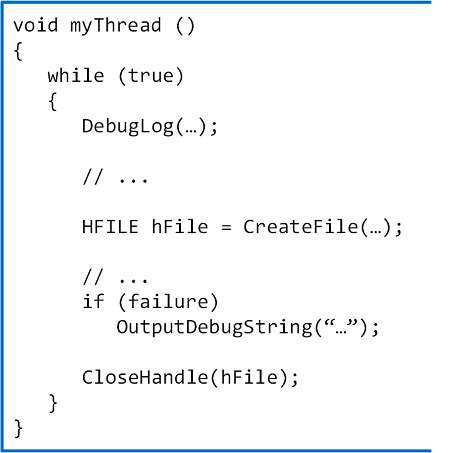
In the sample code above we have different logs resulted from Declarative Trace (DebugLog, OutputDebugString):
In addition, we have a log saved by an external tracing tool (for example, Process Monitor) that includes our API calls:
All such trace-generating source code statements form Moduli Trace as soon as they are executed:

Such a trace can also be analyzed using trace and log analysis patterns like other trace types. We took the idea of this analysis pattern from moduli spaces in mathematics that parametrize other spaces.
- Dmitry Vostokov @ DumpAnalysis.org + TraceAnalysis.org -
Posted in Log Analysis, Mathematics of Debugging, Software Trace Analysis, Trace Analysis Patterns, Trace Analysis and Topology | No Comments »
Sunday, July 21st, 2019
When we do trace and log analysis (and software data in general) we look at specific messages found from search (Message Patterns), Error Messages, Significant Events, visit Activity Regions, filter Message Sets, walk through (Adjoint) Threads of Activity, and do other actions necessitated by trace and log analysis patterns. All these can be done in random order (starting from some analysis point), not necessarily representing the flow of Time or some other metric:
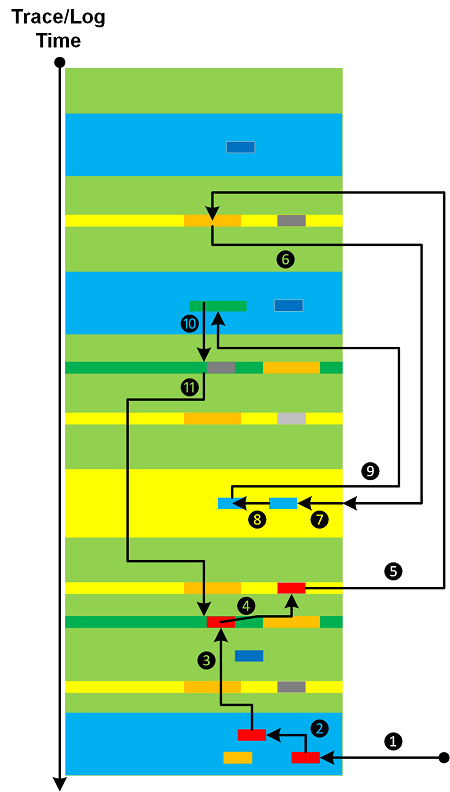
Analyzed messages form their own analysis trace that we call CoTrace (CoLog, CoData) where the prefix Co- denotes a space dual to trace (log, data) space:
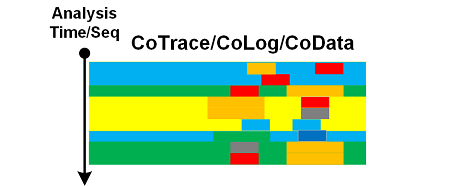
Instead of messages (or in addition to) we can also form CoTraces consisting of visited Activity Regions or some other areas:
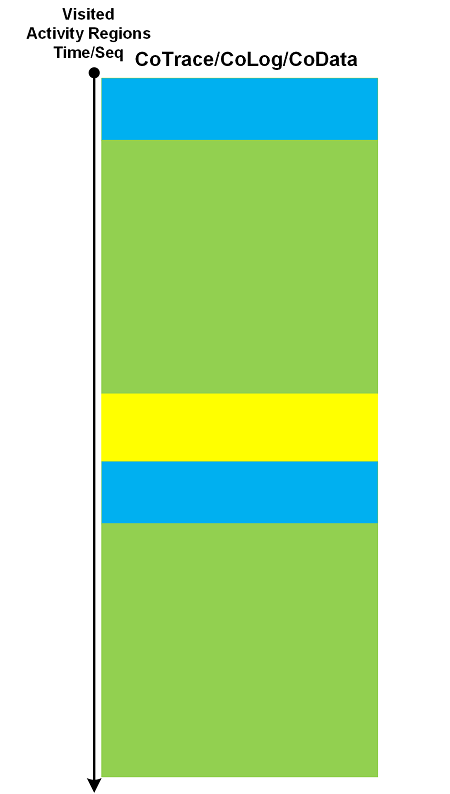
We can apply trace analysis patterns to CoTraces as well. The latter can also be used in creation of higher-order pattern narratives.
- Dmitry Vostokov @ DumpAnalysis.org + TraceAnalysis.org -
Posted in Log Analysis, Software Narratology, Software Trace Analysis, Trace Analysis Patterns | No Comments »
Saturday, July 20th, 2019
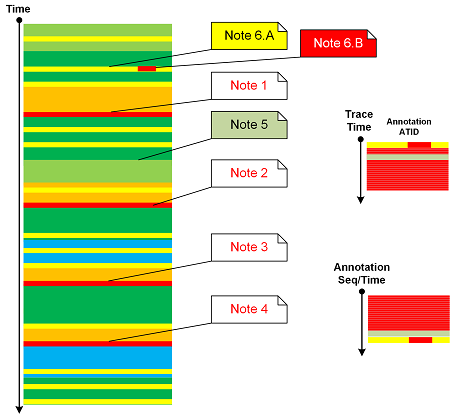
Message Annotations analysis pattern was on our list for years so it’s time to add it to trace and log analysis pattern catalog. We also allow several annotations per trace message done at different times and annotating different parts depending on the analysis flow (the topic of the next analysis pattern). Attached to log messages annotations form their own Adjoint Thread of Activity. However, sorted by their annotation time or sequence we get a different trace that we call Annotation Trace (an example of analysis narrative). We can apply all relevant analysis patterns to both traces. A sketch of this pattern is depicted in the following diagram:
- Dmitry Vostokov @ DumpAnalysis.org + TraceAnalysis.org -
Posted in Log Analysis, Software Trace Analysis, Trace Analysis Patterns | No Comments »
Tuesday, July 16th, 2019
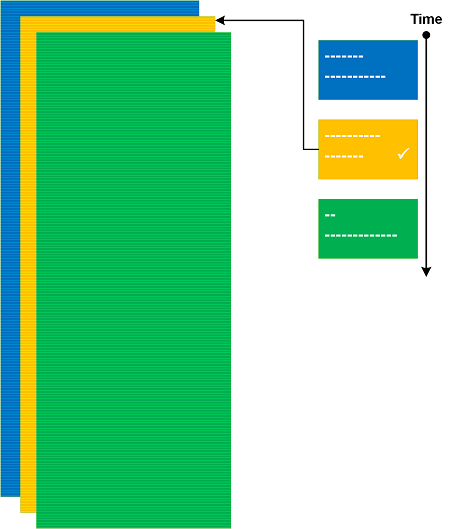
Cartesian Trace analysis pattern has its analogical roots in Cartesian product. It covers a case where we have a long trace and a few Small DA+TA configuration traces (files). The former trace messages are associated with the latter messages (content or content changes) as depicted in the following diagram:
Think about a rectangle as a product of two line fragments or a cylinder as a product of a circle and a line fragment. Both traces are completely independent in comparison to Fiber Bundle, Trace Presheaf, or Trace Extension.
- Dmitry Vostokov @ DumpAnalysis.org + TraceAnalysis.org -
Posted in Log Analysis, Mathematics of Debugging, Software Trace Analysis, Trace Analysis Patterns | No Comments »
Sunday, July 14th, 2019
Some trace and log messages may have different grammatical structure and content but similar semantics. Therefore, we can create a table listing equivalent messages (using some equivalence relation) and use it to construct simpler traces and logs as depicted in this picture:

One trivial example of Equivalent Messages analysis pattern is Quotient Trace. Another example is Inter-Correlational analysis of logs that have different structure and format. In such a case Equivalent Messages simplify the analysis of higher Trace Dimensions.
- Dmitry Vostokov @ DumpAnalysis.org + TraceAnalysis.org -
Posted in Log Analysis, Mathematics of Debugging, Software Trace Analysis, Trace Analysis Patterns, Trace Analysis and Topology | No Comments »
Wednesday, July 10th, 2019
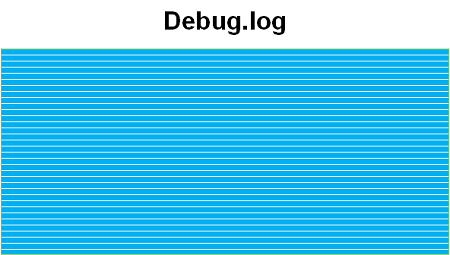
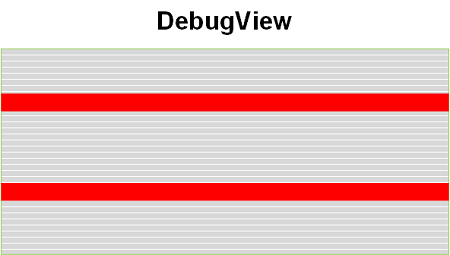
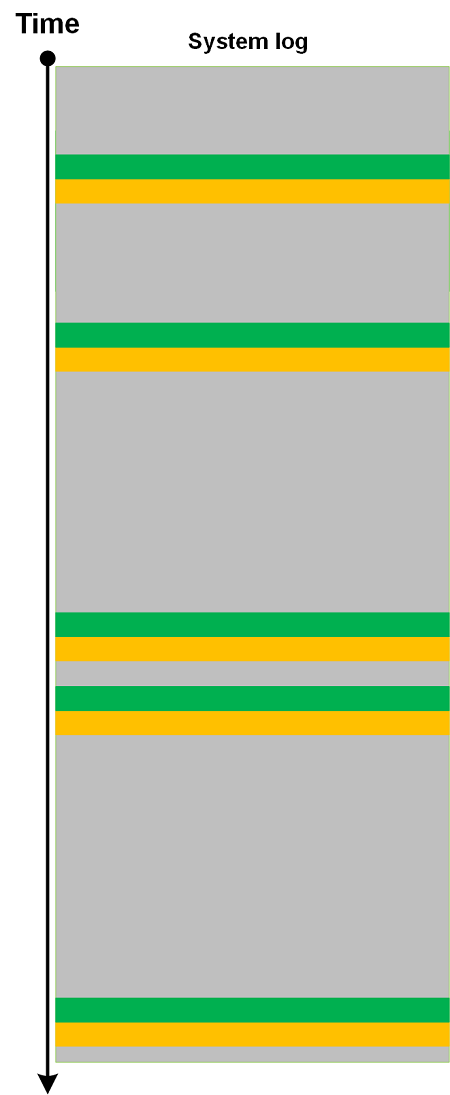
Log message “frequencies” in time domain (Statement Current part) are addressed by Fourier Activity analysis pattern. However, we may have varying message density (Statement Density part) across different trace runs (space domain, irrespective of time irregularities):
According to OED, in computing and mathematics a string means “a linear sequence of records or data” and “a sequence of symbols or linguistic elements in a definite order”. So we propose to name this pattern that analyzes densities of messages or Activity Regions as Trace String. Such longitudinal “vibrations” can be compared and analyzed for anomalies across different log runs (Inter-Correlation) or across similar regions in the same log (Intra-Correlation). Here we consider message density change as a one-dimensional displacement. The analogy for this pattern came from one-dimensional vibrating strings (dual resonance model from 1969-70 by Nambu, Nielsen, and Leonard Susskind).
- Dmitry Vostokov @ DumpAnalysis.org + TraceAnalysis.org -
Posted in Log Analysis, Software Trace Analysis, Trace Analysis Patterns, Trace Analysis and Physics | No Comments »
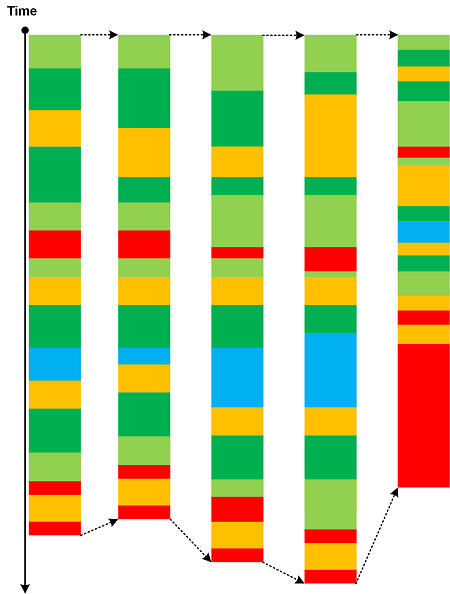
Monday, May 27th, 2019
The advent of virtualization simplified the debugging of complex issues by allowing to save the snapshot of the execution environment and then resume it from the save point of execution. This allows continuing tracing using a different set of environmental conditions and input data. New tracing continuations constitute a network that we call Polytrace:
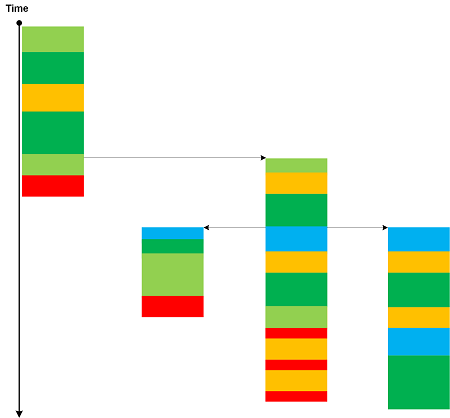
Bifurcation Point for two identical trace beginnings may be considered as an example of a simple Polytrace.
- Dmitry Vostokov @ DumpAnalysis.org + TraceAnalysis.org -
Posted in Log Analysis, Software Trace Analysis, Trace Analysis Patterns, Virtualization | 1 Comment »