Archive for the ‘Fun with Crash Dumps’ Category

Pictures from Memory Space (Part 4)
Wednesday, September 30th, 2009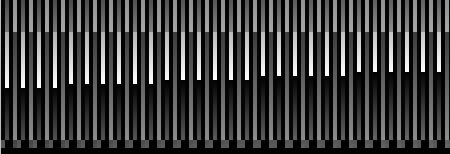
Memory Dump and Minidumps
Wednesday, September 30th, 2009Welcome to Physicalist Art that has its foundation in Physicalism. The first physicalist composition was on display today and I took a picture of it (weather condition was not good):
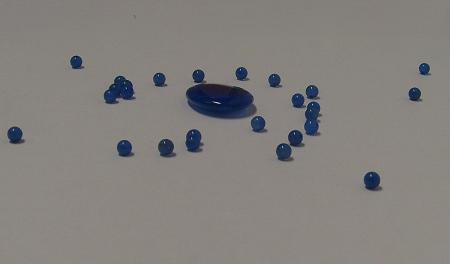
Material: blue agate
It was originally called “Blue in a gate: memory dump and minidumps”. I plan to reinstall it again with more elaborate surroundings.
- Dmitry Vostokov @ DumpAnalysis.org -
What color is your instruction?
Wednesday, September 30th, 2009Opcodism art is not limited to assembly language code and binary installations. It also provides beautiful color illustrations of processor opcodes and instructions. In this post I provide illustrations of NOP, PAUSE and INT 3 instructions generated by Dump2Picture from memory dump images of crashed 1MbNop and 1MbPause processes.
0:000> lmp

start             end                 module name

00000000`77030000 00000000`7715d000   kernel32

00000000`77230000 00000000`773b6000   ntdll

00000001`40000000 00000001`40144000   1MbNop

000007fe`fd1c0000 000007fe`fd1f5000   apphelp

000007fe`fdaf0000 000007fe`fdc33000   rpcrt4

000007fe`ff400000 000007fe`ff508000   advapi32
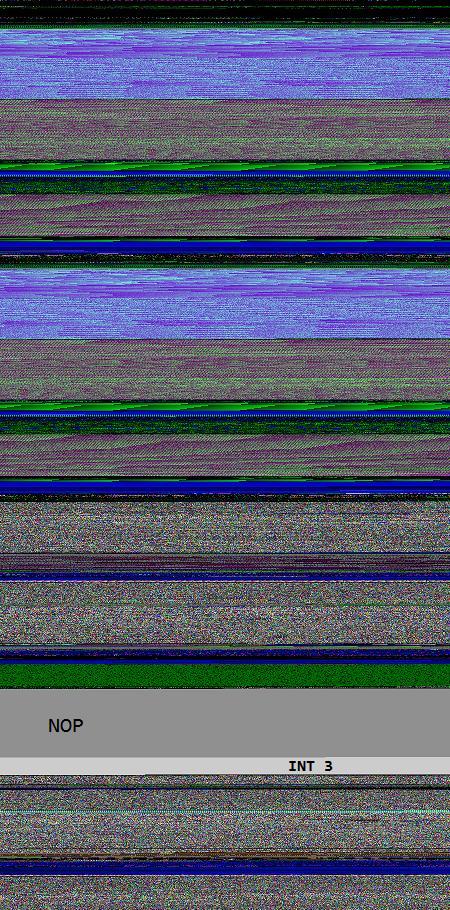
8 bit image of 1Mb NOP field fenced by INT 3 wall:
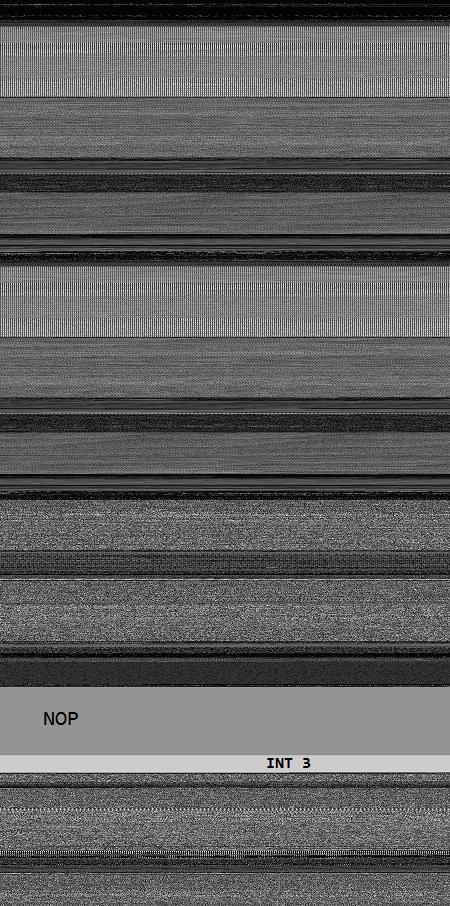
16 bit image of 1Mb NOP field fenced by INT 3 wall:
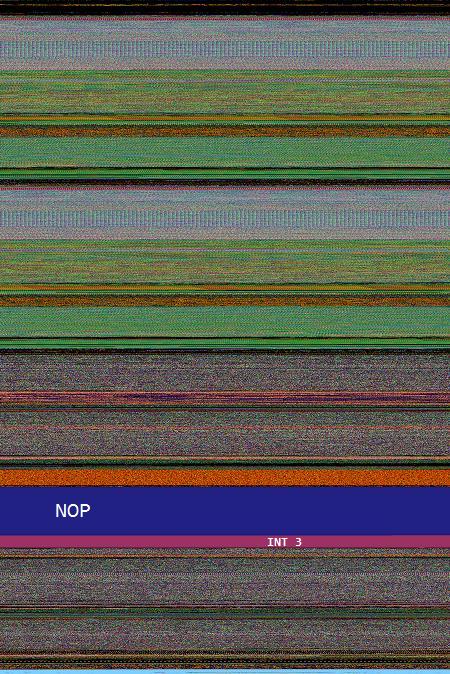
24 bit image of 1Mb NOP field fenced by INT 3 wall:
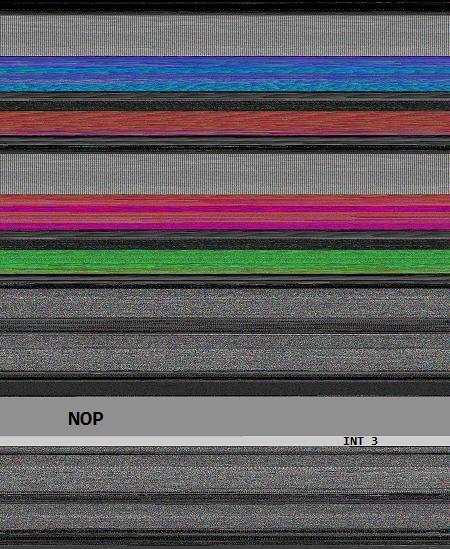
32 bit image of 1Mb NOP field fenced by INT 3 wall:
0:000> lmp

start             end                 module name

00000000`77030000 00000000`7715d000   kernel32

00000000`77230000 00000000`773b6000   ntdll

00000001`40000000 00000001`40284000   1MbPause
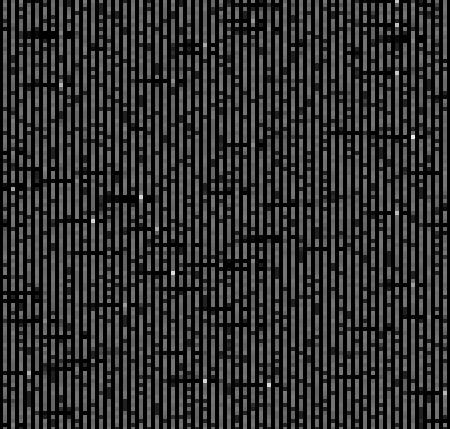
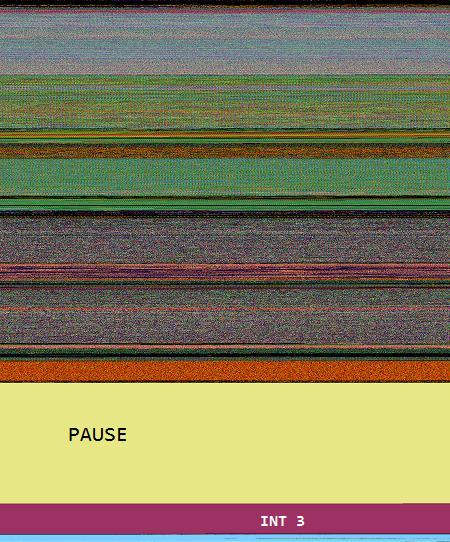
8 bit image of 1Mb PAUSE field fenced by INT 3 wall:
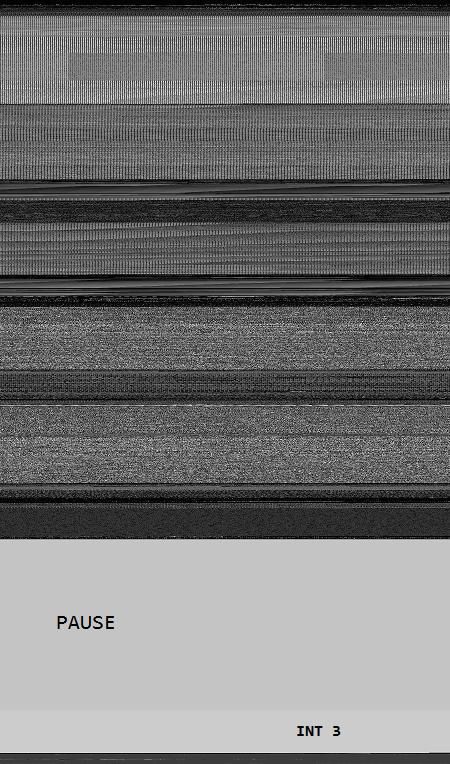
The same as above but PAUSE / INT 3 transition magnified:

16 bit image of 1Mb PAUSE field fenced by INT 3 wall:
24 bit image of 1Mb PAUSE field fenced by INT 3 wall:
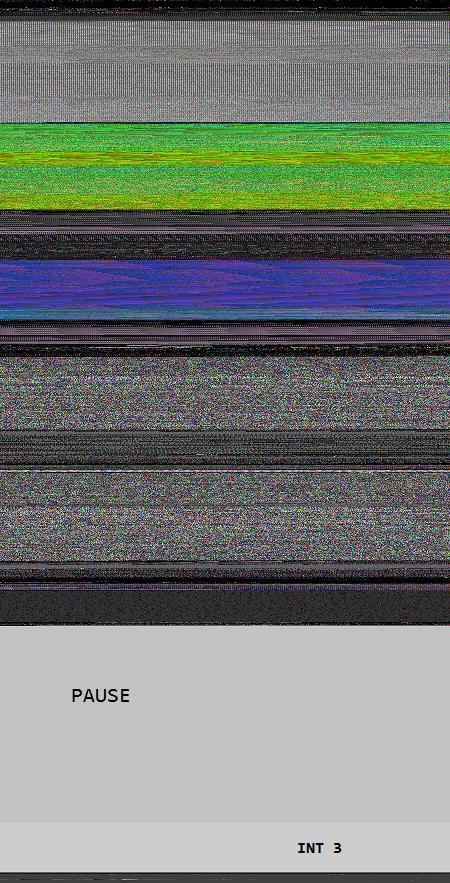
The same as above but PAUSE / INT 3 transition magnified:

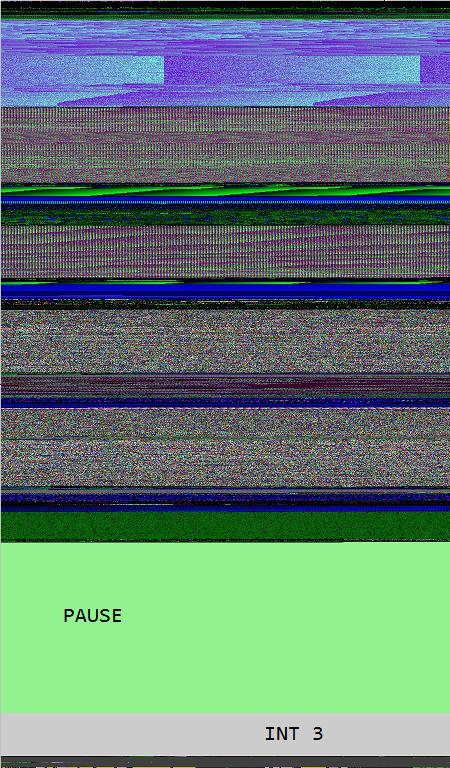
32 bit image of 1Mb PAUSE field fenced by INT 3 wall:
- Dmitry Vostokov @ DumpAnalysis.org -
Opcodism: The Art of Opcodes
Monday, September 28th, 2009Fascinated by Kazimir Malevich’s Black Square I created the new art genre with the following two artistic installations:
A Pause before Crash
This is 1Mb of PAUSE instructions without the point of return:
_text SEGMENT
main PROC
DW 100000h DUP (90f3h)
main ENDP
_text ENDS
END
When launched it crashes:
0:000> kL

Child-SP          RetAddr           Call Site

00000000`0012ff58 00000000`7704be3d 1MbPause+0x201011

00000000`0012ff60 00000000`77256a51 kernel32!BaseThreadInitThunk+0xd

00000000`0012ff90 00000000`00000000 ntdll!RtlUserThreadStart+0x1d
0:000> ub rip

1MbPause+0x201002:

00000001`40201002 f390            pause

00000001`40201004 f390            pause

00000001`40201006 f390            pause

00000001`40201008 f390            pause

00000001`4020100a f390            pause

00000001`4020100c f390            pause

00000001`4020100e f390            pause

00000001`40201010 cc              int     3
You can download the source code, PDB and 64-bit EXE from here:
Do Nothing and Crash
This is 1Mb of NOP instructions without the point of return:
_text SEGMENT
main PROC
DB 100000h DUP (90h)
main ENDP
_text ENDS
END
When launched it crashes too:
0:000> kL

Child-SP          RetAddr           Call Site

00000000`0012ff58 00000000`7704be3d 1MbNop+0x101011

00000000`0012ff60 00000000`77256a51 kernel32!BaseThreadInitThunk+0xd

00000000`0012ff90 00000000`00000000 ntdll!RtlUserThreadStart+0x1d
0:000> ub rip

1MbNop+0x101009:

00000001`40101009 90              nop

00000001`4010100a 90              nop

00000001`4010100b 90              nop

00000001`4010100c 90              nop

00000001`4010100d 90              nop

00000001`4010100e 90              nop

00000001`4010100f 90              nop

00000001`40101010 cc              int     3
You can download the source code, PDB and 64-bit EXE from here:
The earliest opcodism binary was created on October 25th, 2006 that I now call Nothingness and Crash: The Smallest Program.
- Dmitry Vostokov @ DumpAnalysis.org -
Forthcoming Memory Dump Analysis Anthology, Volume 3
Saturday, September 26th, 2009This is a revised, edited, cross-referenced and thematically organized volume of selected DumpAnalysis.org blog posts about crash dump analysis and debugging written in October 2008 - June 2009 for software engineers developing and maintaining products on Windows platforms, quality assurance engineers testing software on Windows platforms and technical support and escalation engineers dealing with complex software issues. The third volume features:
- 15 new crash dump analysis patterns
- 29 new pattern interaction case studies
- Trace analysis patterns
- Updated checklist
- Fully cross-referenced with Volume 1 and Volume 2
- New appendixes
Product information:
- Title: Memory Dump Analysis Anthology, Volume 3
- Author: Dmitry Vostokov
- Language: English
- Product Dimensions: 22.86 x 15.24
- Paperback: 404 pages
- Publisher: Opentask (20 December 2009)
- ISBN-13: 978-1-906717-43-8
- Hardcover: 404 pages
- Publisher: Opentask (30 January 2010)
- ISBN-13: 978-1-906717-44-5

Back cover features 3D computer memory visualization image.
- Dmitry Vostokov @ DumpAnalysis.org -
Debugging Spy Network
Tuesday, September 15th, 2009SecretSES (Secret Software Engineering Society) announces Debugging Spy Network of Memory Analysis Forensics and Intelligence Agents (MAFIA).
Motivation: seeing various nomadic and settled debugging teams I finally decided to unfold my own net.
- Dmitry Vostokov @ DumpAnalysis.org -
Bugtation No.102
Friday, September 4th, 2009I don’t read mere books. I analyze memory dumps. Books are memory dumps. Memory dumps are books.
Dmitry Vostokov, Variation on a theme “A book is a memory dump”
- Dmitry Vostokov @ DumpAnalysis.org -
SAD Events (Debugging Slang, Part 3)
Thursday, September 3rd, 2009SAD eventSystem or Application Dump event
- Dmitry Vostokov @ DumpAnalysis.org -
Exception Processing Of Crash Hypothesis (EPOCH)
Wednesday, September 2nd, 2009Our Universe is Unhandled Exception Processing saving one huge Memory Dump from a runaway HUC (Big Bang of Hyper-Universal Computation, or simply HUge Computation). The idea came to me some months ago but I decided to publish it after learning today about a “Mathematical Universe Hypothesis” (MUH) from Max Tegmark stating that our Universe is Mathematics.
EPOCH
Exception Processing Of Crash Hypothesis (or Memory Dump Universe Hypothesis)
Note: what a sad feeling I had while simultaneously listening to the Light track from Thin Red Line soundtrack while writing this post…
- Dmitry Vostokov @ DumpAnalysis.org -
Dao of Debugging
Wednesday, September 2nd, 2009Dao De Jing bugging
Bang the Debugger, explains his extraordinary skill in debugging:
“The Thread is the Way, the flow I follow. When I started I could only use !analyze -v command. After 4 years I could see through memory bits without lenses of a debugger program because Dao is beyond computer understanding and more than technical skills.”
Based on the famous story from Ding the Butcher.
- Dmitry Vostokov @ DumpAnalysis.org -
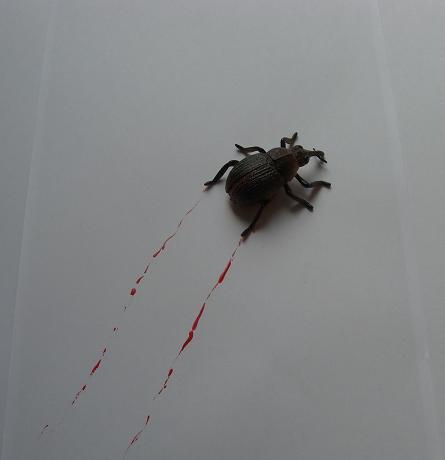
Experiments on Poor Bugs
Tuesday, August 18th, 2009This is the real photo of tracing experiments used for the front cover of September 2009 issue of Debugged! magazine:
- Dmitry Vostokov @ DumpAnalysis.org -
The Strange Love of Dr. DebugLove
Monday, August 10th, 2009I’m very delighted to be a Dr. DebugLove! There are many Dr. Debug out there (Google shows 1,840,000 hits) but do they really love debugging like I do? Of course, they do, but I’m the first to acknowledge my strange love publicly by accepting a pseudonym.
- Dmitry Vostokov @ DumpAnalysis.org -
Bsoddite Movement
Friday, August 7th, 2009The new contemporary movement of engineers resisting dump analysis automation (including automated debugging and perhaps automated software construction too)
Inspired by Luddite movement.
- Dmitry Vostokov @ DumpAnalysis.org -
Reconstructing Blue Screen of Death
Friday, August 7th, 2009While I was listening to Klaus Schulze In Blue album a colleague sent me the link to a tool that reconstructs blue screens from minidumps (small memory dumps):
BlueScreenView (written by Nir Sofer)
I immediately downloaded it at it works even with kernel dumps but without pointing to a module that triggered the bugcheck (it shows modules for minidumps):
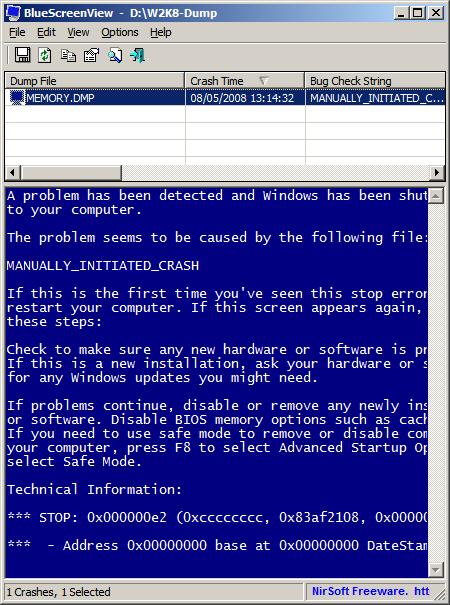
It ignores memory dumps and minidumps from x64 Windows so the next version I hope should do it ![]()
PS. Long time ago I was thinking about writing a kernel driver that saves BSOD screen and embeds it in a memory dump.
- Dmitry Vostokov @ DumpAnalysis.org -
Moving towards the Psi point
Thursday, August 6th, 2009The hierarchy of Ψ1, …, Ψ8, …, Ψ16, …, Ψ32, …, Ψ64, …, …, …, ΨΨ numbers where the subscript denotes the number of bits a memory address can have, so Ψ32 and Ψ64 are memorillion and quadrimemorillion of memory dumps respectively. We only need to figure out the meaning of Ψ0 and ΨΨ. Perhaps there is some meaning in Dirac notation here: <Ψ0|ΨΨ>. More on this later because I have to finish this week the book x64 Windows Debugging: Practical Foundations and write an errata file for the previous x86 version of the book series.
Note: Ψ is an M upside down.
- Dmitry Vostokov @ DumpAnalysis.org -
Bugtation No.99
Tuesday, August 4th, 2009To be is to crash and to be crashed.
- Dmitry Vostokov @ DumpAnalysis.org -
Real-time Memory Visualization System
Thursday, July 23rd, 2009Jamie Fenton has finally made available for beta testing fantastic memory visualization system HayWire & Barn Burner I use often for mining curious pictures from virtual memory space, like “cosmic rays“. Besides providing artistic pleasure, real-time natural memory visualization can have other applications including visual debugging. Looking forward to seeing more wonders in this area of research!
- Dmitry Vostokov @ DumpAnalysis.org -
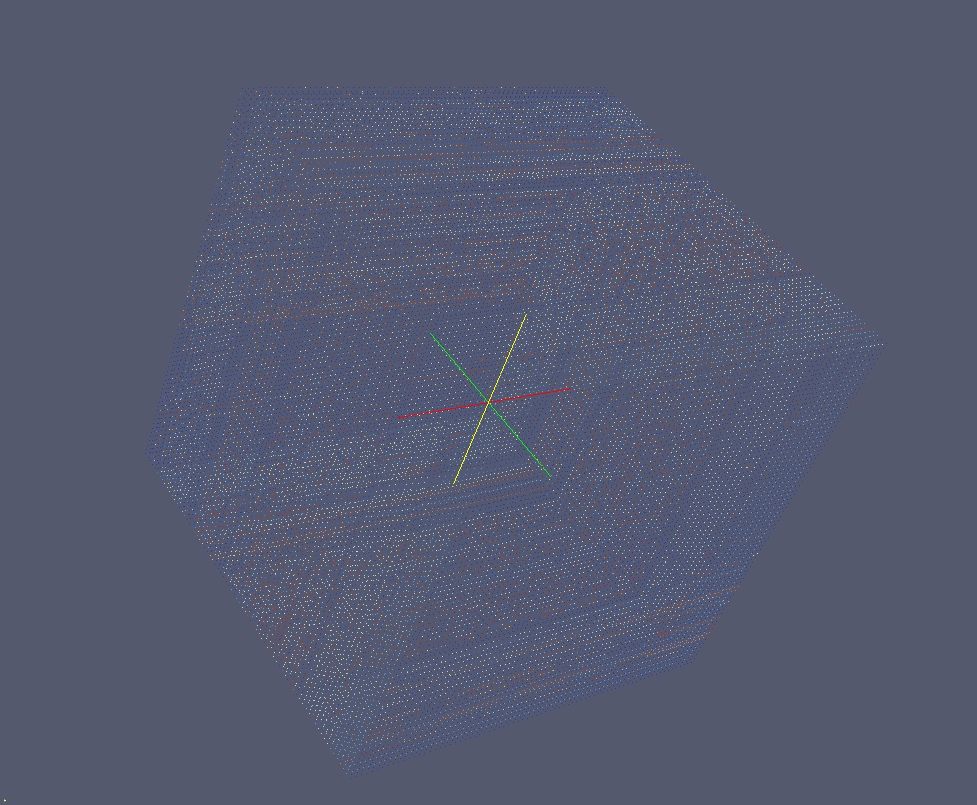
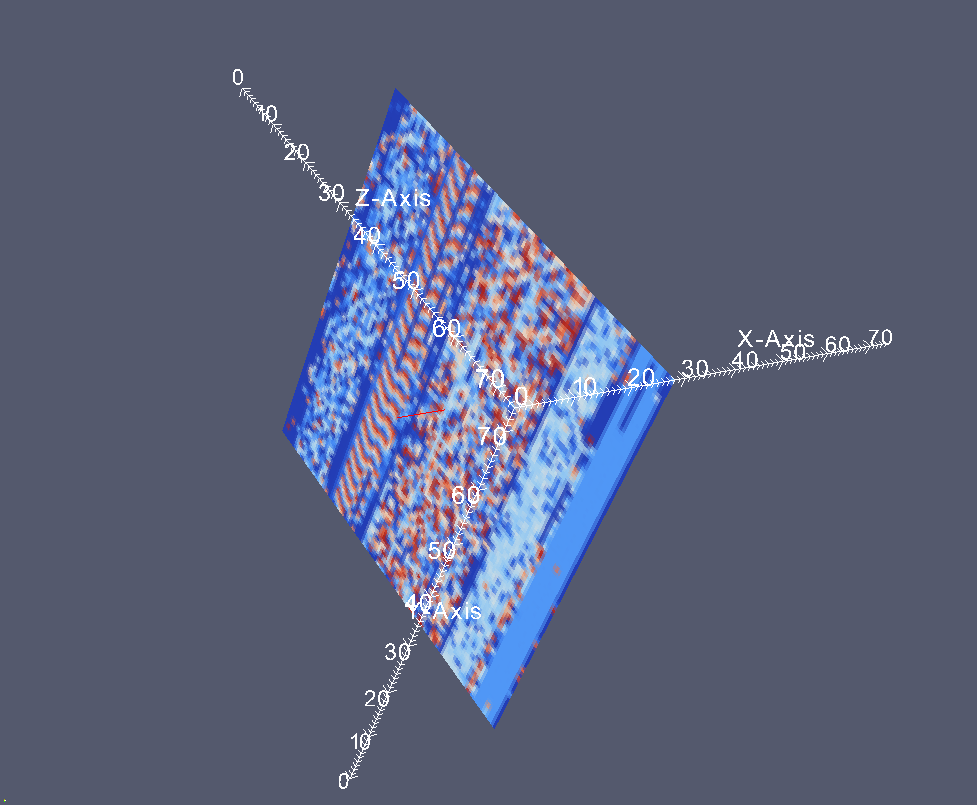
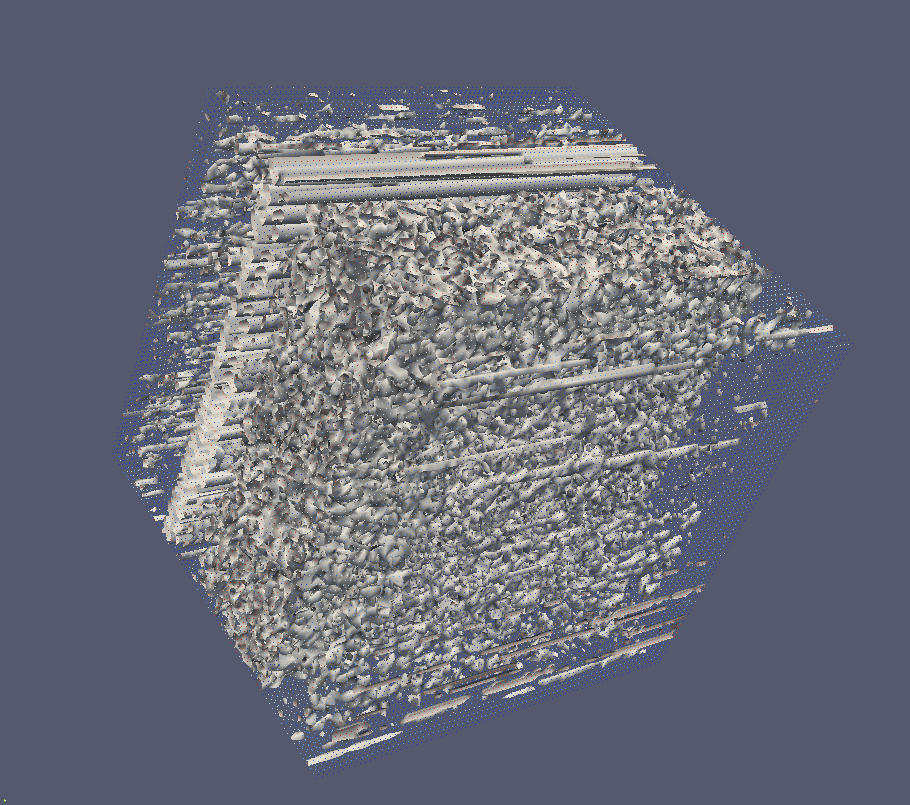
3D Memory Visualization
Sunday, July 19th, 2009Finally I realized this morning that in addition to folding of a linear memory space into a 2D image in ParaView, the so called DLL List Landscape, we can also do a 3D folding too. I used the same dump file but this time the formula for coordinates is:
(file_size/4)1/3
so for 1,746,853 byte file we have a 3D map of 75×75x75 points. Here are some beautiful images (click on them for a larger view) that I got and I write next parts of advanced memory visualization tutorial later next week.
Point view
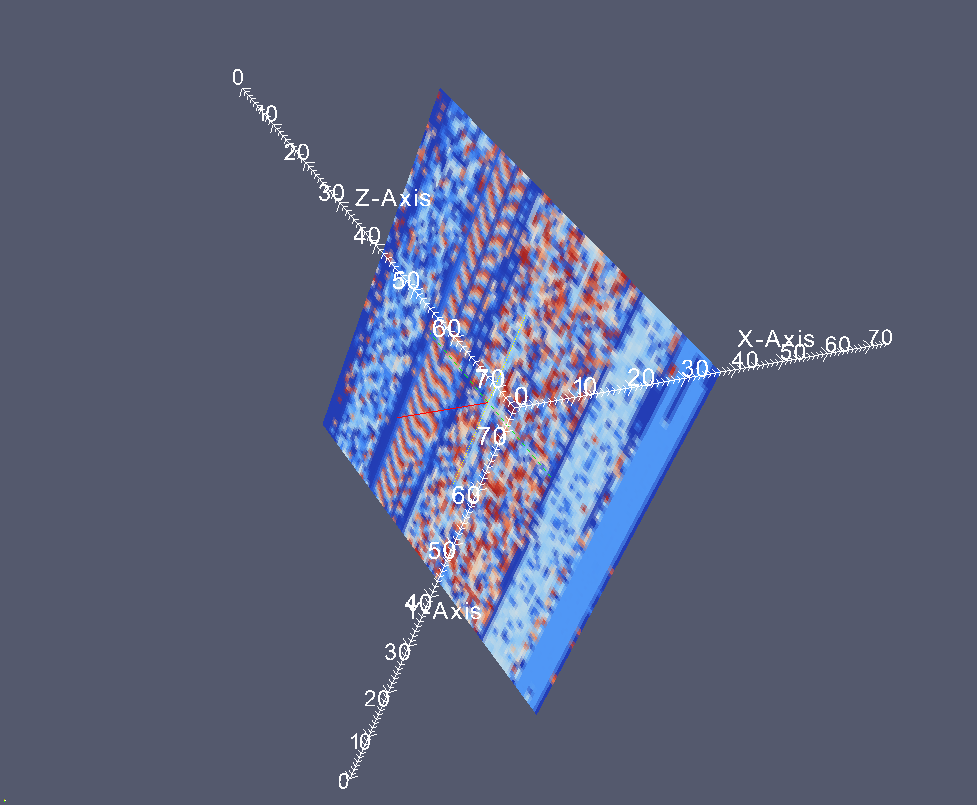
Wireframe view
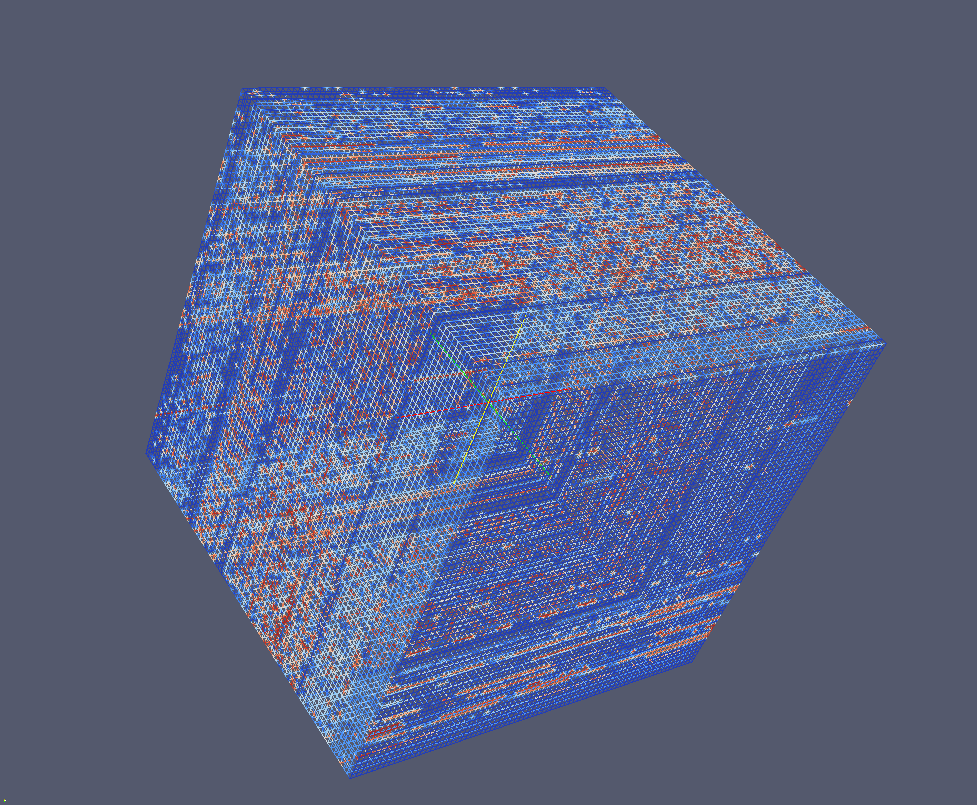
Surface view
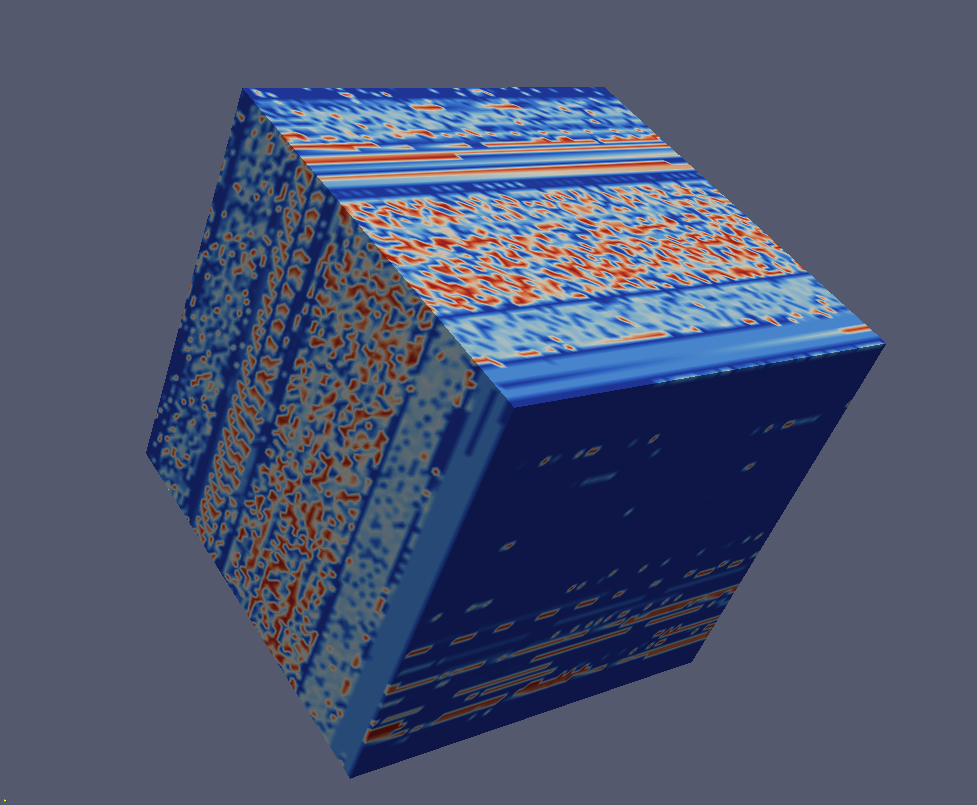
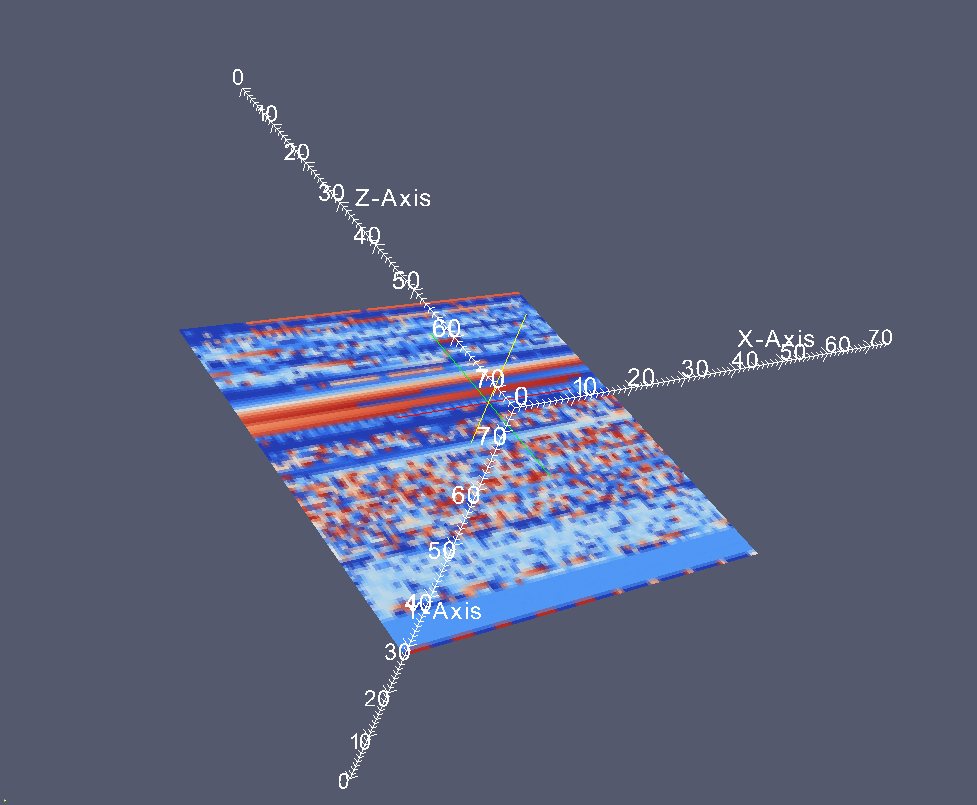
Surface + edges view
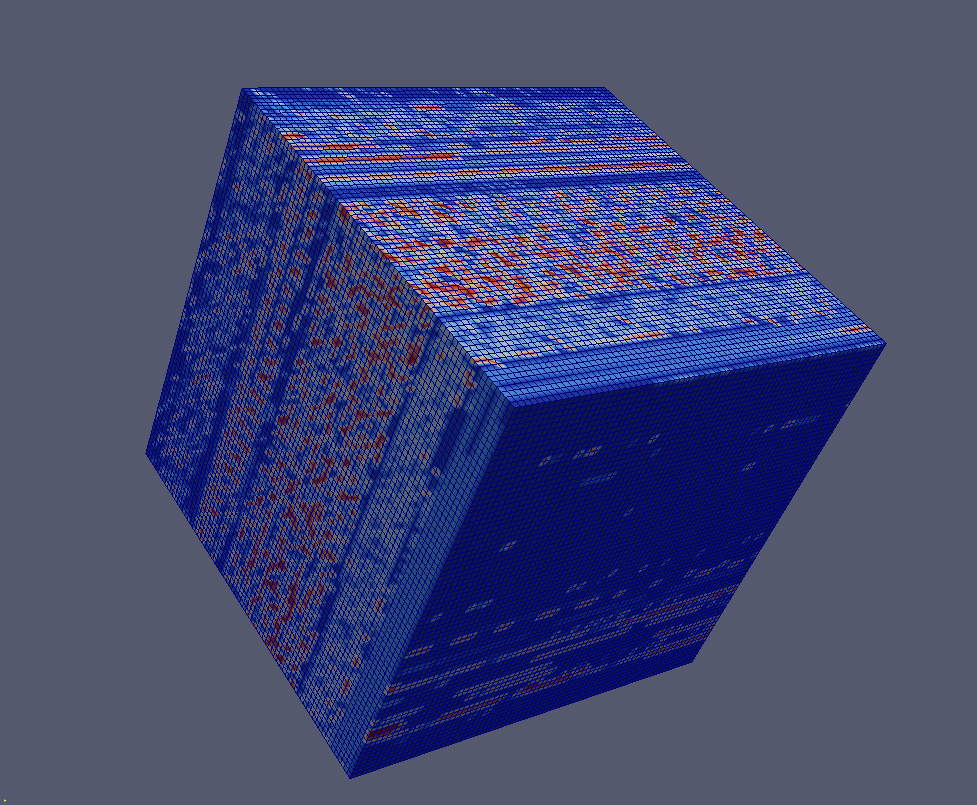
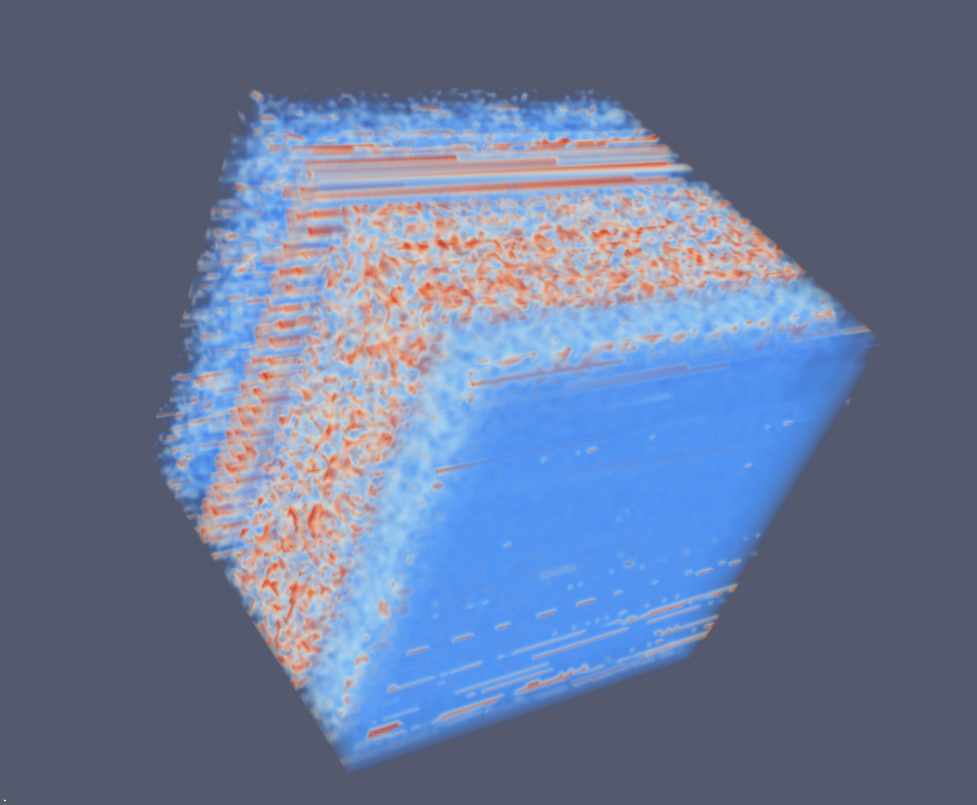
Volume view
The chosen 3D folding shows varying 2D landscape in XY plane but almost constant landscape in YZ and XZ slices:
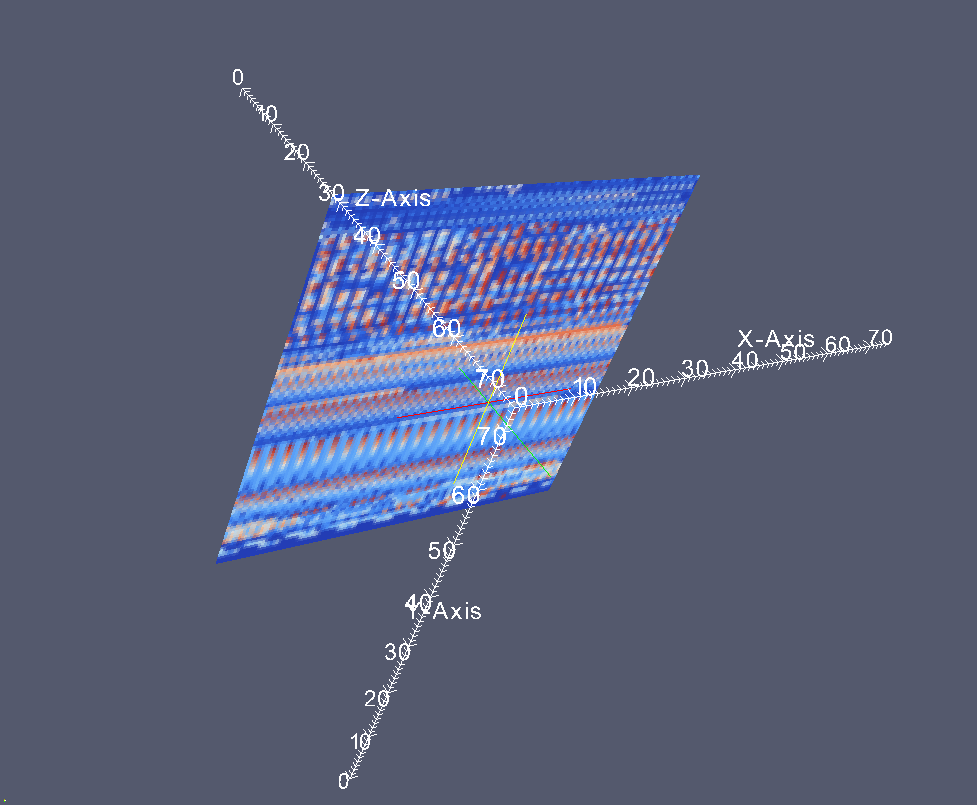
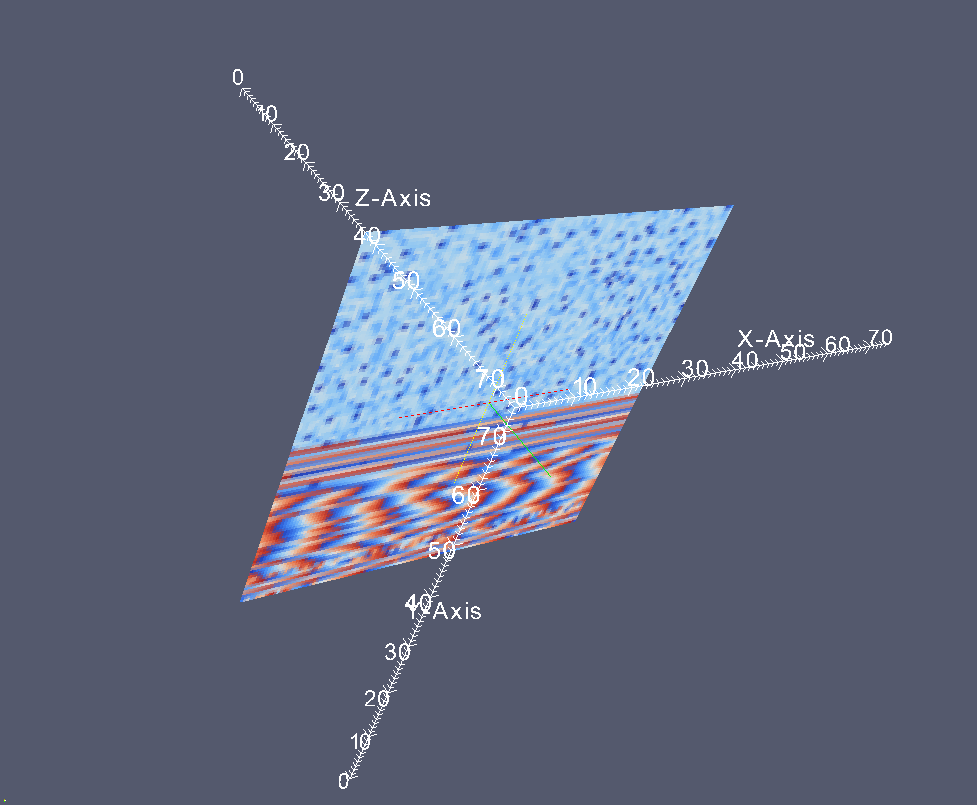
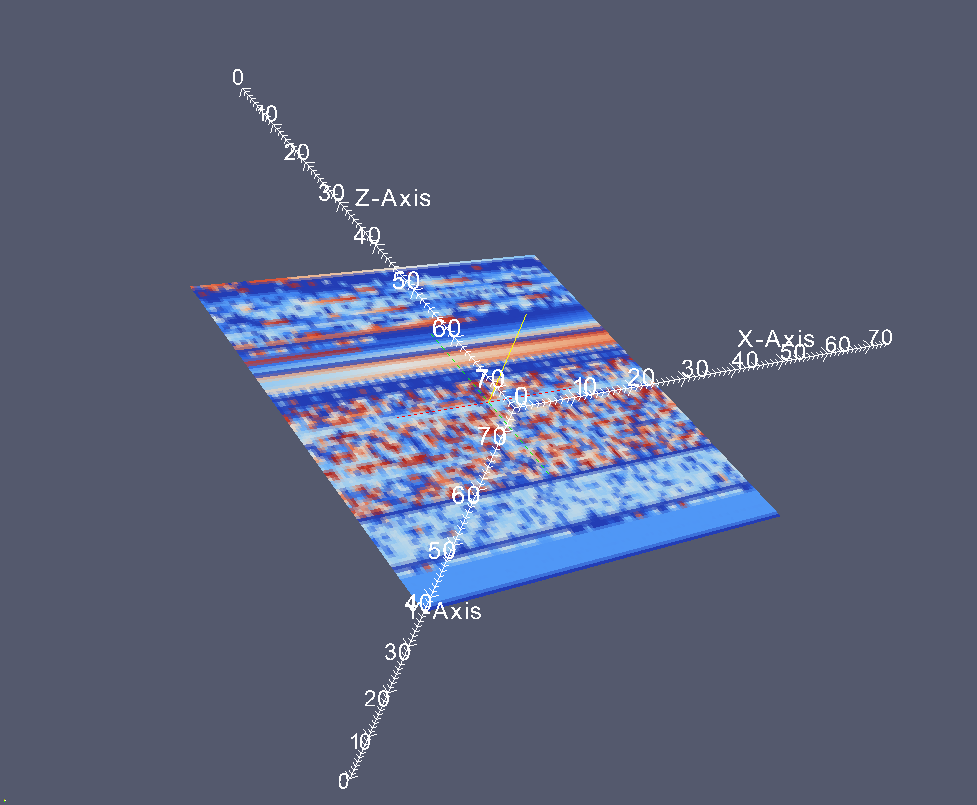
More effects.
Contour view
Process DNA view

- Dmitry Vostokov @ DumpAnalysis.org -
Memory Space Music
Thursday, July 16th, 2009I was trying hard to name the music style or genre related to memory dumps and computer memory (physical and virtual). The problem is that in this area of electronic and electroacoustic music most good names were already taken. Some candidates that came to my mind were just MUSIC (My User Space IC) or IRQL Music. Finally I decided to name it simply: Memory Space Music. Stay tuned to future samples dug out from memory spaces.
- Dmitry Vostokov @ DumpAnalysis.org -