Bugtation No.67
Thursday, November 20th, 2008Easy to remember 67th bugtation: 6 days and 7 nights and especially
“Seven” debugging “nights.”

- Dmitry Vostokov @ DumpAnalysis.org -
Easy to remember 67th bugtation: 6 days and 7 nights and especially
“Seven” debugging “nights.”
- Dmitry Vostokov @ DumpAnalysis.org -
DumpAnalysis.org jointly with OpenTask publisher announces forthcoming 2009 as
The Year of Debugging
More plans and projects will be announced soon with the new updated publishing roadmap! Stay tuned.
- Dmitry Vostokov @ DumpAnalysis.org -
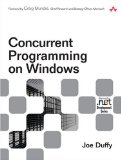
Got this book yesterday in the post and started reading. Table of contents is amazing for its practical depth and breadth. If you want me to provide a review in a language of concurrency (I’m reading many books in parallel) I would simply say one word:
Priority!
It simply means priority reading for any Windows software developer and maintainer. Invaluable for any engineer debugging complex software problems and analyzing Windows crash dumps. Simply because Microsoft OS and CLR developers use all this concurrent stuff and best practices described in the book so it is vital to be able recognize them in memory dumps. After reading this book you also get priority boost in your understanding of process and thread dynamics and your ability to plan, architect, design and implement concurrent applications and services.
Concurrent Programming on Windows (Microsoft .NET Development Series)
- Dmitry Vostokov @ DumpAnalysis.org -
“The” computer “is the only place where” a crash “comes before” hang.
Anonymous American Saying
- Dmitry Vostokov @ DumpAnalysis.org -
“… the” debugger “(my almighty” application ”) …”
Thomas Jefferson, TO JAMES MONROE, Paris Mar. 18. 1785
- Dmitry Vostokov @ DumpAnalysis.org -
“Avoid” crashes and hangs, “but do not seek” total stability “- nothing so expensive as” total stability.
Sydney Smith, A Memoir of the Reverend Sydney Smith by his daughter, Lady Holland, with a Selection from his Letters
- Dmitry Vostokov @ DumpAnalysis.org -
“How can you say my” computation “is not a success?” Has it “not for more than sixty” days “got enough to” process “and escaped being” crashed?
Logan Pearsall Smith, Last Words
- Dmitry Vostokov @ DumpAnalysis.org -
Recently I got another manual complete memory dump from a hang workstation where default analysis pointed to a possibility for a Spiking Thread pattern:
0: kd> !analyze -v

[...]

MANUALLY_INITIATED_CRASH (e2)

The user manually initiated this crash dump.

Arguments:

Arg1: 00000000

Arg2: 00000000

Arg3: 00000000

Arg4: 00000000

[...]

GetContextState failed, 0x80070026

Unable to read selector for PCR for processor 1

GetContextState failed, 0x80070026

Unable to read selector for PCR for processor 1
PROCESS_NAME: AppA.exe
CURRENT_IRQL: 0
LAST_CONTROL_TRANSFER: from 808b73a4 to 808b72cb
STACK_TEXT:

f46f5b44 808b73a4 e1a36008 00000004 00000018 nt!HvpFindFreeCellInThisViewWindow+0xd7

f46f5b6c 808bd07b e1a36008 00000002 00000018 nt!HvpFindFreeCell+0x98

f46f5b98 808bd588 e1a36008 e1a362fc 00000000 nt!HvpDoAllocateCell+0x69

f46f5bbc 808d0b22 e1a36008 009214a0 c94e24a4 nt!HvReallocateCell+0x9a

f46f5bdc 808c1028 e1a36008 051fa3e8 00000003 nt!CmpAddValueToList+0x46

f46f5c28 808c406a e1a36008 cddb7ccc f46f5d0c nt!CmpSetValueKeyNew+0xfa

f46f5cb4 808b7e2f e45872e0 f46f5d0c 00000004 nt!CmSetValueKey+0x426

f46f5d44 8088978c 00000438 0012fad0 00000000 nt!NtSetValueKey+0x241

f46f5d44 7c8285ec 00000438 0012fad0 00000000 nt!KiFastCallEntry+0xfc

0012fa58 7c827b7b 77f77703 00000438 0012fad0 ntdll!KiFastSystemCallRet

0012fa5c 77f77703 00000438 0012fad0 00000000 ntdll!ZwSetValueKey+0xc

0012faa0 77f5ec90 00000438 0012fad0 00000004 ADVAPI32!LocalBaseRegSetValue+0x12c

0012fb04 60072e40 00000438 6290c0c4 00000000 ADVAPI32!RegSetValueExA+0x160

WARNING: Stack unwind information not available. Following frames may be wrong.

0012fbf4 628e2d57 60062e70 60062b40 80000001 DLLA!GetObjectId+0×9600

[…]
FOLLOWUP_IP:

nt!HvpFindFreeCellInThisViewWindow+d7

808b72cb 034508          add     eax,dword ptr [ebp+8]
Looking at this thread information we see it RUNNING (this is also evident from its call stack):
0: kd> !thread

THREAD 8a0b2890  Cid 0814.10e8  Teb: 7ffdf000 Win32Thread: bc217c68 RUNNING on processor 0

Not impersonating

DeviceMap                 e440acc0

Owning Process            8a0d85f8       Image:         AppA.exe

Wait Start TickCount      153974         Ticks: 0

Context Switch Count      16905                 LargeStack

UserTime                  00:00:03.109

KernelTime                00:00:17.500

[…]
We also see that the thread accumulated 17 seconds as time spent in kernel. Switching to AppA process context and looking at its Image version we see that it is 5.80.x:
0: kd> lmv m AppA

start    end        module name

00400000 0049c000   AppA   (deferred)

    Image path: C:\PROGRA~1\AppA\AppA.exe

    Image name: AppA.exe

    Timestamp:        Thu Jun 05 14:51:52 2008 (4847EF78)

    CheckSum:         0009D068

    ImageSize:        0009C000

    File version:     5.80.5.1764

    Product version:  5.80.0.0
However from Google search we can find that there is newer version available (variant of Not My Version pattern) and even some indication on various forums that the older ones had problems with CPU resource utilization. We may stop here but I usually scan all threads for any suspicious signs and we can see another running thread on the second CPU:
THREAD 8a2ed5d0  Cid 11b4.1100  Teb: 7ffdf000 Win32Thread: bc342b80 RUNNING on processor 1

Not impersonating

DeviceMap                 e44fc100

Owning Process            8a1efcb0       Image:         calc.exe

Wait Start TickCount      153973         Ticks: 1 (0:00:00:00.015)

Context Switch Count      50736                 LargeStack

UserTime                  00:01:04.515

KernelTime                00:00:00.015

Win32 Start Address calc (0×0101e23a)

Start Address kernel32!BaseProcessStartThunk (0×77e617f8)

Stack Init f4cd6000 Current f4cd5d00 Base f4cd6000 Limit f4cd1000 Call 0

Priority 6 BasePriority 6 PriorityDecrement 0

Unable to get context for thread running on processor 1, Win32 error 0n38
We also see that this thread spent more than a minute in user mode. Unfortunately we cannot see its thread stack because the dump shows signs of Truncated Dump pattern:
Loading Dump File [MEMORY.DMP]

Kernel Complete Dump File: Full address space is available
************************************************************

WARNING: Dump file has been truncated.  Data may be missing.

************************************************************

[…]
0: kd> ~1

GetContextState failed, 0×80070026

Unable to read selector for PCR for processor 1

WARNING: Unable to reset page directories

GetContextState failed, 0×80070026

GetContextState failed, 0×80070026

GetContextState failed, 0×80070026

Unable to get program counter

GetContextState failed, 0×80070026

Unable to get current machine context, Win32 error 0n38

GetContextState failed, 0×80070026

GetContextState failed, 0×80070026

GetContextState failed, 0×80070026

GetContextState failed, 0×80070026

GetContextState failed, 0×80070026

GetContextState failed, 0×80070026

GetContextState failed, 0×80070026

GetContextState failed, 0×80070026

GetContextState failed, 0×80070026
The dump file size 4,177,920 Kb is less than amount of physical memory 4,192,948 Kb:
1: kd> !vm

GetContextState failed, 0x80070026

GetContextState failed, 0x80070026

GetContextState failed, 0x80070026

Unable to get program counter
*** Virtual Memory Usage ***

 Physical Memory:     1048237 (   4192948 Kb)

 Page File: \??\R:\pagefile.sys

   Current:   4177920 Kb  Free Space:   4154440 Kb

   Minimum:   4177920 Kb  Maximum:      4194304 Kb
We can stop here and still recommend to upgrade AppA product seen from the thread running on the first processor but the fact that the second thread belongs to innocent calc.exe demands some attention. Was it calculating incessantly some financial figures following button clicks from a financial genius? Taking advantage of a complete memory dump and the fact that this process spent most of the time in user space we can check for Hooked Functions pattern:
1: kd> .process /r /p 8a1efcb0

Implicit process is now 8a1efcb0

Loading User Symbols

..........................

GetContextState failed, 0x80070026

GetContextState failed, 0x80070026

GetContextState failed, 0x80070026

GetContextState failed, 0x80070026

GetContextState failed, 0x80070026

GetContextState failed, 0x80070026

GetContextState failed, 0x80070026

GetContextState failed, 0x80070026

GetContextState failed, 0x80070026

GetContextState failed, 0x80070026

GetContextState failed, 0x80070026

GetContextState failed, 0x80070026
1: kd> !chkimg -lo 50 -d !user32 -v

GetContextState failed, 0x80070026

GetContextState failed, 0x80070026

GetContextState failed, 0x80070026

Unable to get program counter

Searching for module with expression: !user32

Will apply relocation fixups to file used for comparison

Will ignore NOP/LOCK errors

Will ignore patched instructions

Image specific ignores will be applied

Comparison image path: c:\mss\USER32.dll\45D70AC791000\USER32.dll

No range specified
Scanning section:    .text

Size: 392891

Range to scan: 77381000-773e0ebb

    7738c341-7738c345  5 bytes - USER32!CreateWindowExA

 [ 8b ff 55 8b ec:e9 ba 3c 00 c0 ]

[…]

Total bytes compared: 73728(18%)

Number of errors: 75

75 errors : !user32 (7738c341-773a154d)

GetContextState failed, 0×80070026

GetContextState failed, 0×80070026

GetContextState failed, 0×80070026

GetContextState failed, 0×80070026

GetContextState failed, 0×80070026

GetContextState failed, 0×80070026
1: kd> u 7738c341

USER32!CreateWindowExA:

7738c341 e9ba3c00c0      jmp     37390000

7738c346 6801000040      push    40000001h

7738c34b ff7534          push    dword ptr [ebp+34h]

7738c34e ff7530          push    dword ptr [ebp+30h]

7738c351 ff752c          push    dword ptr [ebp+2Ch]

7738c354 ff7528          push    dword ptr [ebp+28h]

7738c357 ff7524          push    dword ptr [ebp+24h]

7738c35a ff7520          push    dword ptr [ebp+20h]

GetContextState failed, 0×80070026

GetContextState failed, 0×80070026

GetContextState failed, 0×80070026
1: kd> u 37390000

37390000 e96b91562e      jmp     HookA!CreateWindowExA (658f9170)

37390005 8bff            mov     edi,edi

37390007 55              push    ebp

37390008 8bec            mov     ebp,esp

3739000a e937c3ff3f      jmp     USER32!CreateWindowExA+0×5 (7738c346)

3739000f 0000            add     byte ptr [eax],al

37390011 0000            add     byte ptr [eax],al

37390013 0000            add     byte ptr [eax],al

GetContextState failed, 0×80070026

GetContextState failed, 0×80070026

GetContextState failed, 0×80070026

GetContextState failed, 0×80070026

GetContextState failed, 0×80070026

GetContextState failed, 0×80070026
Indeed we see that HookA module is involved and we can recommend to test the stability of the system without the product that uses it or upgrading or disabling this component.
- Dmitry Vostokov @ DumpAnalysis.org -
“To” debug “is to” code “twice.”
Joseph Joubert, Pensées
- Dmitry Vostokov @ DumpAnalysis.org -
“Impatient” engineers “always” debug “too late.”
Jean Gwenaël Dutourd, Le Fond et la Forme, essai alphabétique sur la morale et sur le style
- Dmitry Vostokov @ DumpAnalysis.org -
While working on WinDbg command cards and even before that when compiling a comparison table for both WinDbg and GDB I came to an idea of abstract debugging commands that correspond to common debugging tasks, have clear syntax and semantics and serve metaphorically as a basis for conversion of analog thinking to digital debugger assistance (see analog-to-digital conversion for ADC abbreviation). Here a WinDbg extension can help but now I think about using a tree-based approach similar to CMDTREE.TXT for CDA Checklist. More on this later. Any comments or suggestions are greatly appreciated.
- Dmitry Vostokov @ DumpAnalysis.org -
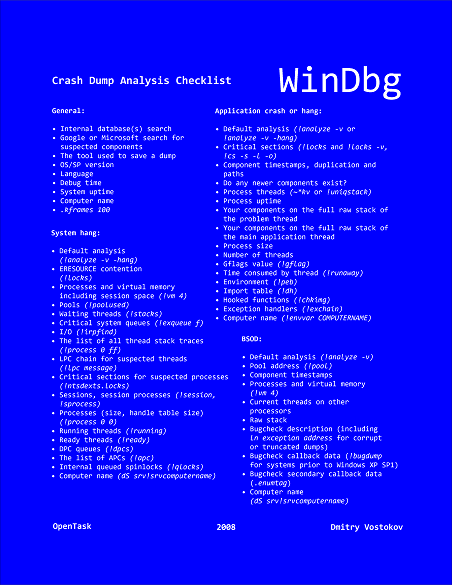
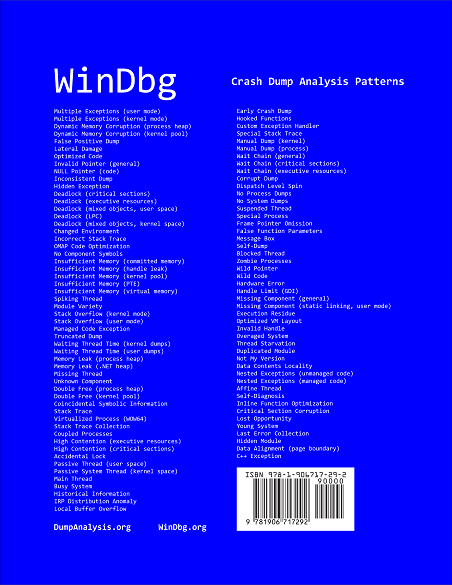
Suddenly the course of my publishing activities bended a little to produce a DIY poster and learning cards to be published soon. Here are the product details:
Annotation:
WinDbg is a powerful debugger from Microsoft Debugging Tools for Windows. It has more than 350 commands that can be used in different debugging scenarios. The cover of this book is a poster featuring crash dump analysis checklist and common patterns seen in memory dumps and live debugging sessions. Inside the book you can find ready to cut learning cards with commands and their descriptions coloured according to their use for crash dump or live debugging sessions and user, kernel or complete memory dumps. Tossing cards can create unexpected connections between commands and help to learn them more quickly. Uncut pages can also serve as birds eye view to WinDbg debugging capabilities. More than 350 WinDbg commands including meta-commands and extensions are included.
Front cover:
Back cover:
After you take inside pages out you are left with a cover that you can use as a crash dump analysis checklist and patterns poster:
I also plan to update this book on a yearly basis.
- Dmitry Vostokov @ DumpAnalysis.org -
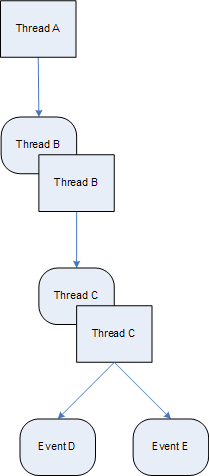
Another example of Wait Chain pattern for objects with ownership semantics is seen in kernel and complete memory dumps where threads are waiting for thread objects. A thread object is a synchronization object whose owner is a thread so they can be easily identified. For example, the main application thread is waiting for an object:
1: kd> !thread 8818e660 16

THREAD 8818e660  Cid 1890.1c50  Teb: 7ffdf000 Win32Thread: b8411008 WAIT: (Unknown) UserMode Non-Alertable

    87d569d8  Thread

    8818e6d8  NotificationTimer

Not impersonating

DeviceMap                 e10008d8

Owning Process            87db5d88       Image:         App.exe

Wait Start TickCount      299006         Ticks: 255 (0:00:00:03.984)

Context Switch Count      1208                 LargeStack

UserTime                  00:00:00.203

KernelTime                00:00:00.203

Start Address kernel32!BaseThreadStartThunk (0×77e617ec)

Stack Init b42c3000 Current b42c2c60 Base b42c3000 Limit b42be000 Call 0

Priority 15 BasePriority 15 PriorityDecrement 0

ChildEBP RetAddr  Args to Child

b42c2c78 80833e8d 8818e660 8818e708 00000003 nt!KiSwapContext+0×26

b42c2ca4 80829b74 00000000 b42c2d14 00000000 nt!KiSwapThread+0×2e5

b42c2cec 8093b034 87d569d8 00000006 00804c01 nt!KeWaitForSingleObject+0×346

b42c2d50 8088ac4c 000001ec 00000000 b42c2d14 nt!NtWaitForSingleObject+0×9a

b42c2d50 7c8285ec 000001ec 00000000 b42c2d14 nt!KiFastCallEntry+0xfc

0006fde4 7c827d0b 77e61d1e 000001ec 00000000 ntdll!KiFastSystemCallRet

0006fde8 77e61d1e 000001ec 00000000 0006fe2c ntdll!NtWaitForSingleObject+0xc

0006fe58 77e61c8d 000001ec 00001388 00000000 kernel32!WaitForSingleObjectEx+0xac

0006fe6c 01039308 000001ec 00001388 00000000 kernel32!WaitForSingleObject+0×12

0006fe94 010204ac 0007cc00 00000001 00000002 App!WaitForNotifyList+0xf2

[…]
However that object is a thread too:
THREAD 87d569d8  Cid 1890.1ec0  Teb: 7ffd9000 Win32Thread: b869ba48 WAIT: (Unknown) UserMode Non-Alertable

    8a1f8870  Thread
Therefore, we see that thread 8818e660 is waiting for another thread 87d569d8 which belongs to the same process with PID 1890 and thread 87d569d8 itself is waiting for thread 8a1f8870 which has the following stack trace:
1: kd> !thread 8a1f8870 16

THREAD 8a1f8870  Cid 1890.07d8  Teb: 7ff95000 Win32Thread: 00000000 WAIT: (Unknown) UserMode Non-Alertable

    8a0ce4c0  NotificationEvent

    886f1870  NotificationEvent

Not impersonating

DeviceMap                 e10008d8

Owning Process            87db5d88       Image:         App.exe

Wait Start TickCount      292599         Ticks: 6662 (0:00:01:44.093)

Context Switch Count      17

UserTime                  00:00:00.000

KernelTime                00:00:00.000

Win32 Start Address Dll!StartMonitoring (0×758217b8)

Start Address kernel32!BaseThreadStartThunk (0×77e617ec)

Stack Init b6d4f000 Current b6d4e900 Base b6d4f000 Limit b6d4c000 Call 0

Priority 14 BasePriority 13 PriorityDecrement 0

ChildEBP RetAddr  Args to Child

b6d4e918 80833e8d 8a1f8870 00000002 00140000 nt!KiSwapContext+0×26

b6d4e944 808295ab 8a1f8870 00000002 00000000 nt!KiSwapThread+0×2e5

b6d4e978 8093b290 00000002 b6d4eaac 00000001 nt!KeWaitForMultipleObjects+0×3d7

b6d4ebf4 8093b3f2 00000002 b6d4ec1c 00000001 nt!ObpWaitForMultipleObjects+0×202

b6d4ed48 8088ac4c 00000002 026bfc08 00000001 nt!NtWaitForMultipleObjects+0xc8

b6d4ed48 7c8285ec 00000002 026bfc08 00000001 nt!KiFastCallEntry+0xfc

026bfbb8 7c827cfb 77e6202c 00000002 026bfc08 ntdll!KiFastSystemCallRet

026bfbbc 77e6202c 00000002 026bfc08 00000001 ntdll!NtWaitForMultipleObjects+0xc

026bfc64 77e62fbe 00000002 026bfca4 00000000 kernel32!WaitForMultipleObjectsEx+0×11a

026bfc80 6554a01f 00000002 026bfca4 00000000 kernel32!WaitForMultipleObjects+0×18

026bfcfc 758237a3 cd050002 ffffffff 026bfd4c Dll!GetStatusChange+0×7bf

026bffb8 77e64829 75833120 00000000 00000000 Dll!StartMonitoring+0×14b

026bffec 00000000 758217b8 75833120 00000000 kernel32!BaseThreadStart+0×34
Thread 8a1f8870 is waiting for two notification events disjointly which is confirmed by dumping WaitForMultipleObjects arguments. Neither of them is in signaled state and one is a named event “MyEventObject”:
1: kd> dd 026bfc08 l2

026bfc08  0000008c 00000084
1: kd> !handle 0000008c

processor number 1, process 87db5d88

PROCESS 87db5d88  SessionId: 4  Cid: 1890    Peb: 7ffdc000  ParentCid: 01d0

    DirBase: cfe438e0  ObjectTable: e178c228  HandleCount: 439.

    Image: App.exe
Handle table at e50d2000 with 439 Entries in use

008c: Object: 8a0ce4c0  GrantedAccess: 001f0003 Entry: e50d2118

Object: 8a0ce4c0  Type: (8b26ec00) Event

    ObjectHeader: 8a0ce4a8 (old version)

        HandleCount: 1  PointerCount: 3
1: kd> !handle 00000084

processor number 1, process 87db5d88

PROCESS 87db5d88  SessionId: 4  Cid: 1890    Peb: 7ffdc000  ParentCid: 01d0

    DirBase: cfe438e0  ObjectTable: e178c228  HandleCount: 439.

    Image: App.exe
Handle table at e50d2000 with 439 Entries in use

0084: Object: 886f1870  GrantedAccess: 001f0003 (Inherit) Entry: e50d2108

Object: 886f1870  Type: (8b26ec00) Event

    ObjectHeader: 886f1858 (old version)

        HandleCount: 1  PointerCount: 4

        Directory Object: e43ee320  Name: MyEventObject
1: kd> dt _DISPATCHER_HEADER 8a0ce4c0

cutildll!_DISPATCHER_HEADER

   +0×000 Type             : 0 ”

   +0×001 Absolute         : 0 ”

   +0×002 Size             : 0×4 ”

   +0×003 Inserted         : 0 ”

   +0×003 DebugActive      : 0 ”

   +0×000 Lock             : 262144

   +0×004 SignalState      : 0

   +0×008 WaitListHead     : _LIST_ENTRY [ 0×88519d18 - 0×8a1f8918 ]
1: kd> dt _DISPATCHER_HEADER 886f1870

cutildll!_DISPATCHER_HEADER

   +0×000 Type             : 0 ”

   +0×001 Absolute         : 0 ”

   +0×002 Size             : 0×4 ”

   +0×003 Inserted         : 0 ”

   +0×003 DebugActive      : 0 ”

   +0×000 Lock             : 262144

   +0×004 SignalState      : 0

   +0×008 WaitListHead     : _LIST_ENTRY [ 0×88519d30 - 0×8a1f8930 ]
Here is a diagram showing this wait chain:
- Dmitry Vostokov @ DumpAnalysis.org -
CtxHideEx32 tool has been updated to the version 1.1 and can be downloaded from Citrix support. It now allows a substring search for a window title or class, for example:
CtxHideEx32.exe HIDE "*error" "" OK
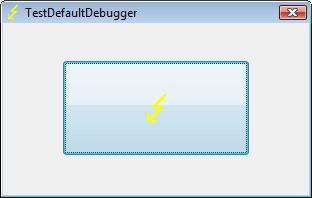
As by-product coupled with an optional command line I discovered that it allows to automatically dump any process displaying a message box with an error message in its window title. Here is an example using TestDefaultDebugger64 to simulate an application fault message where the following instance of CtxHideEx32 was setup to dump a process showing WER dialog on Vista:
CtxHideEx32.exe NONE "*Microsoft Windows" "" "C:\kktools\userdump8.1\x64\userdump.exe %d"
We click on a big lightning button:
and then WER dialog appears:
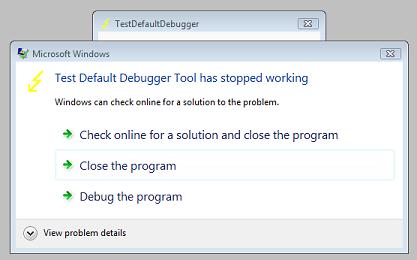
Immediately CtxHideEx32 kicks in and starts dumping the owner process incessantly so you better to dismiss this dialog by choosing something:
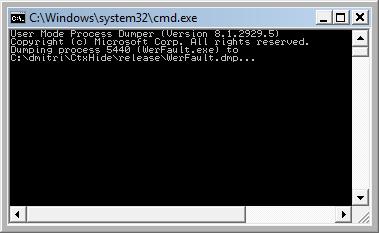
We see it was WerFault.exe.
Note: I think I have to amend CtxHideEx32 to make it wait until the spawned command line interpreter finishes its job. Stay tuned.
- Dmitry Vostokov @ DumpAnalysis.org -
As I mentioned in comments to Lateral Damage pattern it lies in between the normal healthy dump files and corrupt dumps. For example, the following 8Gb complete memory dump that fits perfectly into 16Gb page file had the problem of missing processor control region making it impossible to get meaningful information from certain WinDbg commands:
0: kd> !analyze -v
[...]
UNEXPECTED_KERNEL_MODE_TRAP (7f)

This means a trap occurred in kernel mode, and it's a trap of a kind

that the kernel isn't allowed to have/catch (bound trap) or that

is always instant death (double fault).  The first number in the

bugcheck params is the number of the trap (8 = double fault, etc)

Consult an Intel x86 family manual to learn more about what these

traps are. Here is a *portion* of those codes:

If kv shows a taskGate

        use .tss on the part before the colon, then kv.

Else if kv shows a trapframe

        use .trap on that value

Else

        .trap on the appropriate frame will show where the trap was taken

        (on x86, this will be the ebp that goes with the procedure KiTrap)

Endif

kb will then show the corrected stack.

Arguments:

Arg1: 00000008, EXCEPTION_DOUBLE_FAULT

Arg2: f7727fe0

Arg3: 00000000

Arg4: 00000000
Debugging Details:

------------------
Unable to read selector for PCR for processor 1

Unable to read selector for PCR for processor 3

Unable to read selector for PCR for processor 1

Unable to read selector for PCR for processor 3
[...]
STACK_TEXT:

WARNING: Stack unwind information not available. Following frames may be wrong.

8089a600 8088ddf2 00000000 0000000e 00000000 processr+0x2886

8089a604 00000000 0000000e 00000000 00000000 nt!KiIdleLoop+0xa
[...]
0: kd> ~1

Unable to read selector for PCR for processor 1

WARNING: Unable to reset page directories
1: kd> !pcr

Unable to read selector for PCR for processor 1

Cannot get PRCB address
1: kd> kv

ChildEBP RetAddr  Args to Child

WARNING: Frame IP not in any known module. Following frames may be wrong.

00000000 00000000 00000000 00000000 00000000 0×0
The bugcheck argument 1 shows that we have a double fault that most often results from kernel stack overflow. If we go back to processor 0 to inspect its TSS we don’t get meaningful results too (we expect the value of Backlink to be 0×28):
0: kd> !pcr

KPCR for Processor 0 at ffdff000:

    Major 1 Minor 1

 NtTib.ExceptionList: ffffffff

     NtTib.StackBase: 00000000

    NtTib.StackLimit: 00000000

  NtTib.SubSystemTib: 80042000

       NtTib.Version: 2a1b0b08

   NtTib.UserPointer: 00000001

       NtTib.SelfTib: 00000000
             SelfPcr: ffdff000

                Prcb: ffdff120

                Irql: 0000001f

                 IRR: 00000000

                 IDR: ffffffff

       InterruptMode: 00000000

                 IDT: 8003f400

                 GDT: 8003f000

                 TSS: 80042000
       CurrentThread: 8089d8c0

          NextThread: 00000000

          IdleThread: 8089d8c0
DpcQueue:
0: kd> dt _KTSS 80042000

nt!_KTSS

   +0×000 Backlink         : 0xc45

   +0×002 Reserved0        : 0×4d8a

   +0×004 Esp0             : 0×8089a6a0

   +0×008 Ss0              : 0×10

   +0×00a Reserved1        : 0xb70f

   +0×00c NotUsed1         : [4] 0×5031ff00

   +0×01c CR3              : 0×8b55ff8b

   +0×020 Eip              : 0xc75ffec

   +0×024 EFlags           : 0xe80875ff

   +0×028 Eax              : 0xfffffbdd

   +0×02c Ecx              : 0×1b75c084

   +0×030 Edx              : 0×8b184d8b

   +0×034 Ebx              : 0×7d8b57d1

   +0×038 Esp              : 0×2e9c110

   +0×03c Ebp              : 0xf3ffc883

   +0×040 Esi              : 0×83ca8bab

   +0×044 Edi              : 0xaaf303e1

   +0×048 Es               : 0xeb5f

   +0×04a Reserved2        : 0×6819

   +0×04c Cs               : 0×24fc

   +0×04e Reserved3        : 0×44

   +0×050 Ss               : 0×75ff

   +0×052 Reserved4        : 0xff18

   +0×054 Ds               : 0×1475

   +0×056 Reserved5        : 0×75ff

   +0×058 Fs               : 0xff10

   +0×05a Reserved6        : 0xc75

   +0×05c Gs               : 0×75ff

   +0×05e Reserved7        : 0xe808

   +0×060 LDT              : 0

   +0×062 Reserved8        : 0xffff

   +0×064 Flags            : 0

   +0×066 IoMapBase        : 0×20ac

   +0×068 IoMaps           : [1] _KiIoAccessMap

   +0×208c IntDirectionMap  : [32]  “???”
However if we try to list all thread stacks we see one thread running on processor 1:
0: kd> !process 0 ff
[...]
THREAD 8a241db0  Cid 1218.4420  Teb: 00000000 Win32Thread: 00000000 RUNNING on processor 1

IRP List:

   8b200008: (0006,0244) Flags: 00000884  Mdl: 00000000

   89beedb8: (0006,0244) Flags: 00000884  Mdl: 00000000

Not impersonating

DeviceMap                 e1002060

Owning Process            8bc63d88       Image:         svchost.exe

Wait Start TickCount      10242012       Ticks: 0

Context Switch Count      1832

UserTime                  00:00:00.000

KernelTime                00:00:00.046

Start Address termdd (0xf75cc218)

Stack Init 9c849000 Current 9c846938 Base 9c849000 Limit 9c846000 Call 0

Priority 11 BasePriority 10 PriorityDecrement 0

Unable to read selector for PCR for processor 1
[...]
Now we can look at its raw stack to see execution residue and try to reconstruct partial stack traces:
0: kd> dds 9c846000  9c849000

9c846000  94040001

9c846004  00000014

9c846008  8d147848

9c84600c  8d0bfd08

9c846010  8d0bfd00

9c846014  00000001

9c846018  8d0bfd08

9c84601c  8d0bfd00

9c846020  8d0bfd00

9c846024  9c846034

9c846028  80a5c456 hal!KfLowerIrql+0×62

9c84602c  8d0bfdd8

9c846030  8d0bfd00

9c846034  9c846060

9c846038  80a5a56d hal!KeReleaseQueuedSpinLock+0×2d

9c84603c  00000011

9c846040  00000001

9c846044  8a241db0

9c846048  0000000e

9c84604c  00000000

9c846050  8d0bfdc0

9c846054  05000000

9c846058  00007400

9c84605c  00000001

9c846060  9c846084

9c846064  808b6138 driverA!MapData+0×4a

9c846068  8d0bfd08

9c84606c  00007400

9c846070  00000000

9c846074  00000018

9c846078  00000028

9c84607c  00001000

9c846080  00000018

9c846084  9c84609c

9c846088  f7b8f2e5 driverB!CheckData+0×7a

9c84608c  01b47538

9c846090  00000028

9c846094  0000001c

[…]
0: kd> k L=9c846024 9c846024 9c846024

ChildEBP RetAddr

WARNING: Frame IP not in any known module. Following frames may be wrong.

9c846024 80a5c456 0×9c846024

9c846034 80a5a56d hal!KfLowerIrql+0×62

9c8460f0 8080d164 hal!KeReleaseQueuedSpinLock+0×2d

9c846060 808b6138 driverA!RemapData+0×3e

9c846084 f7b8f2e5 driverA!MapData+0×4a

9c84609c f7b8f340 driverB!CheckData+0×7a

9c8460e4 808b4000 driverB!CheckAttributes+0×36f

9c84610c f7b8e503 driverB!AddToRecord+0×2a

9c846174 f7b90df0 driverB!ReadRecord+0×1d0

f7b8e508 90909090 driverB!ReadAllRecords+0×7a

[…]
Using the current stack pointer we get another partial stack trace:
0: kd> k L=9c846034 9c846938 9c846938

ChildEBP RetAddr

WARNING: Frame IP not in any known module. Following frames may be wrong.

9c846954 8081df65 0×9c846938

9c846968 808f5437 nt!IofCallDriver+0×45

9c84697c 808ef963 nt!IopSynchronousServiceTail+0×10b

9c8469a0 8088978c nt!NtQueryDirectoryFile+0×5d

9c8469a0 8082f1c1 nt!KiFastCallEntry+0xfc

9c846a44 f5296f4b nt!ZwQueryDirectoryFile+0×11

9c846a90 f5297451 DriverC+0×2f4b

9c846adc f52a54cb DriverC+0×3451

9c846af8 f52a44e6 DriverC+0×114cb

9c846b1c f52b2941 DriverC+0×104e6

9c846b4c f52b2626 DriverC+0×1e941

9c846b88 f52a34a7 DriverC+0×1e626

9c846be8 f52a487c DriverC+0xf4a7

[…]
Using different base pointers for k command we can reconstruct different partial stack traces. We can also analyze the longest ones for any stack usage using variant of knf command that shows stack frame size in bytes and find drivers that consume the most of kernel stack. Because we see execution residue on top of the kernel stack (Limit) we can suspect this thread caused the actual stack overflow which resulted in the double fault bugcheck.
- Dmitry Vostokov @ DumpAnalysis.org -
Matthieu Suiche has released the new version of win32dd tool with the ability to save physical memory in a WinDbg-compliant memory dump file including pages that normally are not saved in a complete memory dump.
- Dmitry Vostokov @ DumpAnalysis.org -
This is an example of an almost totally bugtated quotation:
Blue Color “of” Crash.
- Dmitry Vostokov @ DumpAnalysis.org -
“Nothing would be more tiresome than” coding “and” debugging “if” evolution “had not made them a pleasure as well as a necessity.”
Voltaire, Dialogues philosophiques
- Dmitry Vostokov @ DumpAnalysis.org -
In part 1 we discussed the common mistake of not looking at full stack traces. In this part we discuss the common mistake of not looking at all stack traces. This is important when the dump is partially truncated or inconsistent. For example, in one complete memory dump from one hang system WinDbg !locks command is not able to traverse them at all due to truncated dump:
3: kd> !locks

**** DUMP OF ALL RESOURCE OBJECTS ****

KD: Scanning for held locks.......Error 1 in reading nt!_ERESOURCE.SystemResourcesList.Flink @ f71612a0
The common response, especially from beginners, would be to dismiss this dump and request the new one after increasing page file size. However, dumping all thread stacks reveals the resource contention around ERESOURCE objects similar to what was discussed in a mixed object deadlock example in kernel space:
3: kd> !stacks

Proc.Thread  .Thread  Ticks   ThreadState Blocker

[...]

                            [85973590 csrss.exe]

4138.0051e0  85961db0 00cb222 Blocked    driverA+0xec08

4138.0048c8  85d1d240 000006d Blocked    nt!ExEnterCriticalRegionAndAcquireResourceExclusive+0×19

4138.0054cc  85c8a840 00c0d50 Blocked    driverA+0xec08

4138.00227c  859be330 00c0d53 Blocked    driverA+0xec08

4138.0053d8  8590f458 00000df Blocked    nt!ExEnterCriticalRegionAndAcquireResourceExclusive+0×19

4138.003bb4  85b61020 00000e1 Blocked    nt!ExEnterCriticalRegionAndAcquireResourceExclusive+0×19

4138.002a08  85d1edb0 00000e1 Blocked    nt!ExEnterCriticalRegionAndAcquireResourceExclusive+0×19

4138.005e6c  85943020 00cc9cc Blocked    driverA+0xec08

4138.00575c  858eeb40 00c0d4e Blocked    driverA+0xec08

4138.003880  858ee5f8 00c0d51 Blocked    driverA+0xec08
                            [85bb9b18 winlogon.exe]

50e0.0054d4  85a8cb30 00c0d53 Blocked    driverA+0xec08

50e0.004b90  85b6c7b8 000001a Blocked    nt!ExEnterCriticalRegionAndAcquireResourceExclusive+0×19

50e0.0032cc  85a1f850 0000084 Blocked    nt!ExEnterCriticalRegionAndAcquireResourceExclusive+0×19

50e0.005450  85c43db0 0000014 Blocked    nt!ExEnterCriticalRegionAndAcquireResourceExclusive+0×19

50e0.005648  85a1f5e0 0000015 Blocked    nt!ExEnterCriticalRegionAndAcquireResourceExclusive+0×19

50e0.004a80  85a7abd8 000001b Blocked    nt!ExEnterCriticalRegionAndAcquireResourceExclusive+0×19

50e0.0036d8  85d886a8 000001b Blocked    nt!ExEnterCriticalRegionAndAcquireResourceExclusive+0×19

50e0.0055b0  85d88438 0000014 Blocked    nt!ExEnterCriticalRegionAndAcquireResourceExclusive+0×19

50e0.004380  85962020 00c0d53 Blocked    driverA+0xec08

50e0.005744  85a22db0 0000015 Blocked    nt!ExEnterCriticalRegionAndAcquireResourceExclusive+0×19

50e0.005dd4  8584c7a0 0000015 Blocked    nt!ExEnterCriticalRegionAndAcquireResourceExclusive+0×19

50e0.005e30  858902f0 0000018 Blocked    nt!ExEnterCriticalRegionAndAcquireResourceExclusive+0×19

50e0.005ce8  857bbdb0 00c0d53 Blocked    driverA+0xec08
                            [85914868 explorer.exe]

5fd8.005fdc  85911020 0000016 Blocked    nt!ExEnterCriticalRegionAndAcquireResourceExclusive+0×19

5fd8.005fec  8579d020 00bc253 Blocked    driverA+0xec08

5fd8.005ff8  857ce020 0000014 Blocked    nt!ExEnterCriticalRegionAndAcquireResourceExclusive+0×19

5fd8.003678  857ce8d0 00bc253 Blocked    driverA+0xec08

5fd8.00556c  857ce3f0 00b85d9 Blocked    driverA+0xec08

5fd8.005564  857e4db0 00bc253 Blocked    driverA+0xec08

5fd8.005548  86529380 00bc253 Blocked    driverA+0xec08

5fd8.006fd8  856095c8 00bc253 Blocked    driverA+0xec08

5fd8.001844  85d50020 00bc253 Blocked    driverA+0xec08

5fd8.0069cc  85ab8db0 000001a Blocked    nt!ExEnterCriticalRegionAndAcquireResourceExclusive+0×19

5fd8.0057c4  85fea2b0 00bc253 Blocked    driverA+0xec08

5fd8.00394c  85a475b8 00bc253 Blocked    driverA+0xec08

5fd8.004a8c  86090020 00bc253 Blocked    driverA+0xec08

5fd8.00583c  85990db0 00bc253 Blocked    driverA+0xec08
                            [858634a0 ApplicationA.EXE]

5b7c.005ad8  8597ddb0 0078325 Blocked    driverA+0xec08

5b7c.0058b4  85735020 00b6852 Blocked    driverA+0xec08

5b7c.00598c  8597db40 000001a Blocked    nt!ExEnterCriticalRegionAndAcquireResourceExclusive+0×19

5b7c.0059dc  85746a18 000001a Blocked    nt!ExEnterCriticalRegionAndAcquireResourceExclusive+0×19

5b7c.005b3c  85733ae8 0000016 Blocked    nt!ExEnterCriticalRegionAndAcquireResourceExclusive+0×19

5b7c.005934  85733878 0000018 Blocked    nt!ExEnterCriticalRegionAndAcquireResourceExclusive+0×19

5b7c.002b68  85bb8a40 0000016 Blocked    nt!ExEnterCriticalRegionAndAcquireResourceExclusive+0×19

5b7c.0016dc  85747438 0000018 Blocked    nt!ExEnterCriticalRegionAndAcquireResourceExclusive+0×19

5b7c.003fc0  8577ea60 00b6852 Blocked    driverA+0xec08

5b7c.0066a4  8595c2f8 0000016 Blocked    nt!ExEnterCriticalRegionAndAcquireResourceExclusive+0×19

5b7c.006b50  893d5660 0000018 Blocked    nt!ExEnterCriticalRegionAndAcquireResourceExclusive+0×19

5b7c.0066f4  8605f530 00b6852 Blocked    driverA+0xec08

5b7c.001554  85930cf0 00b6852 Blocked    driverA+0xec08

5b7c.006f28  86132db0 00b6852 Blocked    driverA+0xec08

5b7c.004448  85aa6890 0000016 Blocked    nt!ExEnterCriticalRegionAndAcquireResourceExclusive+0×19

5b7c.000fa8  859073c8 00b6852 Blocked    driverA+0xec08
                            [8595c928 ApplicationB.exe]

5990.0059a0  857c5508 000001a Blocked    nt!ExEnterCriticalRegionAndAcquireResourceExclusive+0×19

5990.005950  85ce7548 00b3b52 Blocked    driverA+0xec08

5990.005c10  856dc910 00b3b52 Blocked    driverA+0xec08

5990.005bd4  85767b40 00b3b52 Blocked    driverA+0xec08

5990.005e38  859b6a18 000001a Blocked    nt!ExEnterCriticalRegionAndAcquireResourceExclusive+0×19

5990.005f14  85a747a0 0000015 Blocked    nt!ExEnterCriticalRegionAndAcquireResourceExclusive+0×19

5990.005e68  85989020 0000015 Blocked    nt!ExEnterCriticalRegionAndAcquireResourceExclusive+0×19

5990.005f10  859f42d8 0000015 Blocked    nt!ExEnterCriticalRegionAndAcquireResourceExclusive+0×19

5990.005f0c  856ec5e8 00b3b52 Blocked    driverA+0xec08

5990.0045d0  856ec9a8 0000016 Blocked    nt!ExEnterCriticalRegionAndAcquireResourceExclusive+0×19

5990.004584  85728020 0000018 Blocked    nt!ExEnterCriticalRegionAndAcquireResourceExclusive+0×19

5990.004754  8572d818 0000016 Blocked    nt!ExEnterCriticalRegionAndAcquireResourceExclusive+0×19

5990.004b94  856cf020 00b3b52 Blocked    driverA+0xec08

5990.003374  85722db0 0000016 Blocked    nt!ExEnterCriticalRegionAndAcquireResourceExclusive+0×19

5990.000b1c  8647ddb0 00b3b52 Blocked    driverA+0xec08

5990.003bdc  85f812f0 00b3b52 Blocked    driverA+0xec08
                            [859bd598 dllhost.exe]

5e3c.00591c  8593e2f0 000001a Blocked    nt!ExEnterCriticalRegionAndAcquireResourceExclusive+0×19

5e3c.005e60  85777db0 000006e Blocked    nt!ExEnterCriticalRegionAndAcquireResourceExclusive+0×19

5e3c.005e64  85978b40 0000018 Blocked    nt!ExEnterCriticalRegionAndAcquireResourceExclusive+0×19

5e3c.0055c8  85903358 0000018 Blocked    nt!ExEnterCriticalRegionAndAcquireResourceExclusive+0×19
[...]
Threads Processed: 1500
Different methods to list all thread stacks are listed in Stack Trace Collection pattern.
- Dmitry Vostokov @ DumpAnalysis.org -
Computation “is a succession of” steps. “To” compute “each one is to succeed.”
- Dmitry Vostokov @ DumpAnalysis.org -