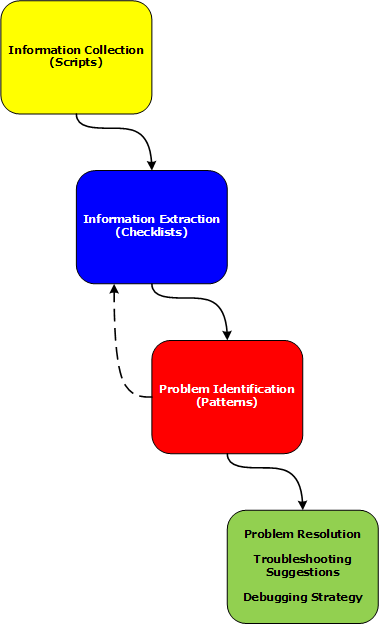
Archive for the ‘Debugging’ Category

Debugging Slang (Part 2)

Thursday, March 12th, 2009

American equivalent of a British bloke:

a pal - a panic alarm

Examples: I see a pal. I got this company’s pal.

- Dmitry Vostokov @ DumpAnalysis.org -

Debugging Slang (Part 1)

Tuesday, March 10th, 2009
a bloke - a blown kernel

Examples: I see a bloke. I got this company’s bloke.

- Dmitry Vostokov @ DumpAnalysis.org -

Crash Dump Analysis Patterns (Part 82)

Monday, March 9th, 2009

One pattern I recently discovered is the partitioning of anomalous debugger output from debugging commands into several disjoint or weakly linked classes. I call the pattern Semantic Split. It is better characterized as a partition of the memory analysis pattern, for example, Blocked Thread, into classes with different semantics, for example, blocked display threads and blocked remote share threads. Here is one short example of it found in the output of !locks and !process 0 ff WinDbg commands from a complete memory dump forced on a hanging server. The output shows several blocked threads and wait chains of executive resources (some shared locks have been removed for clarity):

0: kd> !locks
**** DUMP OF ALL RESOURCE OBJECTS ****

Resource @ 0×88eeeaf0    Exclusively owned
    Contention Count = 809254
    NumberOfExclusiveWaiters = 4
     Threads: 88a26db0-01<*>
     Threads Waiting On Exclusive Access:
              88c6b6d0       8877b020       88a7e020       88938db0      

Resource @ 0×88badb20    Exclusively owned
    Contention Count = 9195
    NumberOfExclusiveWaiters = 4
     Threads: 88842020-02<*>
     Threads Waiting On Exclusive Access:
              88a8b170       89069450       88c4d020       88a26db0      

Resource @ 0x88859cc0    Exclusively owned
    Contention Count = 51021
    NumberOfExclusiveWaiters = 8
     Threads: 886f1c50-01<*>
     Threads Waiting On Exclusive Access:
              88e04db0       886785c0       8851edb0       896ee890      
              8869fb50       886d6498       889aa918       88c2da38      

Resource @ 0x881cc138    Exclusively owned
    Contention Count = 173698
    NumberOfExclusiveWaiters = 4
     Threads: 87e72598-01<*>
     Threads Waiting On Exclusive Access:
              88392020       8918c8d8       88423020       880eba50      

Resource @ 0x884ffab0    Exclusively owned
    Contention Count = 3363
    NumberOfExclusiveWaiters = 2
     Threads: 8807c5b8-02<*>
     Threads Waiting On Exclusive Access:
              87e72598       881c12a8      

Resource @ 0x87cd6d48    Exclusively owned
    Contention Count = 242361
    NumberOfExclusiveWaiters = 5
     Threads: 87540718-01<*>
     Threads Waiting On Exclusive Access:
              878ceaf0       8785ac50       8884a7b8       87c4ca28      
              89ab5db0      

Resource @ 0x87c44d08    Exclusively owned
    Contention Count = 2560
    NumberOfExclusiveWaiters = 1
     Threads: 87540718-01<*>
     Threads Waiting On Exclusive Access:
              87c4e468      

Resource @ 0×87bf51d8    Exclusively owned
    Contention Count = 3
    NumberOfSharedWaiters = 3
     Threads: 89e76db0-01<*> 8739ac50-01    86f5d1c8-01    870f4db0-01   

Resource @ 0×888bfc38    Exclusively owned
    Contention Count = 3
    NumberOfSharedWaiters = 3
     Threads: 88a10db0-01<*> 86c94198-01    86dac598-01    86d85c50-01    

The first group of locks (one of them shown in blue) shows various problems with ComponentA module:

0: kd> !thread 88842020 1f
THREAD 88842020  Cid 1cf8.1b28  Teb: 7ffdb000 Win32Thread: bc25e8c0 WAIT: (Unknown) KernelMode Non-Alertable
    88842098  NotificationTimer
Not impersonating
DeviceMap                 e3813fd0
Owning Process            888c5d88       Image:         ApplicationA.exe
Attached Process          N/A            Image:         N/A
Wait Start TickCount      1163714        Ticks: 0
Context Switch Count      35781                 LargeStack
UserTime                  00:00:00.453
KernelTime                00:00:01.109
Win32 Start Address 0x77ec3ea5
Start Address kernel32!BaseThreadStartThunk (0x7c8217ec)
Stack Init b5cc4bd0 Current b5cc4614 Base b5cc5000 Limit b5cbf000 Call b5cc4bd8
Priority 9 BasePriority 9 PriorityDecrement 0
ChildEBP RetAddr 
b5cc462c 80833ec5 nt!KiSwapContext+0x26
b5cc4658 80829069 nt!KiSwapThread+0x2e5
b5cc46a0 bf8981b3 nt!KeDelayExecutionThread+0x2ab
b5cc46c4 bf898422 ComponentA!LockGUIHandle+0×6d
[…]
b5cc49e8 80a63456 nt!KiFastCallEntry+0xcd
[…]

The second group of locks (shown in red) shows the problem with ComponentB module:

0: kd> !thread 89e76db0 1f
THREAD 89e76db0  Cid 0004.0624  Teb: 00000000 Win32Thread: 00000000 WAIT: (Unknown) KernelMode Alertable
    89e76e28  NotificationTimer
Not impersonating
DeviceMap                 e1006e10
Owning Process            8b581648       Image:         System
Attached Process          N/A            Image:         N/A
Wait Start TickCount      1163714        Ticks: 0
Context Switch Count      545            
UserTime                  00:00:00.000
KernelTime                00:00:00.015
Start Address 0xb9003c20
Stack Init b9148000 Current b9147abc Base b9148000 Limit b9145000 Call 0
Priority 16 BasePriority 8 PriorityDecrement 0
ChildEBP RetAddr 
b9147ad4 80833ec5 nt!KiSwapContext+0x26
b9147b00 80829069 nt!KiSwapThread+0x2e5
b9147b48 b8fc9353 nt!KeDelayExecutionThread+0x2ab
b9147b74 b8ff9460 ComponentB!DeleteShareConnection+0×203
[…]
b9147ddc 8088f61e nt!PspSystemThreadStartup+0×2e
00000000 00000000 nt!KiThreadStartup+0×16

Looking at the list of all threads we see another classes of blocked threads, one is involving ComponentC module in user space:

0: kd> !thread 86c21db0 1f
THREAD 86c21db0  Cid 0fac.5260  Teb: 7ff6a000 Win32Thread: 00000000 WAIT: (Unknown) UserMode Non-Alertable
    869f2f68  SynchronizationEvent
IRP List:
    87fe3148: (0006,0220) Flags: 00000830  Mdl: 00000000
Not impersonating
DeviceMap                 e1006e10
Owning Process            896ccc28       Image:         ServiceA.exe
Attached Process          N/A            Image:         N/A
Wait Start TickCount      1163714        Ticks: 0
Context Switch Count      22            
UserTime                  00:00:00.000
KernelTime                00:00:00.000
Win32 Start Address 0×005c1de0
LPC Server thread working on message Id 5c1de0
Start Address kernel32!BaseThreadStartThunk (0×7c8217ec)
Stack Init b9787000 Current b9786c60 Base b9787000 Limit b9784000 Call 0
Priority 9 BasePriority 8 PriorityDecrement 0
ChildEBP RetAddr 
b9786c78 80833ec5 nt!KiSwapContext+0×26
b9786ca4 80829bc0 nt!KiSwapThread+0×2e5
b9786cec 8093b034 nt!KeWaitForSingleObject+0×346
b9786d50 8088ad3c nt!NtWaitForSingleObject+0×9a
b9786d50 7c9485ec nt!KiFastCallEntry+0xfc
03f8f984 7c821c8d ntdll!KiFastSystemCallRet
03f8f998 10097728 kernel32!WaitForSingleObject+0×12
03f8f9bc 10008164 ComponentC!ComponentB_Control+0×68
[…]
03f8ffec 00000000 kernel32!BaseThreadStart+0×34

This thread holds a mutant and blocks a dozen of other threads in ServiceA.exe, for example:

THREAD 8aa7cb40  Cid 0fac.0110  Teb: 7ffad000 Win32Thread: 00000000 WAIT: (Unknown) UserMode Non-Alertable
       87764550  Mutant - owning thread 86c21db0

From the function name we can infer that ComponentC controls ComponentB and this makes both blocked threads weakly connected.

Another thread in ServiceB involves DriverA module and blocks a thread ServiceA:

0: kd> !thread 8899e778 1f
THREAD 8899e778  Cid 01b0.13e0  Teb: 7ffdc000 Win32Thread: 00000000 WAIT: (Unknown) KernelMode Non-Alertable
    8aadb6e0  SynchronizationEvent
    8899e7f0  NotificationTimer
IRP List:
    86f21de0: (0006,0220) Flags: 00000884  Mdl: 00000000
Not impersonating
DeviceMap                 e1006e10
Owning Process            8ab3d020       Image:         ServiceB.exe
Attached Process          N/A            Image:         N/A
Wait Start TickCount      1163714        Ticks: 0
Context Switch Count      2            
UserTime                  00:00:00.000
KernelTime                00:00:00.000
Win32 Start Address 0x005c1a3c
LPC Server thread working on message Id 5c1a3c
Start Address 0x48589bb3
Stack Init aecee000 Current aeced768 Base aecee000 Limit aeceb000 Call 0
Priority 12 BasePriority 11 PriorityDecrement 0
ChildEBP RetAddr 
aeced780 80833ec5 nt!KiSwapContext+0x26
aeced7ac 80829bc0 nt!KiSwapThread+0x2e5
aeced7f4 badffece nt!KeWaitForSingleObject+0x346
WARNING: Stack unwind information not available. Following frames may be wrong.
aeced824 bae00208 DriverA+0×1ece
aeced868 bae0e45a DriverA+0×2208
aeced8a0 8081e095 DriverA+0×1045a

aeced8b4 b946673b nt!IofCallDriver+0×45
[…]

0: kd> !thread 8776c220 1f
THREAD 8776c220  Cid 0fac.5714  Teb: 7ff66000 Win32Thread: 00000000 WAIT: (Unknown) UserMode Non-Alertable
    8776c40c  Semaphore Limit 0x1
Waiting for reply to LPC MessageId 005c1a3c:
Current LPC port e213b0c8
Not impersonating
DeviceMap                 e1006e10
Owning Process            896ccc28       Image:         ServiceA.exe
Attached Process          N/A            Image:         N/A
Wait Start TickCount      1163714        Ticks: 0
Context Switch Count      12            
UserTime                  00:00:00.000
KernelTime                00:00:00.000
Win32 Start Address 0x75fddd73
Start Address kernel32!BaseThreadStartThunk (0x7c8217ec)
Stack Init aecf2000 Current aecf1c08 Base aecf2000 Limit aecef000 Call 0
Priority 8 BasePriority 8 PriorityDecrement 0
ChildEBP RetAddr 
aecf1c20 80833ec5 nt!KiSwapContext+0x26
aecf1c4c 80829bc0 nt!KiSwapThread+0x2e5
aecf1c94 80920f28 nt!KeWaitForSingleObject+0x346
aecf1d50 8088ad3c nt!NtRequestWaitReplyPort+0x776
aecf1d50 7c9485ec nt!KiFastCallEntry+0xfc
0408f594 75fde6b5 ntdll!KiFastSystemCallRet
0408f5fc 75fdd65e ComponentD!ServiceB_Request+0×1ae
[…]
0408ffec 00000000 kernel32!BaseThreadStart+0×34

In ServiceA we can also find several threads blocked by a RPC request to ServiceC:

0: kd> !thread 87397020 1f
THREAD 87397020  Cid 0fac.38cc  Teb: 7ff80000 Win32Thread: 00000000 WAIT: (Unknown) UserMode Non-Alertable
    87397098  NotificationTimer
Not impersonating
DeviceMap                 e1006e10
Owning Process            896ccc28       Image:         ServiceA.exe
Attached Process          N/A            Image:         N/A
Wait Start TickCount      1163714        Ticks: 0
Context Switch Count      7807            
UserTime                  00:00:00.125
KernelTime                00:00:00.109
Win32 Start Address 0x005c21a8
LPC Server thread working on message Id 5c21a8
Start Address kernel32!BaseThreadStartThunk (0x7c8217ec)
Stack Init b4ecf000 Current b4ecec80 Base b4ecf000 Limit b4ecc000 Call 0
Priority 13 BasePriority 8 PriorityDecrement 0
ChildEBP RetAddr 
b4ecec98 80833ec5 nt!KiSwapContext+0x26
b4ececc4 80829069 nt!KiSwapThread+0x2e5
b4eced0c 80996d8a nt!KeDelayExecutionThread+0x2ab
b4eced54 8088ad3c nt!NtDelayExecution+0x84
b4eced54 7c9485ec nt!KiFastCallEntry+0xfc
03a1f178 7c8024ed ntdll!KiFastSystemCallRet
03a1f188 77c5e51a kernel32!Sleep+0xf
03a1f198 77c36a44 RPCRT4!OSF_BINDING_HANDLE::Unbind+0x3a
03a1f1b0 77c36a08 RPCRT4!OSF_BINDING_HANDLE::~OSF_BINDING_HANDLE+0x32
03a1f1bc 77c369f1 RPCRT4!OSF_BINDING_HANDLE::`scalar deleting destructor'+0xd
03a1f1cc 77c5250a RPCRT4!OSF_BINDING_HANDLE::BindingFree+0x30
03a1f1dc 77f48c00 RPCRT4!RpcBindingFree+0x4e
03a1f1e8 77f48be2 ADVAPI32!RpcpUnbindRpc+0x15
03a1f1f4 77c3688e ADVAPI32!PLSAPR_SERVER_NAME_unbind+0xd
03a1f21c 77c369bb RPCRT4!GenericHandleMgr+0xca
03a1f23c 77c36983 RPCRT4!GenericHandleUnbind+0x31
03a1f260 77cb31b2 RPCRT4!NdrpClientFinally+0x5b
03a1f26c 77cb317a RPCRT4!NdrClientCall2+0x324
03a1f64c 77f4a0a1 RPCRT4!NdrClientCall2+0x2ea
03a1f664 77f4a022 ComponentD!ServiceC_Request+0×1c
[…]
03a1f8f8 77cb33e1 RPCRT4!Invoke+0×30
03a1fcf8 77cb35c4 RPCRT4!NdrStubCall2+0×299
03a1fd14 77c4ff7a RPCRT4!NdrServerCall2+0×19
03a1fd48 77c5042d RPCRT4!DispatchToStubInCNoAvrf+0×38
03a1fd9c 77c50353 RPCRT4!RPC_INTERFACE::DispatchToStubWorker+0×11f
03a1fdc0 77c511dc RPCRT4!RPC_INTERFACE::DispatchToStub+0xa3
03a1fdfc 77c512f0 RPCRT4!LRPC_SCALL::DealWithRequestMessage+0×42c
03a1fe20 77c58678 RPCRT4!LRPC_ADDRESS::DealWithLRPCRequest+0×127
03a1ff84 77c58792 RPCRT4!LRPC_ADDRESS::ReceiveLotsaCalls+0×430
03a1ff8c 77c5872d RPCRT4!RecvLotsaCallsWrapper+0xd
03a1ffac 77c4b110 RPCRT4!BaseCachedThreadRoutine+0×9d
03a1ffb8 7c824829 RPCRT4!ThreadStartRoutine+0×1b
03a1ffec 00000000 kernel32!BaseThreadStart+0×34

In ServiceC we see several RPC processing threads blocked by ComponentE:   

0: kd> !thread 873acb40 1f
THREAD 873acb40  Cid 023c.3a00  Teb: 7ff93000 Win32Thread: 00000000 WAIT: (Unknown) UserMode Non-Alertable
    89f0aeb0  Semaphore Limit 0x1
    873acbb8  NotificationTimer
IRP List:
    89838a00: (0006,0094) Flags: 00000900  Mdl: 00000000
    8705d4a0: (0006,0094) Flags: 00000800  Mdl: 00000000
    88bc9440: (0006,0094) Flags: 00000900  Mdl: 00000000
    87674af8: (0006,0094) Flags: 00000900  Mdl: 00000000
    86f2aa48: (0006,0094) Flags: 00000900  Mdl: 00000000
    87551290: (0006,0094) Flags: 00000900  Mdl: 00000000
Not impersonating
DeviceMap                 e1006e10
Owning Process            89dc0508       Image:         ServiceC.exe
Attached Process          N/A            Image:         N/A
Wait Start TickCount      1163714        Ticks: 0
Context Switch Count      16571            
UserTime                  00:00:00.250
KernelTime                00:00:00.703
Win32 Start Address RPCRT4!ThreadStartRoutine (0x77c4b0f5)
Start Address kernel32!BaseThreadStartThunk (0x7c8217ec)
Stack Init b2a9b000 Current b2a9ac60 Base b2a9b000 Limit b2a98000 Call 0
Priority 13 BasePriority 9 PriorityDecrement 0
ChildEBP RetAddr 
b2a9ac78 80833ec5 nt!KiSwapContext+0x26
b2a9aca4 80829bc0 nt!KiSwapThread+0x2e5
b2a9acec 8093b034 nt!KeWaitForSingleObject+0x346
b2a9ad50 8088ad3c nt!NtWaitForSingleObject+0x9a
b2a9ad50 7c9485ec nt!KiFastCallEntry+0xfc
022cf8d0 7c821c8d ntdll!KiFastSystemCallRet
022cf8e4 741269e5 kernel32!WaitForSingleObject+0x12
022cf8f8 7412cdca ComponentE!Enumerate+0×37
[…]
022cf944 77cb33e1 RPCRT4!Invoke+0×30
022cfd44 77cb35c4 RPCRT4!NdrStubCall2+0×299
022cfd60 77c4ff7a RPCRT4!NdrServerCall2+0×19
022cfd94 77c5042d RPCRT4!DispatchToStubInCNoAvrf+0×38
022cfde8 77c50353 RPCRT4!RPC_INTERFACE::DispatchToStubWorker+0×11f
022cfe0c 77c38e0d RPCRT4!RPC_INTERFACE::DispatchToStub+0xa3
022cfe40 77c38cb3 RPCRT4!OSF_SCALL::DispatchHelper+0×149
022cfe54 77c38c2b RPCRT4!OSF_SCALL::DispatchRPCCall+0×10d
022cfe84 77c38b5e RPCRT4!OSF_SCALL::ProcessReceivedPDU+0×57f
022cfea4 77c3e8db RPCRT4!OSF_SCALL::BeginRpcCall+0×194
022cff04 77c3e7b4 RPCRT4!OSF_SCONNECTION::ProcessReceiveComplete+0×435
022cff18 77c4b799 RPCRT4!ProcessConnectionServerReceivedEvent+0×21
022cff84 77c4b9b5 RPCRT4!LOADABLE_TRANSPORT::ProcessIOEvents+0×1b8
022cff8c 77c5872d RPCRT4!ProcessIOEventsWrapper+0xd
022cffac 77c4b110 RPCRT4!BaseCachedThreadRoutine+0×9d
022cffb8 7c824829 RPCRT4!ThreadStartRoutine+0×1b
022cffec 00000000 kernel32!BaseThreadStart+0×34
 

Therefore we have 4 main groups of wait chain endpoints involving semantically disjoint ComponentA, ComponentB, ComponentE and DriverA modules. Although their module names do not infer disjointedness this example was abstracted from the real incident where respective modules were having different system functions and were even from different software vendors.

- Dmitry Vostokov @ DumpAnalysis.org -

Manual dump, dynamic memory corruption, blocked threads, stack trace collection, multiple exceptions, wait chains and deadlock: pattern cooperation

Sunday, March 8th, 2009

The following memory dump of a hanging process was manually generated:

Loading Dump File [Process.dmp]
User Mini Dump File with Full Memory: Only application data is available

Comment: 'Userdump generated complete user-mode minidump with Standalone function on COMPUTER'

Applying default analysis command shows the following stack traces:

0:000> .kframes 100
Default stack trace depth is 0n256 frames

0:000> !analyze -v 

[...] 

STACK_TEXT: 
009ef258 7c827d0b ntdll!KiFastSystemCallRet
009ef25c 7c83d236 ntdll!NtWaitForSingleObject+0xc
009ef298 7c83d281 ntdll!RtlpWaitOnCriticalSection+0×1a3
009ef2b8 7c82dabf ntdll!RtlEnterCriticalSection+0xa8

009ef358 7c82dab1 ntdll!LdrpGetProcedureAddress+0×128
009ef374 77e764ea ntdll!LdrGetProcedureAddress+0×18
009ef5d8 7c34c456 kernel32!UnhandledExceptionFilter+0×46f
009ef5f4 7c34957c msvcr71!_XcptFilter+0×15f
009ef600 7c34246e msvcr71!_endthreadex+0xb7
009ef628 7c828752 msvcr71!_except_handler3+0×61
009ef64c 7c828723 ntdll!ExecuteHandler2+0×26
009ef6f4 7c82855e ntdll!ExecuteHandler+0×24
009ef6f4 7c82be3e ntdll!KiUserExceptionDispatcher+0xe

009efa00 7c82a319 ntdll!RtlpFindEntry+0×68
009efc2c 7c3416b3 ntdll!RtlAllocateHeap+0×606
009efc6c 7c3416db msvcr71!_heap_alloc+0xe0
009efc74 7c360947 msvcr71!_nh_malloc+0×10
009efc80 0285f893 msvcr71!operator new+0xb

[…]
009effb8 77e64829 msvcr71!_endthreadex+0xa0
009effec 00000000 kernel32!BaseThreadStart+0×34

[...]

BUGCHECK_STR:  APPLICATION_FAULT_STATUS_BREAKPOINT_STATUS_BREAKPOINT

We see the exeption was dispatched because of heap corruption and the unhandled exception filter is blocked waiting for a critical section. We can immediately recommend to enable full page heap. However, let’s explore the dump file further. By listing all threads we find that there were 2 exceptions with the second one having the following stack trace:

0:000> ~*kb

[...]

  98  Id: be4.2ca4 Suspend: 1 Teb: 7ff68000 Unfrozen
ChildEBP RetAddr  Args to Child             
0f83c80c 7c827d0b 7c83d236 00000154 00000000 ntdll!KiFastSystemCallRet
0f83c810 7c83d236 00000154 00000000 00000000 ntdll!NtWaitForSingleObject+0xc
0f83c84c 7c83d281 00000154 00000004 0f83c8b0 ntdll!RtlpWaitOnCriticalSection+0×1a3
0f83c86c 7c82dabf 7c8877a0 00000000 00000000 ntdll!RtlEnterCriticalSection+0xa8

0f83c90c 7c82dab1 00000000 77e767cc 00000000 ntdll!LdrpGetProcedureAddress+0×128
0f83c928 77e764ea 00000000 77e767cc 00000000 ntdll!LdrGetProcedureAddress+0×18
0f83cb8c 77e792a3 0f83cbb4 77e61ac1 0f83cbbc kernel32!UnhandledExceptionFilter+0×46f
0f83cb94 77e61ac1 0f83cbbc 00000000 0f83cbbc kernel32!BaseThreadStart+0×4a
0f83cbbc 7c828752 0f83cca0 0f83ffdc 0f83ccbc kernel32!_except_handler3+0×61
0f83cbe0 7c828723 0f83cca0 0f83ffdc 0f83ccbc ntdll!ExecuteHandler2+0×26
0f83cc88 7c82855e 0f83c000 0f83ccbc 0f83cca0 ntdll!ExecuteHandler+0×24
0f83cc88 7c82be3e 0f83c000 0f83ccbc 0f83cca0 ntdll!KiUserExceptionDispatcher+0xe

0f83cf94 7c82a319 00340178 00000050 0b425f54 ntdll!RtlpFindEntry+0×68
0f83d1c0 7c3416b3 00340000 00000000 00000278 ntdll!RtlAllocateHeap+0×606
0f83d200 7c3416db 00000278 7c3416f8 00000278 msvcr71!_heap_alloc+0xe0
0f83d208 7c3416f8 00000278 00000000 003214fd msvcr71!_nh_malloc+0×10
0f83d214 003214fd 00000278 0f83d23c 023e5912 msvcr71!malloc+0xf

[…]
0f83f8b4 77ce33e1 0cf4ca00 0f83fa98 0000000c rpcrt4!Invoke+0×30
0f83fcb4 77ce35c4 00000000 00000000 0bf93d8c rpcrt4!NdrStubCall2+0×299
0f83fcd0 77c7ff7a 0bf93d8c 0beae6b8 0bf93d8c rpcrt4!NdrServerCall2+0×19
0f83fd04 77c8042d 0cf4f53e 0bf93d8c 0f83fdec rpcrt4!DispatchToStubInCNoAvrf+0×38
0f83fd58 77c80353 0000006f 00000000 0cf74358 rpcrt4!RPC_INTERFACE::DispatchToStubWorker+0×11f
0f83fd7c 77c7e0d4 0bf93d8c 00000000 0cf74358 rpcrt4!RPC_INTERFACE::DispatchToStub+0xa3
0f83fdbc 77c7e080 0bf93d8c 0bf93d44 00000000 rpcrt4!RPC_INTERFACE::DispatchToStubWithObject+0xc0
0f83fdfc 77c812f0 001c85c0 0bf0f510 00189d08 rpcrt4!LRPC_SCALL::DealWithRequestMessage+0×41e
0f83fe20 77c88678 0bf0f548 0f83fe38 001c85c0 rpcrt4!LRPC_ADDRESS::DealWithLRPCRequest+0×127
0f83ff84 77c88792 0f83ffac 77c8872d 0bf0f510 rpcrt4!LRPC_ADDRESS::ReceiveLotsaCalls+0×430
0f83ff8c 77c8872d 0bf0f510 00000000 00000000 rpcrt4!RecvLotsaCallsWrapper+0xd
0f83ffac 77c7b110 00145520 0f83ffec 77e64829 rpcrt4!BaseCachedThreadRoutine+0×9d
0f83ffb8 77e64829 0be74ce0 00000000 00000000 rpcrt4!ThreadStartRoutine+0×1b
0f83ffec 00000000 77c7b0f5 0be74ce0 00000000 kernel32!BaseThreadStart+0×34

[...] 

 102  Id: be4.2ac0 Suspend: 1 Teb: 7ff4f000 Unfrozen
ChildEBP RetAddr  Args to Child             
134df91c 7c827d0b 7c83d236 000004e4 00000000 ntdll!KiFastSystemCallRet
134df920 7c83d236 000004e4 00000000 00000000 ntdll!NtWaitForSingleObject+0xc
134df95c 7c83d281 000004e4 00000004 00340000 ntdll!RtlpWaitOnCriticalSection+0×1a3
134df97c 7c82a264 00340608 00000000 0000008c ntdll!RtlEnterCriticalSection+0xa8

134dfba4 7c3423aa 00340000 00000008 0000008c ntdll!RtlAllocateHeap+0×313
134dfbe4 7c3422cb 00000001 0000008c 00000000 msvcr71!calloc+0xe6

134dfbfc 7c81a352 7c340000 00000002 00000000 msvcr71!_CRTDLL_INIT+0×138
134dfc1c 7c82ed97 7c34229f 7c340000 00000002 ntdll!LdrpCallInitRoutine+0×14
134dfcb8 7c82ec9f 134dfd28 134dfd28 00000000 ntdll!LdrpInitializeThread+0×10d
134dfd14 7c8284c5 134dfd28 7c800000 00000000 ntdll!_LdrpInitialize+0×16f
00000000 00000000 00000000 00000000 00000000 ntdll!KiUserApcDispatcher+0×25

If we inspect the list of locked critical sections and compare stack trace parameters for threads 2ac0 and 2ca4 we would see them deadlocked:

0:000> !locks

CritSec ntdll!LdrpLoaderLock+0 at 7c8877a0
WaiterWoken        No
LockCount          6
RecursionCount     1
OwningThread       2ac0
EntryCount         0
ContentionCount    36
*** Locked

CritSec +340608 at 00340608
WaiterWoken        No
LockCount          32
RecursionCount     1
OwningThread       2ca4
EntryCount         0
ContentionCount    6f
*** Locked

[...]

Looking at other locks (omitted here) we can find additional wait chains but we employ default hang analysis command to find one chain for us:

0:000> !analyze -v -hang

[...]

LOADERLOCK_BLOCKED_API:  UnhandledExceptionFilter:LdrGetProcedureAddress: LdrpGetProcedureAddress:

LOADERLOCK_OWNER_API:  _LdrpInitialize:LdrpInitializeThread:LdrpCallInitRoutine:

DERIVED_WAIT_CHAIN: 

Dl Eid Cid     WaitType
-- --- ------- --------------------------
   2   be4.c20 Critical Section       -->
x  98  be4.2ca4 Critical Section       -->
x  102 be4.2ac0 Critical Section       --^

WAIT_CHAIN_COMMAND:  ~2s;k;;~98s;k;;~102s;k;;

BLOCKING_THREAD:  00002ca4

DEFAULT_BUCKET_ID:  APPLICATION_HANG_DEADLOCK_HeapCorruption

PRIMARY_PROBLEM_CLASS:  APPLICATION_HANG_DEADLOCK_HeapCorruption

[...]

- Dmitry Vostokov @ DumpAnalysis.org -

Stack Traces and Poetry

Friday, March 6th, 2009

Reading stack traces like English verse (remeber to read from bottom to top):

0:01> ~8kL
ChildEBP RetAddr 
009ef258 7c827d0b ntdll!KiFastSystemCallRet
009ef25c 7c83d236 ntdll!NtWaitForSingleObject+0xc
009ef298 7c83d281 ntdll!RtlpWaitOnCriticalSection+0x1a3
009ef2b8 7c82dabf ntdll!RtlEnterCriticalSection+0xa8
009ef358 7c82dab1 ntdll!LdrpGetProcedureAddress+0x128
009ef374 77e764ea ntdll!LdrGetProcedureAddress+0x18
009ef5d8 7c34c456 kernel32!UnhandledExceptionFilter+0x46f
009ef5f4 7c34957c msvcr71!_XcptFilter+0x15f
009ef600 7c34246e msvcr71!_endthreadex+0xb7
009ef628 7c828752 msvcr71!_except_handler3+0x61
009ef64c 7c828723 ntdll!ExecuteHandler2+0x26
009ef6f4 7c82855e ntdll!ExecuteHandler+0x24
009ef6f4 7c82be3e ntdll!KiUserExceptionDispatcher+0xe
009efa00 7c82a319 ntdll!RtlpFindEntry+0x68
009efc2c 7c3416b3 ntdll!RtlAllocateHeap+0x606
009efc6c 7c3416db msvcr71!_heap_alloc+0xe0
009efc74 7c360947 msvcr71!_nh_malloc+0x10
009efc80 0285f893 msvcr71!operator new+0xb
009efca8 02852e38 SQLModule!ODBCDelete+0xf3
009efd54 0269acff Store!ProcessDeletes+0x3d
009eff38 0269badb Store!UpdateStore+0xe
009eff58 00323499 Common!WorkItem+0x15c
009eff84 7c349565 Common!WorkItemThread+0x339
009effb8 77e64829 msvcr71!_endthreadex+0xa0
009effec 00000000 kernel32!BaseThreadStart+0x34

The new thread started
To work through items
It got an item
Handled to the store
To run delete requests
Through Oh-Dee-Bee-See
It tried to alloc
But crashed in malloc
While browsing the heap
Exception was dispatched
And handler called at once
But couldn’t find a filter
And called default one
That filter needed help
And looked for its address
But halted in suspense
While entering crit sec.

- Dmitry Vostokov @ DumpAnalysis.org -

Review of Programming Language Pragmatics

Friday, March 6th, 2009

Every debugging engineer needs to know how the code is interpreted or compiled. Debugging complex problems or doing memory analysis on general-purpose operating systems often requires understanding the syntax and semantics of several programming languages and their run-time support. The knowledge of optimization techniques is also important for low-level debugging when the source code is not available. The following book provides an overview of all important concepts and discusses almost 50 languages. I read the first edition 6 years ago and I liked it so much that I’m now reading the second edition.

Programming Language Pragmatics, Second Edition

Buy from Amazon

- Dmitry Vostokov @ DumpAnalysis.org -

Busy system, blocked threads, wait chains and deadlock: pattern cooperation

Tuesday, March 3rd, 2009

In one kernel memory dump we can see the signs of a busy system where all processors are executing non-idle threads:

0: kd> !running

System Processors ff (affinity mask)
  Idle Processors 0

     Prcb      Current   Next   
  0  ffdff120  8b223928            ................
  1  f772f120  8a765380            ................
  2  f7737120  89365db0            ................
  3  f773f120  8833adb0            ................
  4  f7747120  889bbdb0            ................
  5  f774f120  8c085db0            ................
  6  f7757120  8aa79698            ................
  7  f775f120  896c0668            ................

When inspecting them we see that some are kernel worker threads without a process context, for example:

0: kd> !thread 8aa79698 1f
THREAD 8aa79698  Cid 0004.6edc  Teb: 00000000 Win32Thread: 00000000 RUNNING on processor 6
Not impersonating
DeviceMap                 d66008d0
Owning Process            8d15d648       Image:         System
Wait Start TickCount      2548878        Ticks: 3 (0:00:00:00.046)
Context Switch Count      248713            
UserTime                  00:00:00.000
KernelTime                00:00:00.906

Start Address nt!ExpWorkerThread (0×80881860)
Stack Init acfbc000 Current acfbbcec Base acfbc000 Limit acfb9000 Call 0
Priority 13 BasePriority 13 PriorityDecrement 0
ChildEBP RetAddr
WARNING: Stack unwind information not available. Following frames may be wrong.
acfbbaec b19483f3 driver+0×3f65
acfbbb6c 8081e095 driver+0×23f3
acfbbb80 af36044a nt!IofCallDriver+0×45
[…]
acfbbdac 8094bea4 nt!ExpWorkerThread+0xeb
acfbbddc 8088f57e nt!PspSystemThreadStartup+0×2e
00000000 00000000 nt!KiThreadStartup+0×16

some threads with an associated process context are running in kernel space:

0: kd> !thread 889bbdb0 1f
THREAD 889bbdb0  Cid 6c58.6f98  Teb: 00000000 Win32Thread: 00000000 RUNNING on processor 4
Not impersonating
DeviceMap                 d66008d0
Owning Process            89ad8b18       Image:         csrss.exe
Wait Start TickCount      2548880        Ticks: 1 (0:00:00:00.015)
Context Switch Count      129536            
UserTime                  00:00:00.000
KernelTime                00:00:00.312

Start Address displaydriver!Thread (0xbfad4a60)
Stack Init a439d000 Current a439cc70 Base a439d000 Limit a439a000 Call 0
Priority 13 BasePriority 10 PriorityDecrement 3
ChildEBP RetAddr
a439c004 bfad707f displaydriver!CalcRegion+0×30
[…]
a439cddc 8088f57e nt!PspSystemThreadStartup+0×2e
00000000 00000000 nt!KiThreadStartup+0×16

and some threads with an associated process context are running in user space:

0: kd> !thread 8c085db0 1f
THREAD 8c085db0  Cid 2318.231c  Teb: 7ffdd000 Win32Thread: b4b5ebe8 RUNNING on processor 5
Not impersonating
DeviceMap                 dc1a71f0
Owning Process            8b02e458       Image:         Application.EXE
Wait Start TickCount      2548881        Ticks: 0
Context Switch Count      725122                 LargeStack
UserTime                  00:00:01.625
KernelTime                00:00:03.062

Win32 Start Address 0×30001084
Start Address 0×7c8217f8
Stack Init ad648000 Current ad647c50 Base ad648000 Limit ad642000 Call 0
Priority 12 BasePriority 10 PriorityDecrement 0
ChildEBP RetAddr
0013fb7c 00000000 0×7c81b910

Because none of them consumed much CPU the patter of Spiking Thread is ruled out and CPU load can be explained by the number of active user sessions and this appears to be normal:

0: kd> !session
Sessions on machine: 50

However looking at ERESOURCE locks we see many blocked threads and signs of possible wait chains:

0: kd> !locks
**** DUMP OF ALL RESOURCE OBJECTS ****

Resource @ 0x8cbfaa68    Exclusively owned
    Contention Count = 22969
    NumberOfSharedWaiters = 1
    NumberOfExclusiveWaiters = 109
     Threads: 8a961db0-01<*> 8bf532b0-01   
     Threads Waiting On Exclusive Access:
              8b4532f0       884fc648       88c58a00       8a751360      
              88ed64f8       89aa6738       89870db0       881dedb0      
              8a6d7b40       8b4a4db0       89818ad0       8afcedb0      
              8a2ca020       88684db0       8b411020       89d595c0      
              8d1573f0       88d06020       8aed8b38       8a8c9020      
              8a5a0a50       8a1f63b0       89b66688       89bf1db0      
              880dab18       882e6730       895d8020       88e6d3f0      
              896e6748       89802100       8a604508       8907c5e8      
              8890a020       885e2300       8a061bd8       88445340      
              88113db0       8a680db0       89b53370       88c3f2a0      
              88a774f8       8834ddb0       89d78888       88386020      
              897ca8d8       8b3532d0       882341d0       8a4a9b80      
              87e7c4f8       895e5db0       8846f4e8       89df3db0      
              889b8b40       89d82db0       89e4b720       8aadadb0      
              8aa63020       88852020       8a249ba8       891b8c20      
              8b3f95f0       8aace760       8b470020       897ad388      
              8c07dba8       8a331628       896c74d0       8997cb40      
              88e133c8       886eddb0       8864e518       89ab5698      
              88d8bdb0       89996db0       8ac54d28       87f42020      
              882b1020       8857fdb0       895f3db0       88b0ab40      
              8a1aadb0       8b819020       8b3bf388       88315660      
              8a45db18       883fbdb0       88f53db0       87f209a0      
              8978ddb0       8840c868       8823c1c8       88277db0      
              89c0a8c8       88322940       8a475db0       8a6ad460      
              8a35a4c8       88e3da40       886b1b40       8886a2a0      
              8897d750       8b30bdb0       8a123020       8b0ad7f8      
              8a256930       885cedb0       88ec8db0       887d7ba8      
              88175b90      

Resource @ 0x8b8f09a8    Shared 1 owning threads
    Contention Count = 123597
    NumberOfSharedWaiters = 1
    NumberOfExclusiveWaiters = 6
     Threads: 88200840-01    8a92ddb0-01<*>
     Threads Waiting On Exclusive Access:
              8a317db0       8d151840       899acdb0       8a961db0
              891ac940       89ee5db0      

Resource @ 0x8ac79f08    Exclusively owned
    Contention Count = 717691
    NumberOfExclusiveWaiters = 12
     Threads: 8a5193f0-01<*>
     Threads Waiting On Exclusive Access:
              880e7b40       8a60adb0       8a543108       8a4be020      
              8a77c360       8a470730       87f12db0       8a4618d0      
              895c5600       8a942b98       8a453b40       8a3bf020      

Resource @ 0x8a73ed28    Exclusively owned
    Contention Count = 4
    NumberOfExclusiveWaiters = 2
     Threads: 8a45db18-01<*>
     Threads Waiting On Exclusive Access:
              8a412db0       8a542268      

Resource @ 0x8a621bf8    Exclusively owned
    Contention Count = 8532
    NumberOfExclusiveWaiters = 3
     Threads: 8a412db0-01<*>
     Threads Waiting On Exclusive Access:
              8a5193f0       8a60cdb0       8a595c78      

Resource @ 0x8a4c8b20    Exclusively owned
    Contention Count = 1
    NumberOfExclusiveWaiters = 1
     Threads: 8a92ddb0-01<*>
     Threads Waiting On Exclusive Access:
              89524a70      

Resource @ 0x8a43b0e8    Exclusively owned
    Contention Count = 1135854
    NumberOfSharedWaiters = 1
    NumberOfExclusiveWaiters = 9
     Threads: 8aaa3020-01<*> 88efb400-01   
     Threads Waiting On Exclusive Access:
              89f883b0       8a273a70       89f82c10       89fd9020      
              89ec0db0       89571290       89edcdb0       88930400      
              8845f4c8      

Resource @ 0x89f7dbe8    Exclusively owned
    Contention Count = 2
    NumberOfExclusiveWaiters = 2
     Threads: 891b8c20-01<*>
     Threads Waiting On Exclusive Access:
              89ecedb0       89fc3020      

Resource @ 0x89f82f28    Exclusively owned
    Contention Count = 26674
    NumberOfExclusiveWaiters = 2
     Threads: 89fc3020-01<*>
     Threads Waiting On Exclusive Access:
              8aaa3020       8a02db40      

Resource @ 0x89315320    Exclusively owned
    Contention Count = 509247
    NumberOfSharedWaiters = 1
    NumberOfExclusiveWaiters = 19
     Threads: 89261428-01<*> 89313a08-01   
     Threads Waiting On Exclusive Access:
              89cc7db0       8ad26528       8970db68       88ef64d0      
              8a629020       89450798       8825c9a8       89206378      
              8a7c7b90       89162890       8ae7c020       883318e0      
              88bd6358       89367db0       8952aaa0       8a817b40      
              881d65b8       8ab74db0       889202c0      

Resource @ 0x893872d8    Exclusively owned
    Contention Count = 5079
    NumberOfExclusiveWaiters = 3
     Threads: 896e6748-01<*>
     Threads Waiting On Exclusive Access:
              89261428       893bc3c8       892a88a8      

Resource @ 0x8924adf8    Exclusively owned
    Contention Count = 1
    NumberOfExclusiveWaiters = 1
     Threads: 88ed64f8-01<*>
     Threads Waiting On Exclusive Access:
              89146660      

Resource @ 0x890281b0    Exclusively owned
    Contention Count = 4
    NumberOfExclusiveWaiters = 4
     Threads: 88d06020-01<*>
     Threads Waiting On Exclusive Access:
              88b5c528       88c5aa98       87ef77b8       88c48b40      

Resource @ 0x88d40440    Exclusively owned
    Contention Count = 13
    NumberOfExclusiveWaiters = 1
     Threads: 899acdb0-01<*>
     Threads Waiting On Exclusive Access:
              895e6db0      

Resource @ 0x88ed0c20    Exclusively owned
    Contention Count = 2
    NumberOfExclusiveWaiters = 2
     Threads: 895e6db0-01<*>
     Threads Waiting On Exclusive Access:
              88ad7540       88b5f620      

Resource @ 0x894e7990    Exclusively owned
    Contention Count = 3852647
    NumberOfExclusiveWaiters = 12
     Threads: 881b14b8-01<*>
     Threads Waiting On Exclusive Access:
              88a13db0       87f12020       8aad7a20       8820a020      
              8824bdb0       88213db0       88eefdb0       88ab7550      
              889fe808       89df17a0       8aa83430       8a8f73c8      

Resource @ 0x88559288    Exclusively owned
    Contention Count = 7422
    NumberOfExclusiveWaiters = 3
     Threads: 880dab18-01<*>
     Threads Waiting On Exclusive Access:
              881b14b8       88311020       882ab660      

Resource @ 0x8aff12b0    Exclusively owned
    Contention Count = 6
    NumberOfExclusiveWaiters = 1
     Threads: 89524a70-01<*>
     Threads Waiting On Exclusive Access:
              8a92ddb0      

62174 total locks, 75 locks currently held

Starting with the thread 8a961db0 that blocks 109 other threads we can unravel the following deadlock:

109 threads -> 8a961db0 -> 8a92ddb0 -> 89524a70 -> 8a92ddb0 -> 89524a70 -> …

Looking at threads involved in the deadlock we see that they belong to the same process and deadlocked in kernel space when running through driverA.sys code:

0: kd> !thread 89524a70 1f
THREAD 89524a70  Cid 1fdc.26cc  Teb: 7ffdd000 Win32Thread: b4d0fea8 WAIT: (Unknown) KernelMode Non-Alertable
    89170648  SynchronizationEvent
    89524ae8  NotificationTimer
IRP List:
    88e7a008: (0006,0268) Flags: 00000000  Mdl: 00000000
    8a7cc228: (0006,0268) Flags: 00000000  Mdl: 00000000
    89e67b90: (0006,0268) Flags: 00000000  Mdl: 00000000 Not impersonating
DeviceMap                 e2e671d0
Owning Process            88c37020       Image:         ApplicationA.exe
Wait Start TickCount      2548760        Ticks: 121 (0:00:00:01.890)
Context Switch Count      4850                 LargeStack
UserTime                  00:00:00.734
KernelTime                00:00:01.718
Win32 Start Address 0×00404054
Start Address 0×7c8217f8
Stack Init 91971000 Current 91970278 Base 91971000 Limit 9196a000 Call 0
Priority 14 BasePriority 10 PriorityDecrement 4
ChildEBP RetAddr
91970290 80833ec5 nt!KiSwapContext+0×26
919702bc 80829bc0 nt!KiSwapThread+0×2e5
91970304 8087e0db nt!KeWaitForSingleObject+0×346
91970340 8087e2f5 nt!ExpWaitForResource+0xd5
91970360 b0a1cf6d nt!ExAcquireResourceExclusiveLite+0×8d
91970374 b0a08cef driverA+0×2ef6d
919703cc b0a089cc driverA+0×1acef
919703f4 b0a209d9 driverA+0×1a9cc
9197056c b0a20386 driverA+0×329d9
91970630 b0a1dc32 driverA+0×32386
919706e8 b0a20508 driverA+0×2fc32
919707ac b0a1eec1 driverA+0×32508
919708a0 b0a21e90 driverA+0×30ec1
91970930 b0a171c9 driverA+0×33e90
919709c4 b0a16c9d driverA+0×291c9
91970a38 b0a600b3 driverA+0×28c9d
91970a84 b0a45dda driverA+0×720b3
91970afc b0a4657a driverA+0×57dda
91970b48 8081e095 driverA+0×5857a

91970b5c f7876d28 nt!IofCallDriver+0×45
91970b88 8081e095 fltmgr!FltpDispatch+0×152
91970b9c f74fc6ca nt!IofCallDriver+0×45
91970bb4 f7876d28 driverB+0×56ca
91970be0 8081e095 fltmgr!FltpDispatch+0×152
91970bf4 b195a4e1 nt!IofCallDriver+0×45
91970c18 b195a5d0 driverC!PassThrough+0xd1
91970c28 8081e095 driverC!Dispatch+0×80
91970c3c f7876d28 nt!IofCallDriver+0×45
91970c68 8081e095 fltmgr!FltpDispatch+0×152
91970c7c 808f7601 nt!IofCallDriver+0×45
91970c90 808f5339 nt!IopSynchronousServiceTail+0×10b
91970d38 8088ac9c nt!NtWriteFile+0×663
91970d38 7c9485ec nt!KiFastCallEntry+0xfc

0: kd> !thread 8a92ddb0 1f
THREAD 8a92ddb0  Cid 1fdc.7b98  Teb: 7ffa9000 Win32Thread: b4deeae8 WAIT: (Unknown) KernelMode Non-Alertable
    8b422388  SynchronizationEvent
    8a92de28  NotificationTimer
Not impersonating
DeviceMap                 e2e671d0
Owning Process            88c37020       Image:         ApplicationA.exe
Wait Start TickCount      2548760        Ticks: 121 (0:00:00:01.890)
Context Switch Count      956                 LargeStack
UserTime                  00:00:00.000
KernelTime                00:00:00.015
Win32 Start Address 0×01381fa0
Start Address 0×7c8217ec
Stack Init 917c1000 Current 917c034c Base 917c1000 Limit 917bd000 Call 0
Priority 14 BasePriority 10 PriorityDecrement 4
ChildEBP RetAddr
917c0364 80833ec5 nt!KiSwapContext+0×26
917c0390 80829bc0 nt!KiSwapThread+0×2e5
917c03d8 8087e0db nt!KeWaitForSingleObject+0×346
917c0414 8087e2f5 nt!ExpWaitForResource+0xd5
917c0434 b0a1cf6d nt!ExAcquireResourceExclusiveLite+0×8d
917c0448 b0a08cef driverA+0×2ef6d
917c04a0 b0a089cc driverA+0×1acef
917c04c8 b0a13787 driverA+0×1a9cc
917c053c b0a0bfaa driverA+0×25787
917c057c b0a0c3b3 driverA+0×1dfaa
917c0858 b0a0ccaf driverA+0×1e3b3
917c0934 b0a6074c driverA+0×1ecaf
917c097c b0a4f9d2 driverA+0×7274c
917c0a18 b0a501f6 driverA+0×619d2
917c0a40 b0a5020c driverA+0×621f6
917c0a4c b0a50442 driverA+0×6220c
917c0a6c b0a50687 driverA+0×62442
917c0ac4 b0a50cb0 driverA+0×62687
917c0b08 b0a50ddd driverA+0×62cb0
917c0b18 8081e095 driverA+0×62ddd

917c0b2c f7876d28 nt!IofCallDriver+0×45
917c0b58 8081e095 fltmgr!FltpDispatch+0×152
917c0b6c f74fc6ca nt!IofCallDriver+0×45
917c0b84 f7876d28 driverB+0×56ca
917c0bb0 8081e095 fltmgr!FltpDispatch+0×152
917c0bc4 b195a4e1 nt!IofCallDriver+0×45
917c0be8 b195a5d0 driverC!PassThrough+0xd1
917c0bf8 8081e095 driverC!Dispatch+0×80
917c0c0c f7876d28 nt!IofCallDriver+0×45
917c0c38 8081e095 fltmgr!FltpDispatch+0×152
917c0c4c 808f7601 nt!IofCallDriver+0×45
917c0c60 808f1b45 nt!IopSynchronousServiceTail+0×10b
917c0c84 afdfebd5 nt!NtQueryDirectoryFile+0×5d
917c0cf8 afdff95d driverD+0×8bd5
917c0d30 8088ac9c driverD+0×995d
917c0d30 7c9485ec nt!KiFastCallEntry+0xfc

Other wait chains seem to be subordinate to the main deadlock chain. 

- Dmitry Vostokov @ DumpAnalysis.org -

Pattern-Driven Memory Analysis (Part 1)

Monday, March 2nd, 2009

Last week I had an opportunity to present a pattern-driven memory dump analysis methodology at a global engineering conference. Now in a series of articles I’m going to clarify certain points and extend it to wider domain of memory analysis including computer memory forensics and intelligence.

Today I post the reworked picture of a waterfall-like analysis process:


Various phases and their relationship will be discussed in subsequent parts together with examples. 

- Dmitry Vostokov @ DumpAnalysis.org -

Bugtation No.85

Saturday, February 28th, 2009

A contribution to Software Resistentialism:

Software objects can be classified scientifically into three major categories: those that don’t work, those that crash and those that hang.

Russell Wayne Baker

- Dmitry Vostokov @ DumpAnalysis.org -

Bugtation No.84

Friday, February 27th, 2009

“Don’t” guess “it, get a larger” dump.

Anthony’s Law of Force

- Dmitry Vostokov @ DumpAnalysis.org -

Debugger Log Reading Techniques (Part 1)

Thursday, February 26th, 2009

Debugger logs (textual output) from commands like !process 0 ff and various scripts can be very long and consist of thousands of pages. I found the following reading technique useful for my daily memory dump analysis activities:

CSA-QSA

Checklists-Skim-Analyze—Questions-Survey-Analyze   

1. First, have a checklist

2. Skim through the log several times

3. Write analysis notes

4. Have a list of questions based on problem description and steps 1-3

5. Survey the log

6. Write analysis notes

Repeat steps 2,3 and 5,6 if necessary.

This technique can also be applied to reading any large logs, for example, voluminous CDF or ETW traces.

- Dmitry Vostokov @ DumpAnalysis.org -

Debugged Paper for Debugged! Magazine

Tuesday, February 24th, 2009

The first issue of Debugged! MZ/PE magazine is going to be printed on debugged paper (not to confused with common bugs-free paper used in publishing houses and printing factories). Once you open the first issue you would instantly recognize that!

- Dmitry Vostokov @ DumpAnalysis.org -

WDPF Book is #1 Assembly Language Bestseller

Monday, February 23rd, 2009

Looked this evening at Amazon and found that the book achieved #1 status (although it might not be the case at the time when you are reading this post):

#1 in  Books > Computers & Internet > Programming > Languages & Tools > Assembly Language Programming

- Dmitry Vostokov @ DumpAnalysis.org -

Riemann Programming Language

Monday, February 23rd, 2009

Named after Bernhard Riemann, this programming language gives software defects first-class status as alternative branches of computation, comparable with multivalued functions and Riemann surfaces. Bugs become first-class constructs. It is reflected in the language syntax, semantics and pragmatics. More on this later.

- Dmitry Vostokov @ DumpAnalysis.org -

OSMOSIS Memory Dumps

Monday, February 23rd, 2009

The main problem of memory dump analysis is the lack of consistent kernel virtual memory dumps saved on demand without system halt. LiveKd and Win32DD tools are physical memory dumpers only and do not save kernel memory dump files. These dumps are known to be inconsistent and I elaborated on different schemes to save memory consistently, for example, 1) to partition physical memory into 2 parts from OS boot time, 2) when memory snapshot is needed raise IRQL on all processors, 3) pump memory contents from one part to another (with compression if necessary, in such partition the reserved part of physical memory could be smaller), 4) lower IRQL on all processors to resume normal OS functions and 5) save consistent memory snapshot from reserved part of physical memory to a dump file in the background. The crucial feature of osmosis is its bipartite division and membrane. Hence the name of the project: 

OSMOSIS

Optimally Saved Memory of System Internal State

Optimally Saved Memory (of) Operating System Internal State


This is, of course, for OS running on physical machines, virtual machine case is much simpler in theory because we can freeze the whole VM or save its snapshot and later run an external tool or file converter on it.

- Dmitry Vostokov @ DumpAnalysis.org -

Memory Dump Analysis Pattern: A Definition

Tuesday, February 17th, 2009

I found today that I never came up with a definition for a memory dump analysis pattern and only mentioned similar design pattern definition in the first pattern post. Now it is time to draft it:

a common recurrent identifiable problem together with a set of recommendations and possible solutions to apply in a specific context

In memory dump analysis pattern catalogue some identified patterns are left without a set of recommendations and I’m going to rectify this in the nearest future.

- Dmitry Vostokov @ DumpAnalysis.org -

Wait Chain Patterns

Tuesday, February 17th, 2009

While preparing a presentation for an engineering conference I found that a page to reference various wait chain patterns is necessary, so I created this post:

I’ll update it as soon as I add more similar patterns.

- Dmitry Vostokov @ DumpAnalysis.org -

DLL Link Patterns

Tuesday, February 17th, 2009

While preparing a presentation for an engineering conference I found that another different page to reference link time problems is necessary, so I created this post:

I’ll update it as soon as I add more similar patterns.

- Dmitry Vostokov @ DumpAnalysis.org -

Memory Consumption Patterns

Tuesday, February 17th, 2009

While preparing a presentation for an engineering conference I found that yet another page to reference different kinds of insufficient memory patterns is necessary, so I created this post:

I’ll update it as soon as I add more similar patterns.

- Dmitry Vostokov @ DumpAnalysis.org -

Dynamic Memory Corruption Patterns

Tuesday, February 17th, 2009

While preparing a presentation for an engineering conference I found that another page to reference different kinds of dynamic memory corruption patterns is necessary, so I created this post too:

I’ll update it as soon as I add more similar patterns.

- Dmitry Vostokov @ DumpAnalysis.org -