Archive for the ‘Debugging’ Category

Tracing Best Practices

Wednesday, June 3rd, 2009

Good software engineers write good software trace statements. Good software support engineers and responsible customers trace(*) software wisely, enabling it at the right time and in the right quantities. The following preliminary article was written to help to trace software effectively to result in faster problem resolution via trace analysis:

Tracing Best Practices

Although, currently it’s geared towards CDF tracing in Citrix terminal services environment, these recommendations can be generalized to other traces as well and the article will be extended over time.

(*) Note the following terminological difference here. “Tracing” is meant in “select” / “start” / “stop” sense and not how to write good software trace statements during code construction and maintenance phases.

- Dmitry Vostokov @ TraceAnalysis.org -

Memory Dumps Show Signs of Economic Recovery

Monday, June 1st, 2009

The number of blog visits (excluding portal main page and other my blogs) was about 15,000 - 16,000 by the end of the last year and then it dropped to 13,000. I explain this as the fact that 5% - 10% of engineers were no longer interested in crash dumps and debugging due to layoffs. This month I see the number of visits exceeds 14,000 and this surely makes me more optimistic about the prospect of economic recovery:

- Dmitry Vostokov @ DumpAnalysis.org -

New Portal Store

Sunday, May 31st, 2009

DumpAnalysis.org has changed its book store to Amazon aStore to incorporate all published OpenTask books, magazines and notebooks:

Here is the direct link:

Dump Analysis Portal Store

The screenshot:

 - Dmitry Vostokov @ DumpAnalysis.org -

Exception Addresses from Event Logs

Thursday, May 28th, 2009

One of the questions that is often asked is about exception addresses in application and system event logs. For example, we have this typical log entry:

"The instruction at "0x77ca8fa7" referenced memory address "0x00000000". The memory could not be read."

Suppose the dump is not available. Can we find the function address to look in our problem database?

My answer here is usually the following:

Even if the application is no longer running we can either noninvasively attach a debugger to it or get a user dump of it and later find the nearest address using ln WinDbg command (remember to apply correct symbols first, see windbg.org):

0:000> ln 77ca8fa7
(77ca8f91)   msvcrt!wcscpy+0×16   |  (77ca8fd6)   msvcrt!wcspbrk

Usually applications crash inside functions and not at their entry addresses, so we pay attention to wcscpy function because it has the offset +0×16.

Note: on Vista and W2K8 due to ASLR, system DLLs could be at different addresses if we take the dump of or attach to a different running process instance.

- Dmitry Vostokov @ DumpAnalysis.org -

Software Trace - A Mathematical Definition

Tuesday, May 26th, 2009

What is a software trace from a mathematical standpoint? Before any software writes its trace data, it assembles it in memory. Therefore, generally, a software trace is a linear ordered sequence of specifically prepared memory fragments (trace statements):

(ts1, ts2, …, tsn

where every tsi is a sequence of bits, bytes or other discrete units (see the definition of a memory dump):

(s11, s12, …, s1k, s21, s22, …, s2l, …, …, …, sn1, sn2, …, snm)

These trace statements can also be minidumps, selected regions of memory space. In the limit, if every tsi is a full memory snapshot saved at an instant of time (ti) we have a sequence of memory dumps:

(mt1, mt2, …, mtn

Like with memory dump analysis we need symbol files to interpret saved memory fragments unless they were already interpreted during their construction. For example, traces written according ETW specification (Event Tracing for Windows), need TMF files (Trace Message Format) for their interpretation and viewing. Usually these files are generated from PDB files and therefore we have this correspondence:

memory dump file -> software trace file

PDB file -> TMF file 

- Dmitry Vostokov @ TraceAnalysis.org -

Bugtation No.95

Monday, May 25th, 2009

“A trace is a narrative, the story of a computation.”

Dmitry Vostokov, Software Tracing and Logging: Architecture, Design, Implementation and Analysis Patterns

- Dmitry Vostokov @ TraceAnalysis.org -

Collapsed Stack Trace

Saturday, May 23rd, 2009

This is a stack trace (backtrace) where all finctions are removed and only modules are left. Useful for depicting component dependencies. Here is an example:

0: kd> kc 100
nt!KiSwapContext
nt!KiSwapThread
nt!KeDelayExecutionThread
3rdPartyAVDriver
3rdPartyAVDriver
3rdPartyAVDriver
3rdPartyAVDriver
nt!IofCallDriver
DriverA!Dispatch
DriverA!KUI_dispatch
nt!IofCallDriver
DriverB!PassThrough
DriverB!Dispatch
nt!IofCallDriver
DriverC!LowerPassThrough
DriverC
DriverC
DriverC
DriverC!DispatchPassThrough
nt!IofCallDriver
nt!IopParseDevice
nt!ObpLookupObjectName
nt!ObOpenObjectByName
nt!IopCreateFile
nt!IoCreateFile
nt!NtOpenFile
nt!KiFastCallEntry
ntdll!KiFastSystemCallRet
ntdll!NtOpenFile
ntdll!LdrpCreateDllSection
ntdll!LdrpMapDll
ntdll!LdrpLoadDll
ntdll!LdrLoadDll
kernel32!LoadLibraryExW
kernel32!LoadLibraryW
ntdll!LdrpCallInitRoutine
ntdll!LdrpRunInitializeRoutines
ntdll!LdrpLoadDll
ntdll!LdrLoadDll
kernel32!LoadLibraryExW
kernel32!LoadLibraryW
USER32!LoadAppDlls
USER32!ClientThreadSetup
USER32!__ClientThreadSetup
ntdll!KiUserCallbackDispatcher
nt!KiCallUserMode
nt!KeUserModeCallback
win32k!xxxClientThreadSetup
win32k!xxxCreateThreadInfo
win32k!UserThreadCallout
win32k!W32pThreadCallout
nt!PsConvertToGuiThread
nt!KiBBTUnexpectedRange

Collapsed stack trace is much simpler to grasp: 

nt
3rdPartyAVDriver
nt
DriverA
nt
DriverB
nt
DriverC
nt
ntdll
kernel32
ntdll
kernel32
USER32
ntdll
nt
win32k
nt

- Dmitry Vostokov @ DumpAnalysis.org -

Graphical Notation for Memory Dumps (Part 1)

Saturday, May 23rd, 2009

Inspired by Penrose tensor notation encountered in The Road to Reality book and Feynman diagrams I’d like to introduce Visual Dump Objects (VDO) graphical notation to depict and communicate memory dump analysis patterns, their combinations and analysis results. Let’s look at some basic visual objects (shown in handwriting).

1. A thread:

   or   

2. A function:

3. A module:

4. A thread running through functions, modules or both (stack trace). Optional arrowhead can indicate stack trace direction:

  or    or  

Threads running through modules depict collapsed stack traces.

5. A blocked thread:

An example of 3 threads blocked by another thread (an arrowhead can disambiguate the direction of the waiting chain):

6. A spiking thread (colors are encouraged in VDO notation):

   or   

7. Space boundary between user land and kernel land:


Here is an example of the thread spiking in kernel space:

or with modules from stack trace:

More notation to come very soon.

- Dmitry Vostokov @ DumpAnalysis.org -

On Debugging

Saturday, May 23rd, 2009

Instead of publishing another philosophical treatise ”On …”, OpenTask, iterative and incremental publisher, plans to release my collection of bugtations in somewhat extended version by the end of this summer:  

On Debugging: Bugtations and Other Humorous Quotations (ISBN: 978-1906717285)

The book also includes short biographical notes, commentaries and relevant explanations. Hope you would enjoy it. 

- Dmitry Vostokov @ DumpAnalysis.org -

Bugtation No.94

Saturday, May 23rd, 2009

Universal memory dumps come from astronomical observations:

Dumps “are meaningless without” symbols “to interpret them.”

Raymond Arthur Lyttleton, Quoted in Astroparticle Physics, page 50

- Dmitry Vostokov @ DumpAnalysis.org -

Bugtation No.93

Friday, May 22nd, 2009

“Oh, he is a good” troubleshooter, “but he has no power of” debugging!”

Charles Darwin, The life and letters of Charles Darwin, Volume 1

- Dmitry Vostokov @ DumpAnalysis.org -

Comparative Memory Dump Analysis: CPU Spikes

Friday, May 22nd, 2009

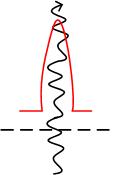
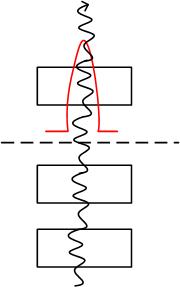
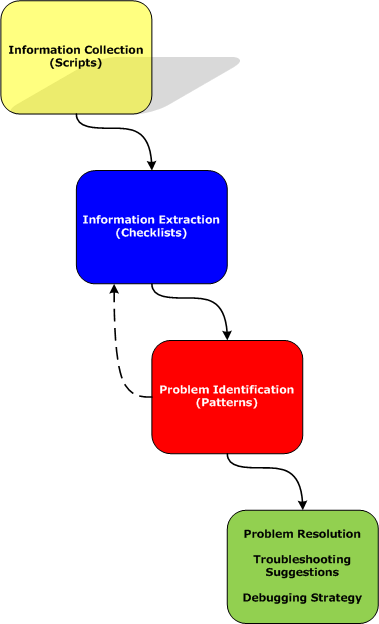
Comparative analysis is based on saving several consecutive memory dump files to see similarities and differences. Most often this technique is used for memory leaks, for example, process heap leaks. Here we see another example related to CPU spikes.

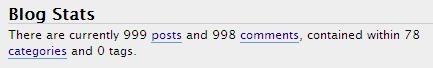
One application was spiking CPU and its user dump file was saved manually. !runaway WinDbg command showed the following distribution of kernel and user thread times:

0:000> !runaway f
 User Mode Time
  Thread       Time
  14:f48       0 days 1:22:34.343
  15:f4c       0 days 0:00:45.671
  17:f54       0 days 0:00:41.359
  18:f58       0 days 0:00:33.468
  16:f50       0 days 0:00:24.171
  12:f40       0 days 0:00:17.531
  13:f44       0 days 0:00:07.109
   0:f10       0 days 0:00:00.500
[…]
 Kernel Mode Time
  Thread       Time
  15:f4c       0 days 0:00:51.046
  17:f54       0 days 0:00:41.125
  18:f58       0 days 0:00:32.765
  16:f50       0 days 0:00:23.500
  12:f40       0 days 0:00:18.671
  13:f44       0 days 0:00:07.453
  14:f48       0 days 0:00:02.031
   1:f14       0 days 0:00:00.343
[…]
 Elapsed Time
  Thread       Time
   1:f14       0 days 12:01:42.656
   0:f10       0 days 12:01:42.656
  24:f70       0 days 12:01:42.093
  23:f6c       0 days 12:01:42.093
  22:f68       0 days 12:01:42.093
  21:f64       0 days 12:01:42.093
  20:f60       0 days 12:01:42.093
  19:f5c       0 days 12:01:42.093
  18:f58       0 days 12:01:42.093
  17:f54       0 days 12:01:42.093
  16:f50       0 days 12:01:42.093
  15:f4c       0 days 12:01:42.093
  14:f48       0 days 12:01:42.093
  13:f44       0 days 12:01:42.093
[…]

We see that thread #14 spent 1 hour and 22 minutes in user space and only 2 seconds in kernel space. Its thread stack showed DllA and DllB modules:

0:000> ~14s
*** ERROR: Symbol file could not be found.  Defaulted to export symbols for DllA.dll -
eax=00010da2 ebx=09227bdc ecx=09236bcc edx=0000003a esi=006769e4 edi=00000335
eip=6120b231 esp=00fefd04 ebp=00fefd2c iopl=0 nv up ei pl zr na pe nc
cs=001b ss=0023 ds=0023 es=0023 fs=003b gs=0000 efl=00000246
DllA!foo+0×3549:
6120b231 8b45ec          mov     eax,dword ptr [ebp-14h] ss:0023:00fefd18=09251a30

0:000> kv
ChildEBP RetAddr  Args to Child             
WARNING: Stack unwind information not available. Following frames may be wrong.
00fefd2c 6120be31 00000063 8633cdb9 006769e4 DllA!foo+0×3549
00fefd64 6120c6db 00fefe00 00006f07 0353f594 DllA!foo+0×4149
00fefdbc 6120d517 00fefe00 00fefde8 8633cd25 DllA!foo+0×49f3
00fefdf8 6120db4d 0353f594 09251848 00000000 DllA!foo+0×582f
00fefe14 6120f280 006769a0 00000000 0000020c DllA!foo+0×5e65
00fefe84 00933436 0000020c 0353f5ac 00000001 DllA!foo+0×7598

00fefec0 008414f1 0353f580 034db5d0 00000003 DllB!read+0xc6
[…]
00feffb8 77e64829 0078f290 00000000 00000000 msvcr71!_endthreadex+0xa0
00feffec 00000000 7c3494f6 0078f290 00000000 kernel32!BaseThreadStart+0×34

These modules belong to different vendors and the code could loop in DllB or in one of DllA functions. In order to show statistically which module is more suspect than the other, we requested 3 consecutive memory dumps of the same spiking process. They revealed the similar uniform pattern:

0:000> !runaway f
 User Mode Time
  Thread       Time
  16:e5c       0 days 1:37:24.640
   0:e1c       0 days 0:00:00.640
  17:e60       0 days 0:00:00.453
  18:e64       0 days 0:00:00.328
  15:e58       0 days 0:00:00.265
  14:e54       0 days 0:00:00.203
[…]
 Kernel Mode Time
  Thread       Time
  16:e5c       0 days 0:00:00.687
  15:e58       0 days 0:00:00.421
  17:e60       0 days 0:00:00.375
  14:e54       0 days 0:00:00.265
  18:e64       0 days 0:00:00.250
   0:e1c       0 days 0:00:00.046
[…]
 Elapsed Time
  Thread       Time
   1:e20       0 days 4:41:11.562
   0:e1c       0 days 4:41:11.562
  18:e64       0 days 4:41:10.875
  17:e60       0 days 4:41:10.875
  16:e5c       0 days 4:41:10.875
  15:e58       0 days 4:41:10.875
  14:e54       0 days 4:41:10.875
  13:e50       0 days 4:41:10.875
  12:e4c       0 days 4:41:10.875
  11:e48       0 days 4:41:10.875
  10:e44       0 days 4:41:10.875
   9:e40       0 days 4:41:10.875
   8:e3c       0 days 4:41:10.875
   7:e38       0 days 4:41:10.875
   6:e34       0 days 4:41:10.875
   5:e30       0 days 4:41:10.875
   4:e2c       0 days 4:41:10.875
   3:e28       0 days 4:41:10.875
   2:e24       0 days 4:41:10.875
[…]

1st dump file: Process Uptime: 0 days 4:41:12.000

0:000> ~16r
eax=07abbb6c ebx=07ab45d4 ecx=07ab4604 edx=00679344 esi=006769e4 edi=00000035
eip=6120b23e esp=0106fd30 ebp=0106fd58 iopl=0 nv up ei pl zr na pe nc
cs=001b ss=0023 ds=0023 es=0023 fs=003b gs=0000 efl=00000246
DllA!foo+0×3556:
6120b23e 8bcb            mov     ecx,ebx

0:000> ~16kv
ChildEBP RetAddr  Args to Child             
WARNING: Stack unwind information not available. Following frames may be wrong.
0106fd58 6120be31 0000000b 47d6689c 006769e4 DllA!foo+0×3556
0106fd90 6120c6db 0106fe2c 00007329 0342d14c DllA!foo+0×4149
0106fde8 6120d517 0106fe2c 0106fe14 47d66b28 DllA!foo+0×49f3
0106fe24 6120db4d 0342d14c 07abb960 00000000 DllA!foo+0×582f
0106fe40 6120f280 006769a0 00000000 000001d8 DllA!foo+0×5e65
0106feb0 00933436 000001d8 0342d164 00000001 DllA!foo+0×7598

0106feec 008414f1 0342d138 00000000 0340b290 DllB!read+0xc6
[…]
0106ffb8 77e64829 00784be0 00000000 00000000 msvcr71!_endthreadex+0xa0
0106ffec 00000000 7c3494f6 00784be0 00000000 kernel32!BaseThreadStart+0×34

2nd dump file: Process Uptime: 0 days 4:41:42.000

0:000> ~16r
eax=0002550b ebx=00679344 ecx=07ab45d4 edx=00000009 esi=006769e4 edi=00000035
eip=6120b231 esp=0106fd30 ebp=0106fd58 iopl=0 nv up ei pl zr na pe nc
cs=001b ss=0023 ds=0023 es=0023 fs=003b gs=0000 efl=00000246
*** ERROR: Symbol file could not be found.  Defaulted to export symbols for DllA.dll -
DllA!foo+0×3549:
6120b231 8b45ec          mov     eax,dword ptr [ebp-14h] ss:0023:0106fd44=07abbb48

0:000> ~16kv
ChildEBP RetAddr  Args to Child             
WARNING: Stack unwind information not available. Following frames may be wrong.
0106fd58 6120be31 0000000b 47d6689c 006769e4 DllA!foo+0×3549
0106fd90 6120c6db 0106fe2c 00007329 0342d14c DllA!foo+0×4149
0106fde8 6120d517 0106fe2c 0106fe14 47d66b28 DllA!foo+0×49f3
0106fe24 6120db4d 0342d14c 07abb960 00000000 DllA!foo+0×582f
0106fe40 6120f280 006769a0 00000000 000001d8 DllA!foo+0×5e65
0106feb0 00933436 000001d8 0342d164 00000001 DllA!foo+0×7598

0106feec 008414f1 0342d138 00000000 0340b290 DllB!read+0xc6
[…]
0106ffb8 77e64829 00784be0 00000000 00000000 msvcr71!_endthreadex+0xa0
0106ffec 00000000 7c3494f6 00784be0 00000000 kernel32!BaseThreadStart+0×34

3rd dump file: Process Uptime: 0 days 4:41:59.000

0:000> ~16r
eax=07abbb6c ebx=07ab4604 ecx=07ab45d4 edx=07ab4604 esi=006769e4 edi=00000035
eip=6120b239 esp=0106fd30 ebp=0106fd58 iopl=0 nv up ei pl zr na pe nc
cs=001b ss=0023 ds=0023 es=0023 fs=003b gs=0000 efl=00000246
DllA!foo+0×3551:
6120b239 895108          mov     dword ptr [ecx+8],edx ds:0023:07ab45dc=07ab4604

0:000> ~16kv
ChildEBP RetAddr  Args to Child             
WARNING: Stack unwind information not available. Following frames may be wrong.
0106fd58 6120be31 0000000b 47d6689c 006769e4 DllA!foo+0×3551
0106fd90 6120c6db 0106fe2c 00007329 0342d14c DllA!foo+0×4149
0106fde8 6120d517 0106fe2c 0106fe14 47d66b28 DllA!foo+0×49f3
0106fe24 6120db4d 0342d14c 07abb960 00000000 DllA!foo+0×582f
0106fe40 6120f280 006769a0 00000000 000001d8 DllA!foo+0×5e65
0106feb0 00933436 000001d8 0342d164 00000001 DllA!foo+0×7598

0106feec 008414f1 0342d138 00000000 0340b290 DllB!read+0xc6
[…]
0106ffb8 77e64829 00784be0 00000000 00000000 msvcr71!_endthreadex+0xa0
0106ffec 00000000 7c3494f6 00784be0 00000000 kernel32!BaseThreadStart+0×34

We see exactly the same stack trace except the first (top) frame. The offset differs very little: +0×3556, +0×3549 (twice) and +0×3551. We can suspect the small loop here:

0:000> ub
DllA!foo+0x3549:
6120b231 8b45ec          mov     eax,dword ptr [ebp-14h]
6120b234 8d0490          lea     eax,[eax+edx*4]
6120b237 8b10            mov     edx,dword ptr [eax]
6120b239 895108          mov     dword ptr [ecx+8],edx
6120b23c 8908            mov     dword ptr [eax],ecx
6120b23e 8bcb            mov     ecx,ebx
6120b240 85db            test    ebx,ebx
6120b242 75e3            jne     DllA!foo+0x353f (6120b227)

0:000> ub 6120b231
DllA!foo+0x3535:
6120b21d 8b4d08          mov     ecx,dword ptr [ebp+8]
6120b220 8b0c88          mov     ecx,dword ptr [eax+ecx*4]
6120b223 3bcb            cmp     ecx,ebx
6120b225 741d            je      DllA!foo+0x355c (6120b244)
6120b227 8b5908          mov     ebx,dword ptr [ecx+8]
6120b22a 8b410c          mov     eax,dword ptr [ecx+0Ch]
6120b22d 33d2            xor     edx,edx
6120b22f f7f7            div     eax,edi

0:000> u
DllA!foo+0x3549:
6120b231 8b45ec          mov     eax,dword ptr [ebp-14h]
6120b234 8d0490          lea     eax,[eax+edx*4]
6120b237 8b10            mov     edx,dword ptr [eax]
6120b239 895108          mov     dword ptr [ecx+8],edx
6120b23c 8908            mov     dword ptr [eax],ecx
6120b23e 8bcb            mov     ecx,ebx
6120b240 85db            test    ebx,ebx
6120b242 75e3            jne     DllA!foo+0x353f (6120b227)

0:000> u 6120b242
DllA!foo+0x355a:
6120b242 75e3            jne     DllA!foo+0x353f (6120b227)
6120b244 ff4508          inc     dword ptr [ebp+8]
6120b247 8b4508          mov     eax,dword ptr [ebp+8]
6120b24a 3b4608          cmp     eax,dword ptr [esi+8]
6120b24d 72cc            jb      DllA!foo+0x3533 (6120b21b)
6120b24f ff36            push    dword ptr [esi]
6120b251 e88dc70000      call    DllA!foo+0xfcfb (612179e3)
6120b256 59              pop     ecx

All this strongly rules out DllB and points to DllA as the first vendor contact.

- Dmitry Vostokov @ DumpAnalysis.org -

Software Tracing and Logging

Monday, May 18th, 2009

This is a forthcoming book to be released next year after we finally publish DebugWare book by the end of this summer:

Software Tracing and Logging: Architecture, Design, Implementation and Analysis Patterns (ISBN: 978-1906717728)

I have already begun working on it in the background. The scope of DebugWare book is too wide to cover tracing and logging in great detail not to mention the very important subject of software trace analysis.

- Dmitry Vostokov @ TraceAnalysis.org -

1000 Blog Posts: T&D Labyrinth

Monday, May 18th, 2009

This post number is 1,000. Wordpress admin panel reports that I have written 999 (excluding this one):

Of course, I wrote my 1,000th blog post some time ago if I count all my 7 blogs but this is 1,000th post for just this blog.

To celebrate this event, I’m posting a picture of troubleshooting and debugging labyrinth resting on a notion of universal memory dumps that are observational snapshots and include both memory and various traces we collect to resolve problems.


This picture shows how we arrive to problem resolution. For example:  

I’m also working on another picture, called T&D Tangram :-)

- Dmitry Vostokov @ DumpAnalysis.org -

Pattern-Driven Memory Analysis (Part 3)

Thursday, May 14th, 2009

Part 2 briefly discussed debuggers and their commands. Debugger commands can be grouped together into scripts that can be run against memory dump files and their resulted textual output can be redirected to log files.

Therefore we start with the first step in our analysis process diagram introduced in Part 1:

Information Collection: Scripts

Here a script is a sequence of instructions to extract formatted textual information from a memory dump file (or a live system). There are many advantages of scripts and logs. Many companies, for example, banks, avoid sending plain memory dump files because of security considerations in order to prevent exposure of company or private information. After the advent of 64-bit personal computing complete memory dump files became larger and larger and it is now common to get 32Gb memory dumps. Processing multiple long-running commands can easily be done from textual log files. Additionally, scripts can be used to process hundreds of memory dumps in one go to look for similarities and differences. Many tools can be used for such purpose including built-in debugger scripting capabilities, shell scripting and regular expressions for intelligent search.

- Dmitry Vostokov @ DumpAnalysis.org -

Bugtation No.92

Wednesday, May 13th, 2009

“To” debug “is proper to man.”

François Rabelais, Gargantua and Pantagruel

- Dmitry Vostokov @ DumpAnalysis.org -

Sentinel Pointers

Wednesday, May 13th, 2009

Consider this crash point:

0:000> r
eax=02d0f15c ebx=02a62918 ecx=77e41c30 edx=00000000 esi=ffffffff edi=02a8ed28
eip=76154193 esp=02d0f124 ebp=02d0f130 iopl=0 nv up ei pl zr na pe nc
cs=001b ss=0023 ds=0023 es=0023 fs=003b gs=0000 efl=00010246
Application!GetData+0xb:
76154193 8b9eac000000    mov     ebx,dword ptr [esi+0ACh] ds:0023:000000ab=????????

Seeing 000000ab address we can think that ESI was 0 but it was 0xFFFFFFFF. Adding 0xAC to it produced an effective NULL data pointer 0xAB through integer addition overflow if we consider addition as unsigned. It is easy to see the result if we consider 0xFFFFFFFF as signed -1. Looking at stack trace and function disassembly we see that 0xFFFFFFFF was passed as a parameter:

0:000> kv
ChildEBP RetAddr  Args to Child             
02d0f130 7616328d ffffffff 02d0f15c 02d0f150 Application!GetData+0xb
[…]
02d0ffec 00000000 740420d8 02a74070 00000000 kernel32!BaseThreadStart+0×34

0:000> u Application!GetData
Application!GetData:
76154188 mov     edi,edi
7615418a push    ebp
7615418b mov     ebp,esp
7615418d push    ecx
7615418e push    ebx
7615418f push    esi
76154190 mov     esi,dword ptr [ebp+8]
76154193 mov     ebx,dword ptr [esi+0ACh]

This is an example of a sentinel pointer marking the end of a linked list, for example, although NULL pointers having 0 value are usually used. Also -1 value can be used to assign an invalid pointer value. 

- Dmitry Vostokov @ DumpAnalysis.org -

Stack trace, invalid code pointer and hooked functions: pattern cooperation

Wednesday, May 13th, 2009

When looking at a stack trace of one crashed process we noticed an invalid code pointer. It is not a NULL code pointer but has the same stack trace pattern:

0:000> kL
ChildEBP RetAddr 
WARNING: Frame IP not in any known module. Following frames may be wrong.
0013dfb4 00401791 0×5e388583
0013fdf4 0040189f Application!RequestData+0×3e1

0013fee4 00401d0a Application!main+0×3f
0013ffc0 77e4f23b Application!mainCRTStartup+0×16c
0013fff0 00000000 kernel32!BaseProcessStart+0×23

When we look at raw stack data and examine the backward disassembly of the return address we see that invalid code was called from RequestData function and WinDbg stack trace reconstruction is not suspicious (it is structurally and semantically correct):

0:000> dds esp l10
0013dfb8  00401791 Application!RequestData+0x3e1
0013dfbc  00000140
0013dfc0  0013ee50
0013dfc4  00000fa4
0013dfc8  00000000
0013dfcc  00000000
0013dfd0  00000ece
0013dfd4  0013ffc0
0013dfd8  7ffdc000
0013dfdc  00000140
0013dfe0  0000054c
0013dfe4  50000002
0013dfe8  4b4919ac
0013dfec  00000000
0013dff0  00000000
0013dff4  003f003c

0:000> .asm no_code_bytes
Assembly options: no_code_bytes

0:000> ub 00401791
Application!RequestData+0x3c8:
00401778 Application!RequestData+0x3d0 (00401780)
0040177a lea     ebx,[ebx]
00401780 push    0
00401782 push    eax
00401783 lea     ecx,[esp+esi+0E30h]
0040178a push    ecx
0040178b push    edi
0040178c call    Application!recv (0040e382)

When seeing recv call we might suspect that the crash happened just inside that function because the raw stack data upwards (lower addresses) doesn’t have any execution residue left from nested function calls:

0:000> dds esp-100 esp
0013deb8  00000000
0013debc  00000000
0013dec0  00000000
0013dec4  00000000
0013dec8  00000000
0013decc  00000000
0013ded0  00000000
0013ded4  00000000
0013ded8  00000000
0013dedc  00000000
0013dee0  00000000
0013dee4  00000000
0013dee8  00000000
0013deec  00000000
0013def0  00000000
0013def4  00000000
0013def8  00000000
0013defc  00000000
0013df00  00000000
0013df04  00000000
0013df08  00000000
0013df0c  00000000
0013df10  00000000
0013df14  00000000
0013df18  00000000
0013df1c  00000000
0013df20  00000000
0013df24  00000000
0013df28  00000000
0013df2c  00000000
0013df30  00000000
0013df34  00000000
0013df38  00000000
0013df3c  00000000
0013df40  00000000
0013df44  00000000
0013df48  00000000
0013df4c  00000000
0013df50  00000000
0013df54  00000000
0013df58  00000000
0013df5c  00000000
0013df60  00000000
0013df64  00000000
0013df68  00000000
0013df6c  00000000
0013df70  00000000
0013df74  00000000
0013df78  00000000
0013df7c  00000000
0013df80  00000000
0013df84  00000000
0013df88  00000000
0013df8c  00000000
0013df90  00000000
0013df94  00000000
0013df98  00000000
0013df9c  00000000
0013dfa0  00000000
0013dfa4  00000000
0013dfa8  00000000
0013dfac  00000000
0013dfb0  00000000
0013dfb4  00000000
0013dfb8  00401791 Application!RequestData+0x3e1

So we follow recv call forward disassembly (notice that the first jump is indirect):

0:000> u 0040e382
Application!recv:
0040e382 jmp     dword ptr [Application!_imp__recv (00410180)]

Application!closesocket:
0040e388 jmp     dword ptr [Application!_imp__closesocket (00410170)]
Application!WSAGetLastError:
0040e38e jmp     dword ptr [Application!_imp__WSAGetLastError (00410174)]
Application!send:
0040e394 jmp     dword ptr [Application!_imp__send (00410178)]
Application!connect:
0040e39a jmp     dword ptr [Application!_imp__connect (0041017c)]
Application!htons:
0040e3a0 jmp     dword ptr [Application!_imp__htons (00410198)]
Application!setsockopt:
0040e3a6 jmp     dword ptr [Application!_imp__setsockopt (00410184)]
Application!socket:
0040e3ac jmp     dword ptr [Application!_imp__socket (00410188)]

0:000> dps 00410180 l10
00410180  71ad2f7f ws2_32!recv
00410184  71ad2d47 ws2_32!setsockopt
00410188  71ad410c ws2_32!socket
0041018c  71ad7ca1 ws2_32!gethostbyname
00410190  71ad4f3b ws2_32!WSAStartup
00410194  71ad7b5b ws2_32!gethostname
00410198  71ad28bc ws2_32!htons
0041019c  71ad3da8 ws2_32!WSACleanup
004101a0  00000000
004101a4  00000000
004101a8  00000000
004101ac  00000000
004101b0  00000000
004101b4  45cd184e
004101b8  00000000
004101bc  00000002

0:000> u 71ad2f7f
ws2_32!recv:
71ad2f7f jmp     7fd60000

71ad2f84 sub     esp,10h
71ad2f87 push    ebx
71ad2f88 xor     ebx,ebx
71ad2f8a cmp dword ptr [ws2_32!PrologPointer (71ae4044)],offset ws2_32!Prolog_v2 (71ad6067)
71ad2f94 push    esi
71ad2f95 je      ws2_32!recv+0×18 (71ad6207)
71ad2f9b lea     eax,[ebp-8]

0:000> u 7fd60000
7fd60000 jmp     DllA!recv_patch (612101b6)
7fd60005 mov     edi,edi
7fd60007 push    ebp
7fd60008 mov     ebp,esp
7fd6000a jmp     ws2_32!recv+0×5 (71ad2f84)
7fd6000f add     byte ptr [eax],al
7fd60011 add     byte ptr [eax],al
7fd60013 add     byte ptr [eax],al

Finally we see that sockets library functions were patched by a 3rd-party module DllA and we need to contact its vendor.

- Dmitry Vostokov @ DumpAnalysis.org -

The Structure of MDA Certification

Tuesday, May 12th, 2009

Previously announced memory dump analysis certification will have x86/x64-based tracks for Windows and Unix (including Linux / FreeBSD / Mac OS X). Each track consists of 3 exams, each having its own set of requirements and scope:

  • Fundamentals of Memory Dump Analysis
  • Intermediate Memory Dump Analysis
  • Advanced Memory Dump Analysis

More information will be available later. The initiative is supported by OpenTask.

- Dmitry Vostokov @ DumpAnalysis.org -

Memory Dump Analysis Certification (Part 1)

Monday, May 11th, 2009

This is an example from the sample question set of the forthcoming memory dump analysis certification planned by Memory Analysis and Debugging Institute. You can reply to this post with your answers.

Q. Interpret the fragment from WinDbg output below.

0:002> !teb
[...]
TEB at 7efaf000
[...]

0:002> dds poi(7efaf000+8) poi(7efaf000+4)
01192000  00000000
01192004  00000000
01192008  00000000
[...]
0119e448  00010020
0119e44c  00030002
0119e450  00050004
0119e454  00070006
0119e458  00090008
0119e45c  000b000a
0119e460  000d000c
0119e464  000f000e
0119e468  00110010
0119e46c  00130012
0119e470  00150014
0119e474  00170016
0119e478  00190018
0119e47c  001b001a
0119e480  001d001c
0119e484  001f001e
0119e488  00210020
0119e48c  00230022
0119e490  00250024
0119e494  00270026
0119e498  00290028
0119e49c  002b002a
0119e4a0  002d002c
0119e4a4  002f002e
0119e4a8  00310030
0119e4ac  00330032
0119e4b0  00350034
0119e4b4  00370036
0119e4b8  00390038
0119e4bc  003b003a
0119e4c0  003d003c
0119e4c4  003f003e
0119e4c8  00410040 MyService!__InternalCxxFrameHandler+0x5c
0119e4cc  00430042
0119e4d0  00450044
0119e4d4  00470046
0119e4d8  00490048
0119e4dc  004b004a
0119e4e0  004d004c
0119e4e4  004f004e
0119e4e8  00510050 advapi32!`string'+0x164
0119e4ec  00530052 advapi32!GetPerflibKeyValue+0x184
0119e4f0  00550054 advapi32!`string'+0x20c
0119e4f4  00570056 advapi32!_NULL_IMPORT_DESCRIPTOR+0x2714
0119e4f8  00590058 advapi32!szPerflibSectionName <PERF> (advapi32+0x90058)
0119e4fc  005b005a shlwapi!_CRT_INIT+0xaf
0119e500  005d005c shlwapi!_OpenProgidKey+0xee
0119e504  005f005e shlwapi!_pRawDllMain <PERF> (shlwapi+0x5005e)
0119e508  00410060 MyService!__InternalCxxFrameHandler+0x7c
0119e50c  00430042
0119e510  00450044
0119e514  00470046
0119e518  00490048
0119e51c  004b004a
0119e520  004d004c
0119e524  004f004e
0119e528  00510050 advapi32!`string'+0x164
0119e52c  00530052 advapi32!GetPerflibKeyValue+0x184
0119e530  00550054 advapi32!`string'+0x20c
0119e534  00570056 advapi32!_NULL_IMPORT_DESCRIPTOR+0x2714
0119e538  00590058 advapi32!szPerflibSectionName <PERF> (advapi32+0x90058)
0119e53c  007b005a
0119e540  007d007c
0119e544  007f007e
[...]

Choose all answers that are valid:

a. ASCII string fragment
b. Raw stack data
c. Exception handling
d. UNICODE string fragment
e. Partial stack traces
f. Performance monitoring
g. Execution residue

- Dmitry Vostokov @ DumpAnalysis.org -