Blog (Debugging Slang, Part 15)
Thursday, July 29th, 2010Blog - Binary log.
Examples: This program blogged. I’m reading its blog now.
- Dmitry Vostokov @ DumpAnalysis.org + TraceAnalysis.org -
Blog - Binary log.
Examples: This program blogged. I’m reading its blog now.
- Dmitry Vostokov @ DumpAnalysis.org + TraceAnalysis.org -
Here we show the possible signs of the classical Thread Starvation.
Suppose we have two running threads with a priority 8:
0: kd> !running
System Processors 3 (affinity mask)

  Idle Processors 0
Prcbs  Current   Next

  0    ffdff120  89a92020            O...............

  1    f7737120  89275020            W...............
0: kd> !thread 89a92020

THREAD 89a92020  Cid 11d8.27d8  Teb: 7ffd9000 Win32Thread: bc1e6860 RUNNING on processor 0

[...]

Priority 8 BasePriority 8 PriorityDecrement 0
0: kd> !thread 89275020

THREAD 89275020  Cid 1cd0.2510  Teb: 7ffa9000 Win32Thread: bc343180 RUNNING on processor 1

[...]

Priority 8 BasePriority 8 PriorityDecrement 0
If we have other threads ready with the same priority contending for the same processors other threads with less priority might starve (shown in red):
0: kd> !ready

Processor 0: Ready Threads at priority 8

    THREAD 894a1db0  Cid 1a98.25c0  Teb: 7ffde000 Win32Thread: bc19cea8 READY

    THREAD 897c4818  Cid 11d8.1c5c  Teb: 7ffa2000 Win32Thread: bc2c5ba8 READY

    THREAD 8911fd18  Cid 2730.03f4  Teb: 7ffd9000 Win32Thread: bc305830 READY

Processor 0: Ready Threads at priority 7

    THREAD 8a9e5ab0  Cid 0250.0470  Teb: 7ff9f000 Win32Thread: 00000000 READY

    THREAD 8a086838  Cid 0250.0654  Teb: 7ff93000 Win32Thread: 00000000 READY

    THREAD 8984b8b8  Cid 0250.1dc4  Teb: 7ff99000 Win32Thread: 00000000 READY

    THREAD 8912a4c0  Cid 0f4c.2410  Teb: 7ff81000 Win32Thread: 00000000 READY

    THREAD 89e5c570  Cid 0f4c.01c8  Teb: 00000000 Win32Thread: 00000000 READY

Processor 0: Ready Threads at priority 6

    THREAD 8a9353b0  Cid 1584.1598  Teb: 7ff8b000 Win32Thread: bc057698 READY

    THREAD 8aba2020  Cid 1584.15f0  Teb: 7ff9f000 Win32Thread: bc2a0ea8 READY

    THREAD 8aab17a0  Cid 1584.01a8  Teb: 7ff92000 Win32Thread: bc316ea8 READY

    THREAD 8a457020  Cid 1584.0634  Teb: 7ff8d000 Win32Thread: bc30fea8 READY

    THREAD 8a3d4020  Cid 1584.1510  Teb: 7ff8f000 Win32Thread: bc15b8a0 READY

    THREAD 8a5f5db0  Cid 1584.165c  Teb: 7ff9d000 Win32Thread: bc171be8 READY

    THREAD 8a297020  Cid 0f4c.0f54  Teb: 7ffde000 Win32Thread: bc20fda0 READY

    THREAD 8a126020  Cid 1584.175c  Teb: 7ffa9000 Win32Thread: 00000000 READY

    THREAD 8a548478  Cid 0250.07b0  Teb: 7ff9a000 Win32Thread: 00000000 READY

    THREAD 8a478020  Cid 0944.0988  Teb: 7ffd9000 Win32Thread: 00000000 READY

    THREAD 8986ad08  Cid 1d2c.1cf0  Teb: 7ffa8000 Win32Thread: bc285800 READY

    THREAD 897f4db0  Cid 1d2c.2554  Teb: 7ffdb000 Win32Thread: bc238e80 READY

    THREAD 89a2e618  Cid 1d2c.1de4  Teb: 7ffdd000 Win32Thread: bc203908 READY

Processor 0: Ready Threads at priority 0

    THREAD 8b184db0  Cid 0004.0008  Teb: 00000000 Win32Thread: 00000000 READY

Processor 1: Ready Threads at priority 8

    THREAD 89d89db0  Cid 1b10.20ac  Teb: 7ffd7000 Win32Thread: bc16e680 READY

    THREAD 891f24a8  Cid 1e2c.20d0  Teb: 7ffda000 Win32Thread: bc1b9ea8 READY

    THREAD 89214db0  Cid 1e2c.24d4  Teb: 7ffd7000 Win32Thread: bc24ed48 READY

    THREAD 89a28020  Cid 1b10.21b4  Teb: 7ffa7000 Win32Thread: bc25b3b8 READY

    THREAD 891e03b0  Cid 1a98.05c4  Teb: 7ffdb000 Win32Thread: bc228bb0 READY

    THREAD 891b0020  Cid 1cd0.0144  Teb: 7ffde000 Win32Thread: bc205ea8 READY

Processor 1: Ready Threads at priority 7

    THREAD 898367a0  Cid 0f4c.1cd4  Teb: 00000000 Win32Thread: 00000000 READY

    THREAD 8a1ac020  Cid 0f4c.1450  Teb: 00000000 Win32Thread: 00000000 READY

    THREAD 8aa1ab90  Cid 0f4c.11b0  Teb: 00000000 Win32Thread: 00000000 READY

    THREAD 89cc92e0  Cid 0f4c.1b34  Teb: 00000000 Win32Thread: 00000000 READY

    THREAD 89579020  Cid 0f4c.2220  Teb: 00000000 Win32Thread: 00000000 READY

Processor 1: Ready Threads at priority 6

    THREAD 8a487db0  Cid 1584.14bc  Teb: 7ffa2000 Win32Thread: bc304ea8 READY

    THREAD 8a3ce020  Cid 1584.0630  Teb: 7ff8e000 Win32Thread: bc293c20 READY

    THREAD 8a1b6db0  Cid 1584.1590  Teb: 7ff8c000 Win32Thread: bc310ea8 READY

    THREAD 8a1fe6e0  Cid 1584.15ec  Teb: 7ffa1000 Win32Thread: bc15bea8 READY

    THREAD 8ac0adb0  Cid 1584.156c  Teb: 7ff8a000 Win32Thread: bc153be8 READY

    THREAD 8b1e35a0  Cid 1584.15f4  Teb: 7ff9e000 Win32Thread: bc0567e8 READY

    THREAD 8a3288e8  Cid 1584.14b8  Teb: 7ff9a000 Win32Thread: bc2fbea8 READY

    THREAD 8a5056a0  Cid 1584.1518  Teb: 7ff91000 Win32Thread: bc337ea8 READY

    THREAD 891afdb0  Cid 1d2c.27e8  Teb: 7ffaf000 Win32Thread: bc217c18 READY

    THREAD 8a07d308  Cid 1d2c.2548  Teb: 7ffae000 Win32Thread: bc235750 READY

    THREAD 8a055d18  Cid 1584.17d0  Teb: 7ffd5000 Win32Thread: 00000000 READY

    THREAD 8ac0b770  Cid 0250.0268  Teb: 7ffde000 Win32Thread: bc2349d8 READY

    THREAD 8a0eeb40  Cid 1584.1560  Teb: 7ffdc000 Win32Thread: 00000000 READY
Here we should also analyze stack traces for running and ready threads with priority 8 and check kernel and user times. If we find anything common between them we should also check ready threads with lower priority to see if that commonality is unique to threads with priority 8. See also the similar pattern: Busy System and the similar starvation pattern resulted from realtime priority threads.
- Dmitry Vostokov @ DumpAnalysis.org + TraceAnalysis.org -
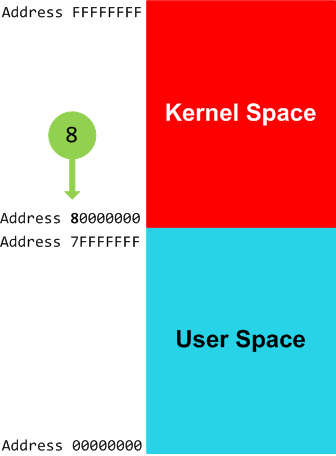
8
A separating digit of user space and kernel space in equi-bipartitional 32-bit virtual memory, for example, on x86 Windows systems:
RetAddr

80833491 nt!KiSwapContext+0×26

80828f2b nt!KiSwapThread+0×2e5

8099490a nt!KeDelayExecutionThread+0×2ab

808897cc nt!NtDelayExecution+0×84

7c82860c nt!KiFastCallEntry+0xfc

7c826f69 ntdll!KiFastSystemCallRet

7c83d454 ntdll!NtDelayExecution+0xc

77e6482f ntdll!RtlpTimerThread+0×47

00000000 kernel32!BaseThreadStart+0×34
lkd> lm
start end module name
[…]

77bd0000 77c19000 GDI32

77c20000 77cbf000 RPCRT4

77cd0000 77d5b000 OLEAUT32

77e20000 77eb2000 USER32

77ec0000 77f12000 SHLWAPI

77f30000 77fdc000 ADVAPI32

7c800000 7c915000 kernel32

7c920000 7c9e8000 ntdll

7c9f0000 7d1f9000 SHELL32

7e020000 7e02f000 SAMLIB

80800000 80a5d000 nt

80a5d000 80a89000 hal

bf800000 bf9d0000 win32k

[…]
This number doesn’t continue to be used in the same way on x64 Windows systems, for example:
RetAddr Call Site

fffff800`0167e082 nt!KiSwapContext+0×7a

fffff800`0167a34b nt!KiCommitThreadWait+0×1d2

fffff800`01973def nt!KeWaitForMultipleObjects+0×271

fffff800`019746f6 nt!ObpWaitForMultipleObjects+0×294

fffff800`01675ed3 nt!NtWaitForMultipleObjects+0xe5

00000000`77ca030a nt!KiSystemServiceCopyEnd+0×13
lkd> lm

start end module name

00000000`774a0000 00000000`7756d000 USER32

00000000`77570000 00000000`7769d000 kernel32

00000000`776a0000 00000000`77826000 ntdll

00000000`ffe60000 00000000`ffec0000 services

000007fe`fca90000 000007fe`fca97000 wshtcpip

000007fe`fcae0000 000007fe`fcb0c000 NTMARTA

000007fe`fcbe0000 000007fe`fcc34000 schannel

000007fe`fce10000 000007fe`fce5f000 mswsock

000007fe`fcf60000 000007fe`fcf69000 credssp

000007fe`fcf90000 000007fe`fcf97000 wship6

000007fe`fd0d0000 000007fe`fd207000 CRYPT32

000007fe`fd260000 000007fe`fd279000 MSASN1

000007fe`fd5a0000 000007fe`fd5b6000 NCObjAPI

000007fe`fd5c0000 000007fe`fd625000 SCESRV

000007fe`fd630000 000007fe`fd665000 apphelp

000007fe`fd680000 000007fe`fd6a6000 AUTHZ

000007fe`fd950000 000007fe`fd96c000 Secur32

000007fe`fd970000 000007fe`fd996000 USERENV

000007fe`fd9a0000 000007fe`fd9bc000 SAMLIB

000007fe`fdc80000 000007fe`fdce4000 GDI32

000007fe`fdd10000 000007fe`fdd1d000 LPK

000007fe`fdd20000 000007fe`fde28000 ADVAPI32

000007fe`fde30000 000007fe`fdecc000 msvcrt

000007fe`fded0000 000007fe`fdefd000 IMM32

000007fe`fdf00000 000007fe`fe0d8000 ole32

000007fe`fe0e0000 000007fe`fe0e7000 NSI

000007fe`fe190000 000007fe`fe22a000 USP10

000007fe`fe230000 000007fe`fe373000 RPCRT4

000007fe`ff340000 000007fe`ff395000 WLDAP32

000007fe`ff540000 000007fe`ff584000 WS2_32

000007fe`ff7d0000 000007fe`ff8d2000 MSCTF

fffff800`01802000 fffff800`01848000 hal

fffff800`01848000 fffff800`01d60000 nt

fffff960`000f0000 fffff960`003a1000 win32k

[…]
Synonyms:
Antonyms:
Also: virtual memory, user space, kernel space, x86, x64, 7
- Dmitry Vostokov @ DumpAnalysis.org + TraceAnalysis.org -
Today we introduce an icon for Hooked Functions (kernel space) pattern:
B/W
![]()
Color
![]()
- Dmitry Vostokov @ DumpAnalysis.org + TraceAnalysis.org -
Today we introduce an icon for Hooked Functions (user space) pattern:
B/W
![]()
Color
![]()
- Dmitry Vostokov @ DumpAnalysis.org + TraceAnalysis.org -
I’m pleased to announce that my book Windows Debugging: Practical Foundations is available on Amazon Kindle platform. It has been reformatted and edited to make it fit into the smallest Kindle device and pictures were specifically tailored to improve their viewing experience. The price has dropped to $9.99 (excluding possible VAT and international delivery if any). Please let me know if you have any problems with the content and I make any changes as soon as possible.
Windows Debugging: Practical Foundations (Kindle Edition)

- Dmitry Vostokov @ DumpAnalysis.org + TraceAnalysis.org -
Today we introduce an icon for High Contention (processors) pattern:
B/W
![]()
Color
![]()
- Dmitry Vostokov @ DumpAnalysis.org + TraceAnalysis.org -
Today we introduce an icon for Early Crash Dump pattern:
B/W
![]()
Color
![]()
- Dmitry Vostokov @ DumpAnalysis.org + TraceAnalysis.org -
![]()
Memory Dump Analysis Services (DumpAnalysis.com) organizes a free webinar
Date: 18th of August 2010
Time: 21:00 (BST) 16:00 (Eastern) 13:00 (Pacific)
Duration: 90 minutes
Topics include:
- User vs. kernel vs. physical (complete) memory space
- Challenges of complete memory dump analysis
- Common WinDbg commands
- Patterns
- Common mistakes
- Fiber bundles
- Hands-on exercise: a complete memory dump analysis
- A guide to DumpAnalysis.org case studies
Prerequisites: working knowledge of basic user process and kernel memory dump analysis or live debugging using WinDbg
The webinar link will be posted before 18th of August on DumpAnalysis.com
- Dmitry Vostokov @ DumpAnalysis.org + TraceAnalysis.org -
HCI - Hang-Crash Interruption. Based on Human-Computer Interaction.
Examples: I see an HCI issue again and again.
- Dmitry Vostokov @ DumpAnalysis.org + TraceAnalysis.org -
Today we introduce an icon for Local Buffer Overflow pattern:
B/W
![]()
Color
![]()
- Dmitry Vostokov @ DumpAnalysis.org + TraceAnalysis.org -
Sometimes we have threads that wait for a response from another machine (for example, via RPC) and for most of the time Coupled Processes pattern covers that if we assume that processes in that pattern are not restricted to same machine. However, sometimes we have threads that provide hints for dependency on an another machine through their data and that could also involve additional threads from different processes to accomplish the task. Here we have a need for another pattern that I call Coupled Machines. For example, the following thread on a computer SERVER_A is trying to set the current working directory that resides on a computer SERVER_B:
kd> kv 100

ChildEBP RetAddr  Args to Child

b881c8d4 804e1bf2 89cd9c80 89cd9c10 804e1c3e nt!KiSwapContext+0x2f

b881c8e0 804e1c3e 00000000 89e35b08 89e35b34 nt!KiSwapThread+0x8a

b881c908 f783092e 00000000 00000006 00000000 nt!KeWaitForSingleObject+0x1c2

b881c930 f7830a3b 89e35b08 00000000 f78356d8 Mup!PktPostSystemWork+0x3d

b881c94c f7836712 b881c9b0 b881c9b0 b881c9b8 Mup!PktGetReferral+0xce

b881c980 f783644f b881c9b0 b881c9b8 00000000 Mup!PktCreateDomainEntry+0x224

b881c9d0 f7836018 0000000b 00000000 b881c9f0 Mup!DfsFsctrlIsThisADfsPath+0x2bb

b881ca14 f7835829 89a2e130 899ba350 b881caac Mup!CreateRedirectedFile+0x2cd

b881ca70 804e13eb 89f46ee8 89a2e130 89a2e130 Mup!MupCreate+0x1cb

b881ca80 805794b6 89f46ed0 89df3c44 b881cc18 nt!IopfCallDriver+0x31

b881cb60 8056d03b 89f46ee8 00000000 89df3ba0 nt!IopParseDevice+0xa12

b881cbd8 805701e7 00000000 b881cc18 00000042 nt!ObpLookupObjectName+0x53c

b881cc2c 80579b12 00000000 00000000 00003801 nt!ObOpenObjectByName+0xea

b881cca8 80579be1 00cff67c 00100020 00cff620 nt!IopCreateFile+0x407

b881cd04 80579d18 00cff67c 00100020 00cff620 nt!IoCreateFile+0x8e

b881cd44 804dd99f 00cff67c 00100020 00cff620 nt!NtOpenFile+0x27

b881cd44 7c90e514 00cff67c 00100020 00cff620 nt!KiFastCallEntry+0xfc

00cff5f0 7c90d5aa 7c91e8dd 00cff67c 00100020 ntdll!KiFastSystemCallRet

00cff5f4 7c91e8dd 00cff67c 00100020 00cff620 ntdll!ZwOpenFile+0xc

00cff69c 7c831e58 00cff6a8 00460044 0078894a ntdll!RtlSetCurrentDirectory_U+0x169

00cff6b0 7731889e 0078894a 00000000 00000001 kernel32!SetCurrentDirectoryW+0×2b

00cffb84 7730ffbb 00788450 00788b38 00cffbe0 schedsvc!CSchedWorker::RunNTJob+0×221

00cffe34 7730c03a 01ea9108 8ed032d4 00787df8 schedsvc!CSchedWorker::RunJobs+0×304

00cffe74 77310e4d 7c80a749 00000000 00000000 schedsvc!CSchedWorker::RunNextJobs+0×129

00cfff28 77310efc 7730b592 00000000 000ba4bc schedsvc!CSchedWorker::MainServiceLoop+0×6d9

00cfff2c 7730b592 00000000 000ba4bc 0009a2bc schedsvc!SchedMain+0xb

00cfff5c 7730b69f 00000001 000ba4b8 00cfffa0 schedsvc!SchedStart+0×266

00cfff6c 010011cc 00000001 000ba4b8 00000000 schedsvc!SchedServiceMain+0×33

00cfffa0 77df354b 00000001 000ba4b8 0007e898 svchost!ServiceStarter+0×9e

00cfffb4 7c80b729 000ba4b0 00000000 0007e898 ADVAPI32!ScSvcctrlThreadA+0×12

00cfffec 00000000 77df3539 000ba4b0 00000000 kernel32!BaseThreadStart+0×37
kd> du /c 90 0078894a

0078894a  “\\SERVER_B\Share_X$\Folder_Q”
The next post will discuss a pattern cooperation case study including this pattern in more detail.
- Dmitry Vostokov @ DumpAnalysis.org + TraceAnalysis.org -
I knew it was my destiny! ![]()
kd> !analyze -vostokov
[...]
MANUALLY_INITIATED_CRASH (e2)

The user manually initiated this crash dump.

Arguments:

Arg1: 00000000

Arg2: 00000000

Arg3: 00000000

Arg4: 00000000
Debugging Details:

------------------
[...]
- Dmitry Vostokov @ DumpAnalysis.org + TraceAnalysis.org -
Have you heard about the new method of visual notepad debugging? You don’t even need a debugger, just a notepad. If not, here’s a recipe:
1. Open a buggy application executable file or a DLL file you suspect in notepad.exe
2. Change the font to Webdings
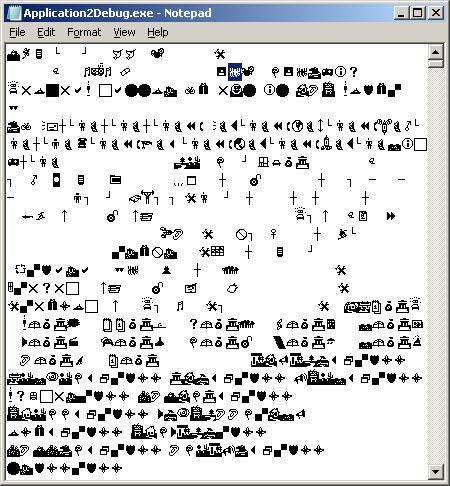
3. Search for a bang: ‘!’ (a bug in Webdings font)
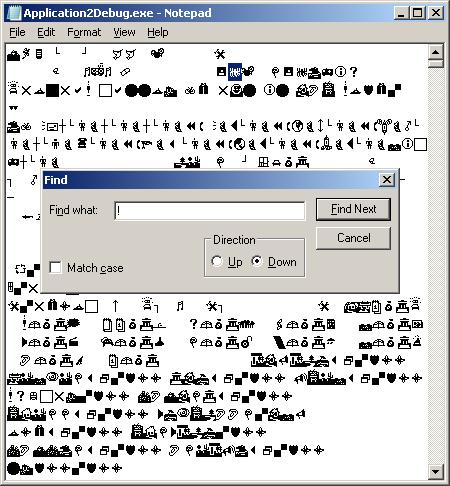
4. Remove the bug and repeat the search
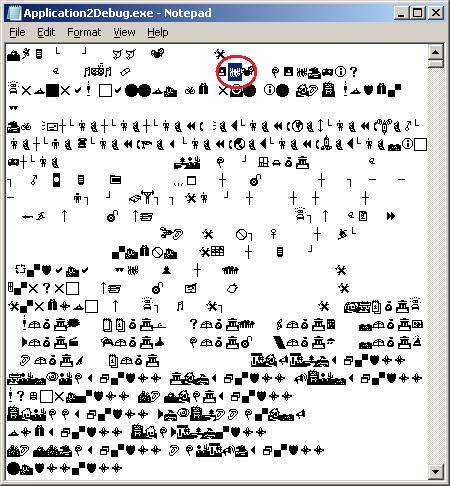
5. Remove that bug too
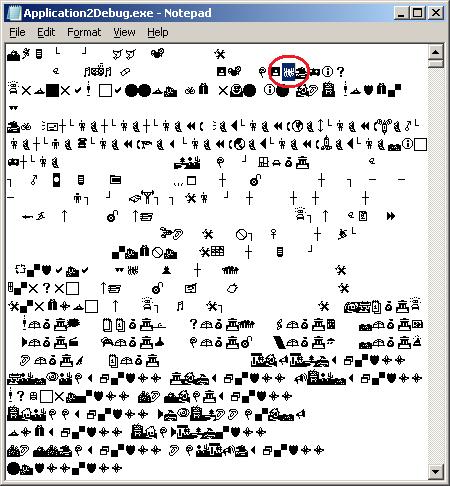
6. Find another bug and remove it too
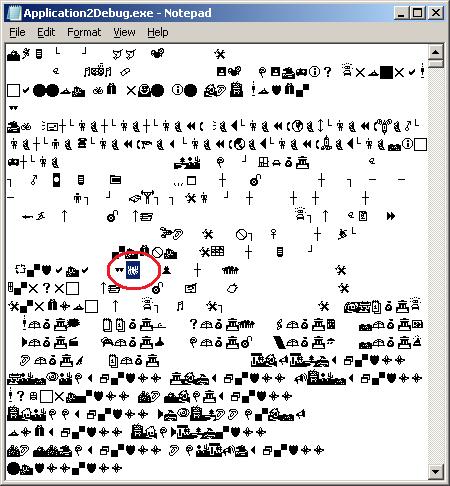
7. You might consider “Replace All” if there are too many bugs in your application
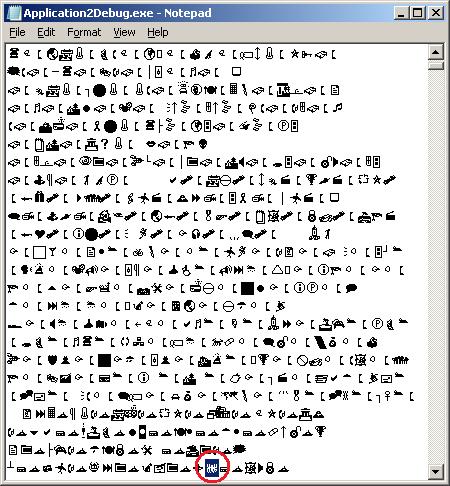
8. Save the debugged file
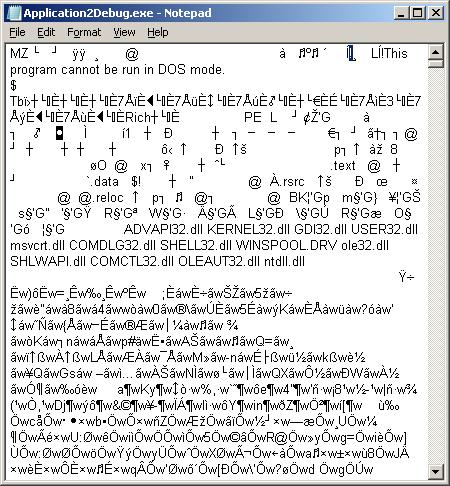
9. Run it - if it crashes do a postmortem analysis - may be you overfixed your bugs. Or you might see a transmutation, in my case the 32-bit Win32 Application2Debug.exe became an MS-DOS application silently terminating after the launch:
0:000> kL

ChildEBP RetAddr

011ef874 76e45500 ntdll!KiFastSystemCallRet

011ef878 76e1b518 ntdll!ZwTerminateProcess+0xc

011ef888 76be41ec ntdll!RtlExitUserProcess+0x7a

011ef89c 0e75c85f kernel32!ExitProcess+0x12

011ef8a4 0e79b07f ntvdm!host_terminate+0x23

011ef8b0 0e781db6 ntvdm!terminate+0x78

011efbfc 0e78094b ntvdm!cmdGetNextCmd+0x294

011efc04 0e769d94 ntvdm!CmdDispatch+0xf

011efc10 0e771882 ntvdm!MS_bop_4+0x2f

011efc14 0e77278a ntvdm!EventVdmBop+0x29

011efc2c 0e73510b ntvdm!cpu_simulate+0x17a

011efc38 0e735086 ntvdm!host_main+0x5f

011efc74 0e7352bd ntvdm!main+0x3a

011efd54 76bed0e9 ntvdm!host_main+0x211

011efd60 76e219bb kernel32!BaseThreadInitThunk+0xe

011efda0 76e2198e ntdll!__RtlUserThreadStart+0x23

011efdb8 00000000 ntdll!_RtlUserThreadStart+0x1b
- Dmitry Vostokov @ DumpAnalysis.org + TraceAnalysis.org -
This is a specialization of Blocked Thread pattern where a thread is waiting for a hardware I/O response. For example, a frozen system initialization thread is waiting for a response from one of ACPI general register ports:
kd> kL 100

ChildEBP RetAddr

f7a010bc f74c5a57 hal!READ_PORT_UCHAR+0×7

f7a010c8 f74c5ba4 ACPI!DefReadAcpiRegister+0xa1

f7a010d8 f74b4d78 ACPI!ACPIReadGpeStatusRegister+0×10

f7a010e4 f74b6334 ACPI!ACPIGpeIsEvent+0×14

f7a01100 8054157d ACPI!ACPIInterruptServiceRoutine+0×16

f7a01100 806d687d nt!KiInterruptDispatch+0×3d

f7a01194 804f9487 hal!HalEnableSystemInterrupt+0×79

f7a011d8 8056aac4 nt!KeConnectInterrupt+0×95

f7a011fc f74c987c nt!IoConnectInterrupt+0xf2

f7a0123c f74d13f0 ACPI!OSInterruptVector+0×76

f7a01250 f74b5781 ACPI!ACPIInitialize+0×154

f7a01284 f74cf824 ACPI!ACPIInitStartACPI+0×71

f7a012b0 f74b1e12 ACPI!ACPIRootIrpStartDevice+0xc0

f7a012e0 804ee129 ACPI!ACPIDispatchIrp+0×15a

f7a012f0 8058803b nt!IopfCallDriver+0×31

f7a0131c 805880b9 nt!IopSynchronousCall+0xb7

f7a01360 804f515c nt!IopStartDevice+0×4d

f7a0137c 80587769 nt!PipProcessStartPhase1+0×4e

f7a015d4 804f5823 nt!PipProcessDevNodeTree+0×1db

f7a01618 804f5ab3 nt!PipDeviceActionWorker+0xa3

f7a01630 8068afc6 nt!PipRequestDeviceAction+0×107

f7a01694 80687e48 nt!IopInitializeBootDrivers+0×376

f7a0183c 806862dd nt!IoInitSystem+0×712

f7a01dac 805c61e0 nt!Phase1Initialization+0×9b5

f7a01ddc 80541e02 nt!PspSystemThreadStartup+0×34

00000000 00000000 nt!KiThreadStartup+0×16
kd> r

eax=00000000 ebx=00000000 ecx=00000002 edx=0000100c esi=00000000 edi=867d8008

eip=806d664b esp=f7a010c0 ebp=f7a010c8 iopl=1         nv up ei pl zr na pe nc

cs=0008  ss=0010  ds=0023  es=0023  fs=0030  gs=0000             efl=00001246

hal!READ_PORT_UCHAR+0x7:

806d664b c20400          ret     4
kd> ub eip

hal!KdRestore+0x9:

806d663f cc              int     3

806d6640 cc              int     3

806d6641 cc              int     3

806d6642 cc              int     3

806d6643 cc              int     3

hal!READ_PORT_UCHAR:

806d6644 33c0            xor     eax,eax

806d6646 8b542404        mov     edx,dword ptr [esp+4]

806d664a ec              in      al,dx
kd> version

[...]

System Uptime: 0 days 0:03:42.140

[...]
kd> !thread

THREAD 867c63e8  Cid 0004.0008  Teb: 00000000 Win32Thread: 00000000 RUNNING on processor 0

IRP List:

    867df008: (0006,0190) Flags: 00000000  Mdl: 00000000

Not impersonating

DeviceMap                 e1005460

Owning Process            0       Image:         <Unknown>

Attached Process          867c6660       Image:         System

Wait Start TickCount      39             Ticks: 1839 (0:00:00:18.416)

Context Switch Count      4

UserTime                  00:00:00.000

KernelTime                00:00:00.911

Start Address nt!Phase1Initialization (0x80685928)

Stack Init f7a02000 Current f7a014a4 Base f7a02000 Limit f79ff000 Call 0

Priority 31 BasePriority 8 PriorityDecrement 0 DecrementCount 0

[...]
- Dmitry Vostokov @ DumpAnalysis.org + TraceAnalysis.org -
Today we introduce an icon for IRP Distribution Anomaly pattern:
B/W
![]()
Color
![]()
- Dmitry Vostokov @ DumpAnalysis.org + TraceAnalysis.org -
Here we model Message Hooks pattern using MessageHistory tool. It uses window message hooking mechanism to intercept window messages. Download the tool and run either MessageHistory.exe or MessageHistory64.exe and push its Start button. Whenever any process becomes active after that either mhhooks.dll or mhhooks64.dll gets injected into the process virtual address space. Then we run WinDbg x86 or WinDbg x64, run notepad.exe and attach the debugger noninvasively to it:
*** wait with pending attach

Symbol search path is: srv*

Executable search path is:

WARNING: Process 2932 is not attached as a debuggee

         The process can be examined but debug events will not be received

(b74.f44): Wake debugger - code 80000007 (first chance)

USER32!NtUserGetMessage+0xa:

00000000`76f9c92a c3              ret
0:000> .symfix
0:000> .reload
0:000> k

Child-SP          RetAddr           Call Site

00000000`0028f908 00000000`76f9c95e USER32!NtUserGetMessage+0xa

00000000`0028f910 00000000`ff511064 USER32!GetMessageW+0x34

00000000`0028f940 00000000`ff51133c notepad!WinMain+0x182

00000000`0028f9c0 00000000`76e7f56d notepad!DisplayNonGenuineDlgWorker+0x2da

00000000`0028fa80 00000000`770b3281 kernel32!BaseThreadInitThunk+0xd

00000000`0028fab0 00000000`00000000 ntdll!RtlUserThreadStart+0x1d
If we don’t select “Noninvasive” in “Attach to Process” dialog box we need to switch from the debugger injected thread to our main notepad application thread:
0:001> .symfix
0:001> .reload
0:001> k

Child-SP          RetAddr           Call Site

00000000`024bfe18 00000000`77178638 ntdll!DbgBreakPoint

00000000`024bfe20 00000000`76e7f56d ntdll!DbgUiRemoteBreakin+0x38

00000000`024bfe50 00000000`770b3281 kernel32!BaseThreadInitThunk+0xd

00000000`024bfe80 00000000`00000000 ntdll!RtlUserThreadStart+0x1d
0:001> ~0s

USER32!NtUserGetMessage+0xa:

00000000`76f9c92a c3              ret
0:000> k

Child-SP          RetAddr           Call Site

00000000`000af9e8 00000000`76f9c95e USER32!NtUserGetMessage+0xa

00000000`000af9f0 00000000`ff511064 USER32!GetMessageW+0x34

00000000`000afa20 00000000`ff51133c notepad!WinMain+0x182

00000000`000afaa0 00000000`76e7f56d notepad!DisplayNonGenuineDlgWorker+0x2da

00000000`000afb60 00000000`770b3281 kernel32!BaseThreadInitThunk+0xd

00000000`000afb90 00000000`00000000 ntdll!RtlUserThreadStart+0x1d
We then inspect the raw stack data to see any execution residue and find a few related function calls:
0:000> !teb

TEB at 000007fffffdd000

    ExceptionList:        0000000000000000

    StackBase:            0000000000290000

    StackLimit:           000000000027f000

    SubSystemTib:         0000000000000000

    FiberData:            0000000000001e00

    ArbitraryUserPointer: 0000000000000000

    Self:                 000007fffffdd000

    EnvironmentPointer:   0000000000000000

    ClientId:             0000000000000b74 . 0000000000000f44

    RpcHandle:            0000000000000000

    Tls Storage:          000007fffffdd058

    PEB Address:          000007fffffdf000

    LastErrorValue:       0

    LastStatusValue:      c0000034

    Count Owned Locks:    0

    HardErrorMode:        0
0:000> dps 000000000027f000 0000000000290000

[...]

00000000`0028e388  00000000`008bd8e0

00000000`0028e390  00000000`00000000

00000000`0028e398  00000000`00000001

00000000`0028e3a0  00000000`00000282

00000000`0028e3a8  00000000`76f966b2 USER32!SendMessageToUI+0x6a

00000000`0028e3b0  00000000`001406b0

00000000`0028e3b8  00000000`004000f8

00000000`0028e3c0  00000000`00000001

00000000`0028e3c8  00000001`800014b8 mhhooks64!CallWndProc+0×2d8

00000000`0028e3d0  00000000`00000000

00000000`0028e3d8  00000000`002f0664

00000000`0028e3e0  00000000`00000001

00000000`0028e3e8  00000000`76f96a72 USER32!ImeNotifyHandler+0xb4

00000000`0028e3f0  00000000`00000000

00000000`0028e3f8  00000000`004000f8

00000000`0028e400  00000000`00000001

00000000`0028e408  000007fe`ff1213b4 IMM32!CtfImmDispatchDefImeMessage+0×60

00000000`0028e410  00000000`00000000

00000000`0028e418  00000000`002f0664

00000000`0028e420  00000000`00000000

00000000`0028e428  00000000`002f0664

00000000`0028e430  00000000`008bd8e0

00000000`0028e438  00000000`76f96a06 USER32!ImeWndProcWorker+0×3af

00000000`0028e440  00000000`00000282

00000000`0028e448  00000000`00000000

00000000`0028e450  00000000`00000001

00000000`0028e458  00000000`004000f8

00000000`0028e460  00000000`00000000

00000000`0028e468  00000000`00000001

00000000`0028e470  00000000`00000000

00000000`0028e478  00000000`00000000

00000000`0028e480  00000000`00000000

00000000`0028e488  00000000`76f9a078 USER32!_fnDWORD+0×44

00000000`0028e490  00000000`00000000

[…]

00000000`0028f770  00000000`001406b0

00000000`0028f778  000007ff`fffdd000

00000000`0028f780  00000000`0028f8c8

00000000`0028f788  00000000`008bd8e0

00000000`0028f790  00000000`00000018

00000000`0028f798  00000000`76f885a0 USER32!DispatchHookW+0×2c

00000000`0028f7a0  000022b2`00000000

00000000`0028f7a8  00000000`00000001

00000000`0028f7b0  000007fe`ff2d2560 MSCTF!IMCLock::`vftable’

00000000`0028f7b8  00000000`00407c50

00000000`0028f7c0  00000000`000c0e51

00000000`0028f7c8  00000000`00000000

00000000`0028f7d0  00000000`00000000

00000000`0028f7d8  00000000`00000113

00000000`0028f7e0  00000000`00000113

00000000`0028f7e8  00000000`00000001

00000000`0028f7f0  00000000`00000000

00000000`0028f7f8  00000000`76f9c3df USER32!UserCallWinProcCheckWow+0×1cb

00000000`0028f800  00000000`ff510000 notepad!CFileDialogEvents_QueryInterface <PERF> (notepad+0×0)

00000000`0028f808  00000000`00000000

00000000`0028f810  00000000`00000000

00000000`0028f818  00000000`00000000

00000000`0028f820  00000000`00000000

00000000`0028f828  00000000`00000038

00000000`0028f830  00000000`00000000

00000000`0028f838  00000000`00000000

00000000`0028f840  00000000`00000000

00000000`0028f848  00000000`770cfdf5 ntdll!KiUserCallbackDispatcherContinue

00000000`0028f850  00000000`00000048

00000000`0028f858  00000000`00000001

00000000`0028f860  00000000`00000000

[…]
We also see a 3rd-party module in proximity having “hook” in its module name: mhhooks64. We disassemble its address to see yet another message hooking evidence:
0:000> .asm no_code_bytes

Assembly options: no_code_bytes
0:000> ub 00000001`800014b8

mhhooks64!CallWndProc+0×2ae:

00000001`8000148e imul    rcx,rcx,30h

00000001`80001492 lea     rdx,[mhhooks64!sendMessages (00000001`80021030)]

00000001`80001499 mov     dword ptr [rdx+rcx+28h],eax

00000001`8000149d mov     r9,qword ptr [rsp+50h]

00000001`800014a2 mov     r8,qword ptr [rsp+48h]

00000001`800014a7 mov     edx,dword ptr [rsp+40h]

00000001`800014ab mov     rcx,qword ptr [mhhooks64!hCallWndHook (00000001`80021028)]

00000001`800014b2 call    qword ptr [mhhooks64!_imp_CallNextHookEx (00000001`80017280)]
- Dmitry Vostokov @ DumpAnalysis.org + TraceAnalysis.org -
Our future sponsor has been registered in Ireland and has its own independent website and logo: DumpAnalysis.com

More information will be available later this month.
- Dmitry Vostokov @ DumpAnalysis.org + TraceAnalysis.org -
Today we introduce an icon for Historical Information pattern:
B/W
![]()
Color
![]()
The icon motivated the following debugging slang: BCE
- Dmitry Vostokov @ DumpAnalysis.org + TraceAnalysis.org -
BCE - Before Crash Era. BC - Before Crash. Analog of Before Common Era. CE - Crash Era. Analog of Common Era.
Examples: I see BCE traces on the raw stack.
Note: See how it is related to the history of our Universe: EPOCH
- Dmitry Vostokov @ DumpAnalysis.org + TraceAnalysis.org -