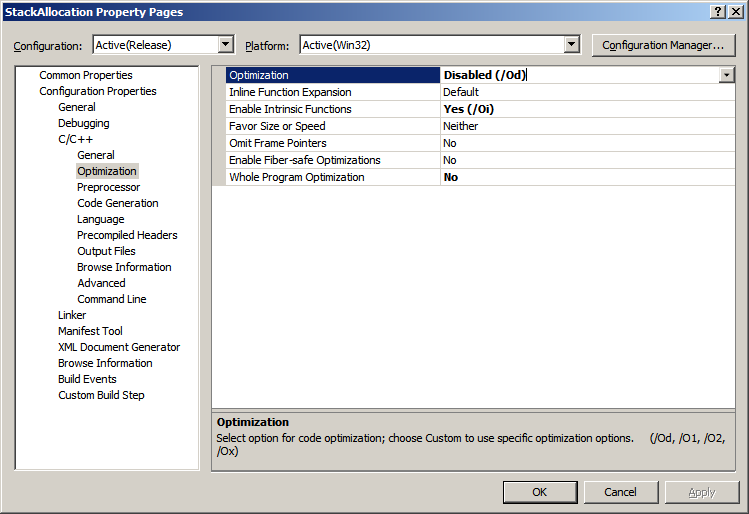
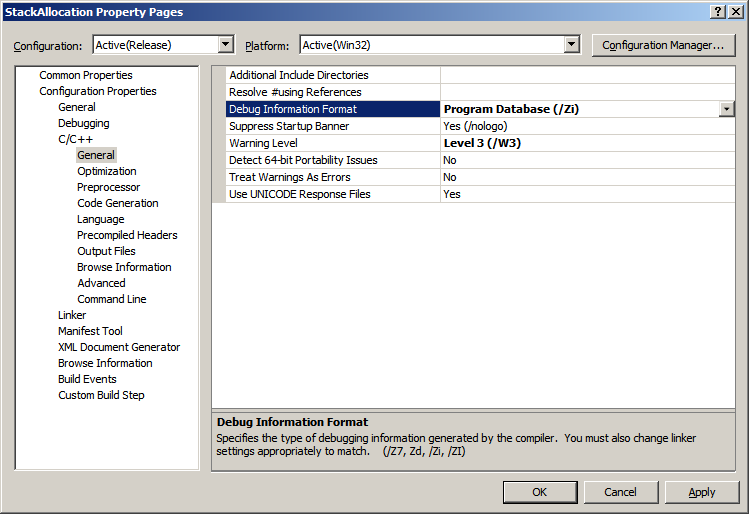
Having discussed dereference fixpoints we come back to the quiz code and see what happens when we execute it after compilation as default Debug target with Debug Information Format set to Program Database to avoid extra stack space allocation:
int _tmain(int argc, _TCHAR* argv[])

{

   char c;

   char* pc = &c;

   while(1)

   {

     *pc = 0;

     pc++;

   }
   return 0;

}
Expecting crashes I created the following key HKEY_LOCAL_MACHINE \ SOFTWARE \ Microsoft \ Windows \ Windows Error Reporting \ LocalDumps with the following values: DumpFolder (REG_EXPAND_SZ) and DumpType (2, Full).
When running the compiled program I noticed that it crashed according to my expectations. The saved dump StackErasure.exe.2096.dmp confirmed that the crash was due to the stack underflow when it hit the base address:
0:000> r

eax=002c0000 ebx=7efde000 ecx=00000001 edx=002c0000 esi=00000000 edi=00000000

eip=00e11039 esp=002bf7c4 ebp=002bf7d4 iopl=0         nv up ei pl nz na po nc

cs=0023  ss=002b  ds=002b  es=002b  fs=0053  gs=002b             efl=00010202

StackErasure!wmain+0x29:

00e11039 c60200          mov     byte ptr [edx],0           ds:002b:002c0000=??
0:000> !teb

TEB at 7efdd000

    ExceptionList:        002bf810

    StackBase:            002c0000

    StackLimit:           002be000

    SubSystemTib:         00000000

    FiberData:            00001e00

    ArbitraryUserPointer: 00000000

    Self:                 7efdd000

    EnvironmentPointer:   00000000

    ClientId:             00000830 . 00000a78

    RpcHandle:            00000000

    Tls Storage:          7efdd02c

    PEB Address:          7efde000

    LastErrorValue:       0

    LastStatusValue:      0

    Count Owned Locks:    0

    HardErrorMode:        0
The loop from source code is highlighted in blue:
0:000> uf wmain

StackErasure!wmain:

00e11010 push    ebp

00e11011 mov     ebp,esp

00e11013 sub     esp,10h

00e11016 mov     eax,0CCCCCCCCh

00e1101b mov     dword ptr [ebp-10h],eax

00e1101e mov     dword ptr [ebp-0Ch],eax

00e11021 mov     dword ptr [ebp-8],eax

00e11024 mov     dword ptr [ebp-4],eax

00e11027 lea     eax,[ebp-5]

00e1102a mov     dword ptr [ebp-10h],eax
StackErasure!wmain+0x1d:

00e1102d mov     ecx,1

00e11032 test    ecx,ecx

00e11034 je      StackErasure!wmain+0x37 (00e11047)
StackErasure!wmain+0x26:

00e11036 mov     edx,dword ptr [ebp-10h]

00e11039 mov     byte ptr [edx],0

00e1103c mov     eax,dword ptr [ebp-10h]

00e1103f add     eax,1

00e11042 mov     dword ptr [ebp-10h],eax

00e11045 jmp     StackErasure!wmain+0x1d (00e1102d)
StackErasure!wmain+0x37:

00e11047 xor     eax,eax

00e11049 push    edx

00e1104a mov     ecx,ebp

00e1104c push    eax

00e1104d lea     edx,[StackErasure!wmainCRTStartup+0x10 (00e11060)]

00e11053 call    StackErasure!__tmainCRTStartup+0x50 (00e110c0)

00e11058 pop     eax

00e11059 pop     edx

00e1105a mov     esp,ebp

00e1105c pop     ebp

00e1105d ret
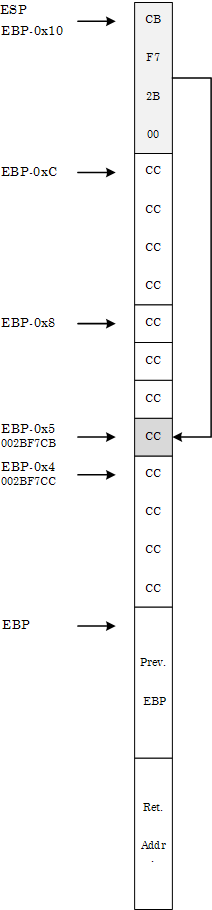
We see that our char variable ‘c’ is located at EBP-5 and the pointer ‘pc’ is located at EBP-10 (in another words ‘c’ follows ‘pc’ in memory):
00e11027 lea     eax,[ebp-5]

00e1102a mov     dword ptr [ebp-10h],eax
Both locations were initialized to 0xCCCCCCCC:
00e11016 mov     eax,0CCCCCCCCh

00e1101b mov     dword ptr [ebp-10h],eax

00e1101e mov     dword ptr [ebp-0Ch],eax

00e11021 mov     dword ptr [ebp-8],eax  ; this ends with EBP-5

00e11024 mov     dword ptr [ebp-4],eax
The memory layout before the start of the loop is depicted on the following diagram in the style of Windows Debugging: Practical Foundations book:
At the crash point we have the following final memory layout:
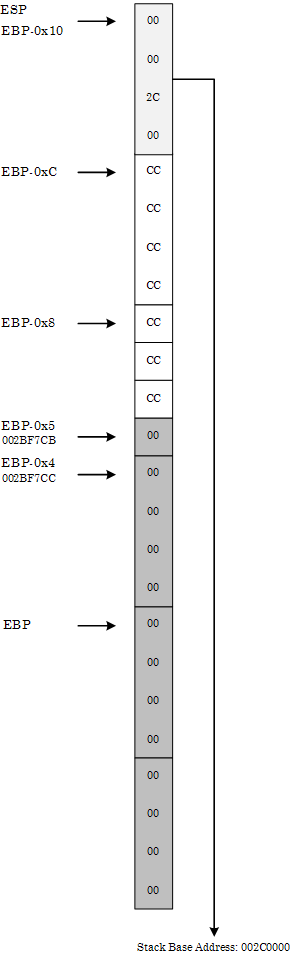
We can see it from the raw stack:
0:000> db esp

002bf7c4  00 00 2c 00 cc cc cc cc-cc cc cc 00 00 00 00 00

002bf7d4  00 00 00 00 00 00 00 00-00 00 00 00 00 00 00 00

002bf7e4  00 00 00 00 00 00 00 00-00 00 00 00 00 00 00 00

002bf7f4  00 00 00 00 00 00 00 00-00 00 00 00 00 00 00 00

002bf804  00 00 00 00 00 00 00 00-00 00 00 00 00 00 00 00

002bf814  00 00 00 00 00 00 00 00-00 00 00 00 00 00 00 00

002bf824  00 00 00 00 00 00 00 00-00 00 00 00 00 00 00 00

002bf834  00 00 00 00 00 00 00 00-00 00 00 00 00 00 00 00
or in pointer-sized (double word) values where we can see little endian effects (compare 00 00 2c 00 with 002c0000):
0:000> dp esp

002bf7c4  002c0000 cccccccc 00cccccc 00000000

002bf7d4  00000000 00000000 00000000 00000000

002bf7e4  00000000 00000000 00000000 00000000

002bf7f4  00000000 00000000 00000000 00000000

002bf804  00000000 00000000 00000000 00000000

002bf814  00000000 00000000 00000000 00000000

002bf824  00000000 00000000 00000000 00000000

002bf834  00000000 00000000 00000000 00000000
The loop code erases stack starting from EBP-5 until it hits the base address.
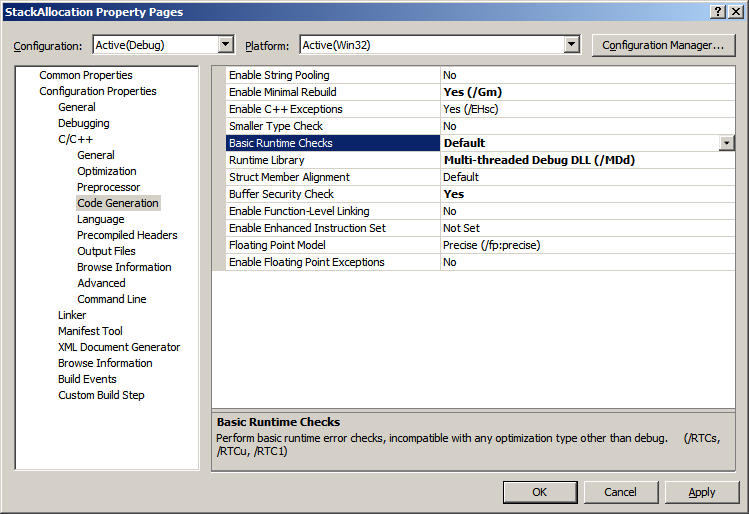
Now we change Basic Runtime Checks in Code Generation properties to Default, recompile and launch the project. Suddenly it no longer crashes but loops infinitely (shown in blue):
0:000> bp wmain
0:000> g

[...]
0:000> uf wmain

StackErasure!wmain:

00d01010 push    ebp

00d01011 mov     ebp,esp

00d01013 sub     esp,8

00d01016 lea     eax,[ebp-5]

00d01019 mov     dword ptr [ebp-4],eax
StackErasure!wmain+0xc:

00d0101c mov     ecx,1

00d01021 test    ecx,ecx

00d01023 je      StackErasure!wmain+0x26 (00d01036)
StackErasure!wmain+0x15:

00d01025 mov     edx,dword ptr [ebp-4]

00d01028 mov     byte ptr [edx],0

00d0102b mov     eax,dword ptr [ebp-4]

00d0102e add     eax,1

00d01031 mov     dword ptr [ebp-4],eax

00d01034 jmp     StackErasure!wmain+0xc (00d0101c)
StackErasure!wmain+0x26:

00d01036 xor     eax,eax

00d01038 mov     esp,ebp

00d0103a pop     ebp

00d0103b ret
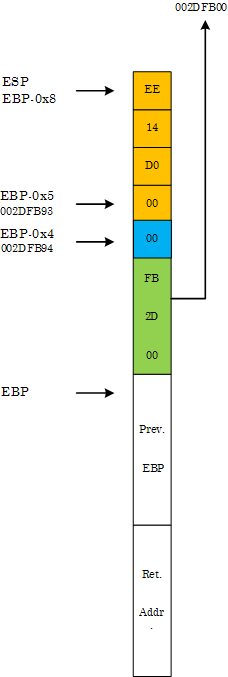
At first it looks strange but if we look at the stack memory layout we would see that ‘pc’ pointer follows ‘c’ (the opposite to the memory layout discussed above):
00d01016 lea     eax,[ebp-5]

00d01019 mov     dword ptr [ebp-4],eax
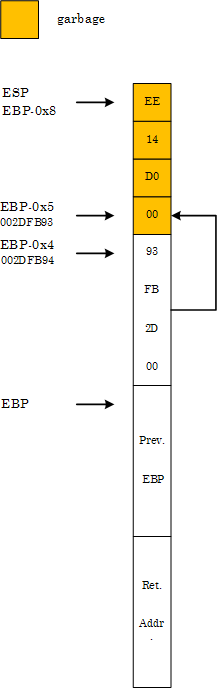
0:000> dp esp

002dfb90 00d014ee 002dfb93 002dfbe4 00d01186

002dfba0 00000001 00081d70 00081df8 5a16a657

002dfbb0 00000000 00000000 7ffdb000 00000000

002dfbc0 00000000 00000000 00000000 002dfbac

002dfbd0 000001bb 002dfc28 00d06e00 5aed06eb

002dfbe0 00000000 002dfbec 00d0105f 002dfbf8

002dfbf0 77844911 7ffdb000 002dfc38 7791e4b6

002dfc00 7ffdb000 705b3701 00000000 00000000
Therefore, when the pointer at EBP-4 is incremented by 1 during the first loop iteration it becomes a dereference fixpoint:
0:000> bp 00d0101c
0:000> g

Breakpoint 1 hit

eax=002dfb93 ebx=7ffdb000 ecx=00000001 edx=00081df8 esi=00000000 edi=00000000

eip=00d0101c esp=002dfb90 ebp=002dfb98 iopl=0         nv up ei pl nz na pe nc

cs=001b  ss=0023  ds=0023  es=0023  fs=003b  gs=0000             efl=00000206

StackErasure!wmain+0xc:

00d0101c b901000000      mov     ecx,1
0:000> t

eax=002dfb93 ebx=7ffdb000 ecx=00000001 edx=00081df8 esi=00000000 edi=00000000

eip=00d01021 esp=002dfb90 ebp=002dfb98 iopl=0         nv up ei pl nz na pe nc

cs=001b  ss=0023  ds=0023  es=0023  fs=003b  gs=0000             efl=00000206

StackErasure!wmain+0x11:

00d01021 85c9            test    ecx,ecx
0:000> t

eax=002dfb93 ebx=7ffdb000 ecx=00000001 edx=00081df8 esi=00000000 edi=00000000

eip=00d01023 esp=002dfb90 ebp=002dfb98 iopl=0         nv up ei pl nz na po nc

cs=001b  ss=0023  ds=0023  es=0023  fs=003b  gs=0000             efl=00000202

StackErasure!wmain+0x13:

00d01023 7411            je      StackErasure!wmain+0x26 (00d01036)      [br=0]
0:000> t

eax=002dfb93 ebx=7ffdb000 ecx=00000001 edx=00081df8 esi=00000000 edi=00000000

eip=00d01025 esp=002dfb90 ebp=002dfb98 iopl=0         nv up ei pl nz na po nc

cs=001b  ss=0023  ds=0023  es=0023  fs=003b  gs=0000             efl=00000202

StackErasure!wmain+0x15:

00d01025 8b55fc          mov     edx,dword ptr [ebp-4] ss:0023:002dfb94=002dfb93
0:000> t

eax=002dfb93 ebx=7ffdb000 ecx=00000001 edx=002dfb93 esi=00000000 edi=00000000

eip=00d01028 esp=002dfb90 ebp=002dfb98 iopl=0         nv up ei pl nz na po nc

cs=001b  ss=0023  ds=0023  es=0023  fs=003b  gs=0000             efl=00000202

StackErasure!wmain+0x18:

00d01028 c60200          mov     byte ptr [edx],0           ds:0023:002dfb93=00
0:000> t

eax=002dfb93 ebx=7ffdb000 ecx=00000001 edx=002dfb93 esi=00000000 edi=00000000

eip=00d0102b esp=002dfb90 ebp=002dfb98 iopl=0         nv up ei pl nz na po nc

cs=001b  ss=0023  ds=0023  es=0023  fs=003b  gs=0000             efl=00000202

StackErasure!wmain+0x1b:

00d0102b 8b45fc          mov     eax,dword ptr [ebp-4] ss:0023:002dfb94=002dfb93
0:000> t

eax=002dfb93 ebx=7ffdb000 ecx=00000001 edx=002dfb93 esi=00000000 edi=00000000

eip=00d0102e esp=002dfb90 ebp=002dfb98 iopl=0         nv up ei pl nz na po nc

cs=001b  ss=0023  ds=0023  es=0023  fs=003b  gs=0000             efl=00000202

StackErasure!wmain+0x1e:

00d0102e 83c001          add     eax,1
0:000> t

eax=002dfb94 ebx=7ffdb000 ecx=00000001 edx=002dfb93 esi=00000000 edi=00000000

eip=00d01031 esp=002dfb90 ebp=002dfb98 iopl=0         nv up ei pl nz na po nc

cs=001b  ss=0023  ds=0023  es=0023  fs=003b  gs=0000             efl=00000202

StackErasure!wmain+0x21:

00d01031 8945fc          mov     dword ptr [ebp-4],eax ss:0023:002dfb94=002dfb93
0:000> t

eax=002dfb94 ebx=7ffdb000 ecx=00000001 edx=002dfb93 esi=00000000 edi=00000000

eip=00d01034 esp=002dfb90 ebp=002dfb98 iopl=0         nv up ei pl nz na po nc

cs=001b  ss=0023  ds=0023  es=0023  fs=003b  gs=0000             efl=00000202

StackErasure!wmain+0x24:

00d01034 ebe6            jmp     StackErasure!wmain+0xc (00d0101c)
0:000> dp ebp-4 l1

002dfb94  002dfb94
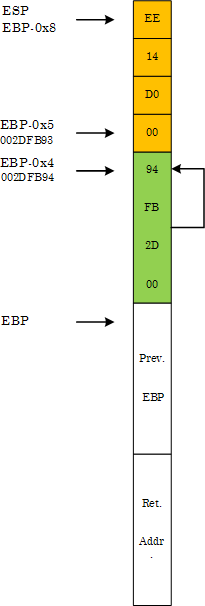
During the second iteration the assignment of zero to ‘*pc’ clears the first byte of ‘pc’:
0:000> t

Breakpoint 1 hit

eax=002dfb94 ebx=7ffdb000 ecx=00000001 edx=002dfb93 esi=00000000 edi=00000000

eip=00d0101c esp=002dfb90 ebp=002dfb98 iopl=0         nv up ei pl nz na po nc

cs=001b  ss=0023  ds=0023  es=0023  fs=003b  gs=0000             efl=00000202

StackErasure!wmain+0xc:

00d0101c b901000000      mov     ecx,1
0:000> t

eax=002dfb94 ebx=7ffdb000 ecx=00000001 edx=002dfb93 esi=00000000 edi=00000000

eip=00d01021 esp=002dfb90 ebp=002dfb98 iopl=0         nv up ei pl nz na po nc

cs=001b  ss=0023  ds=0023  es=0023  fs=003b  gs=0000             efl=00000202

StackErasure!wmain+0x11:

00d01021 85c9            test    ecx,ecx
0:000> t

eax=002dfb94 ebx=7ffdb000 ecx=00000001 edx=002dfb93 esi=00000000 edi=00000000

eip=00d01023 esp=002dfb90 ebp=002dfb98 iopl=0         nv up ei pl nz na po nc

cs=001b  ss=0023  ds=0023  es=0023  fs=003b  gs=0000             efl=00000202

StackErasure!wmain+0x13:

00d01023 7411            je      StackErasure!wmain+0x26 (00d01036)      [br=0]
0:000> t

eax=002dfb94 ebx=7ffdb000 ecx=00000001 edx=002dfb93 esi=00000000 edi=00000000

eip=00d01025 esp=002dfb90 ebp=002dfb98 iopl=0         nv up ei pl nz na po nc

cs=001b  ss=0023  ds=0023  es=0023  fs=003b  gs=0000             efl=00000202

StackErasure!wmain+0x15:

00d01025 8b55fc          mov     edx,dword ptr [ebp-4] ss:0023:002dfb94=002dfb94
0:000> t

eax=002dfb94 ebx=7ffdb000 ecx=00000001 edx=002dfb94 esi=00000000 edi=00000000

eip=00d01028 esp=002dfb90 ebp=002dfb98 iopl=0         nv up ei pl nz na po nc

cs=001b  ss=0023  ds=0023  es=0023  fs=003b  gs=0000             efl=00000202

StackErasure!wmain+0x18:

00d01028 c60200          mov     byte ptr [edx],0           ds:0023:002dfb94=94
0:000> t

eax=002dfb94 ebx=7ffdb000 ecx=00000001 edx=002dfb94 esi=00000000 edi=00000000

eip=00d0102b esp=002dfb90 ebp=002dfb98 iopl=0         nv up ei pl nz na po nc

cs=001b  ss=0023  ds=0023  es=0023  fs=003b  gs=0000             efl=00000202

StackErasure!wmain+0x1b:

00d0102b 8b45fc          mov     eax,dword ptr [ebp-4] ss:0023:002dfb94=002dfb00
0:000> dp esp

002dfb90  00d014ee 002dfb00 002dfbe4 00d01186

002dfba0  00000001 00081d70 00081df8 5a16a657

002dfbb0  00000000 00000000 7ffdb000 00000000

002dfbc0  00000000 00000000 00000000 002dfbac

002dfbd0  000001bb 002dfc28 00d06e00 5aed06eb

002dfbe0  00000000 002dfbec 00d0105f 002dfbf8

002dfbf0  77844911 7ffdb000 002dfc38 7791e4b6

002dfc00  7ffdb000 705b3701 00000000 00000000
The new ‘pc’ pointer points to the following region of the stack:
0:000> dp 002dfb00 l100/4

002dfb00  002dfb0c 00000004 00000000 5c008ede

002dfb10  002dfb28 00d0634a 0008128c 5aed018b

002dfb20  000807f8 7790fb66 00000000 7ffdb000

002dfb30  00000000 002dfb40 00d089a6 00d68ab8

002dfb40  002dfb4c 00d019bc 00000008 002dfb84

002dfb50  00d07520 00d07519 5a16a637 00000000

002dfb60  00000000 7ffdb000 00d02b10 00000004

002dfb70  00000002 002dfbd4 00d06e00 5aed007b

002dfb80  fffffffe 002dfb90 00d0769e 002dfba0

002dfb90  00d014ee 002dfb00 002dfbe4 00d01186

002dfba0  00000001 00081d70 00081df8 5a16a657

002dfbb0  00000000 00000000 7ffdb000 00000000

002dfbc0  00000000 00000000 00000000 002dfbac

002dfbd0  000001bb 002dfc28 00d06e00 5aed06eb

002dfbe0  00000000 002dfbec 00d0105f 002dfbf8

002dfbf0  77844911 7ffdb000 002dfc38 7791e4b6
The loop code now starts clearing this region until the pointer becomes the fixpoint again after successive increments and therefore continues to loop indefinitely:
0:000> bc 0 1
0:000> g

(1238.c9c): Break instruction exception - code 80000003 (first chance)

eax=7ffde000 ebx=00000000 ecx=00000000 edx=7796d094 esi=00000000 edi=00000000

eip=77927dfe esp=00a4ff30 ebp=00a4ff5c iopl=0         nv up ei pl zr na pe nc

cs=001b  ss=0023  ds=0023  es=0023  fs=003b  gs=0000             efl=00000246

ntdll!DbgBreakPoint:

77927dfe cc              int     3
0:001> dp 002dfb00 l100/4

002dfb00  0000000c 00000000 00000000 00000000

002dfb10  00000000 00000000 00000000 00000000

002dfb20  00000000 00000000 00000000 00000000

002dfb30  00000000 00000000 00000000 00000000

002dfb40  00000000 00000000 00000000 00000000

002dfb50  00000000 00000000 00000000 00000000

002dfb60  00000000 00000000 00000000 00000000

002dfb70  00000000 00000000 00000000 00000000

002dfb80  00000000 00000000 00000000 00000000

002dfb90  00000000 002dfb1f 002dfbe4 00d01186

002dfba0  00000001 00081d70 00081df8 5a16a657

002dfbb0  00000000 00000000 7ffdb000 00000000

002dfbc0  00000000 00000000 00000000 002dfbac

002dfbd0  000001bb 002dfc28 00d06e00 5aed06eb

002dfbe0  00000000 002dfbec 00d0105f 002dfbf8

002dfbf0  77844911 7ffdb000 002dfc38 7791e4b6
StackErasure that loops indefinitely is available for download.
- Dmitry Vostokov @ DumpAnalysis.org -