MDAA Volume 2: Table of Contents
Wednesday, October 1st, 2008The book is nearly finished and here is the final TOC:
Memory Dump Analysis Anthology, Volume 2: Table of Contents
- Dmitry Vostokov @ DumpAnalysis.org -
The book is nearly finished and here is the final TOC:
Memory Dump Analysis Anthology, Volume 2: Table of Contents
- Dmitry Vostokov @ DumpAnalysis.org -
Opcodes “- so innocent and powerless as they are, as standing in a” manual “, how potent for good and evil they become in the hands of one who knows how to combine them.”
Nathaniel Hawthorne, American Notebooks
- Dmitry Vostokov @ DumpAnalysis.org -
Instead of providing the list of recommended books on debugging topics here is the picture that shows most of them that I own:
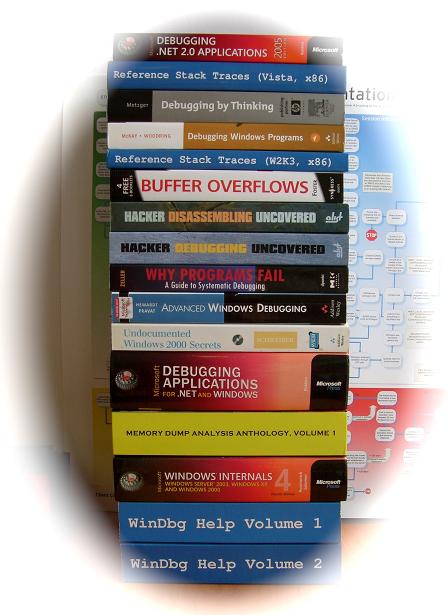
Hope you recognize books that you own and/or read too. Some of them were reviewed by me already:
Debugging by Thinking: A Multidisciplinary Approach
Microsoft Windows Internals: Microsoft Windows Server 2003, Windows XP, and Windows 2000
Why Programs Fail: A Guide to Systematic Debugging
and more reviews will come soon.
- Dmitry Vostokov @ DumpAnalysis.org -
I discovered today that great IDA book was published last month:
The IDA Pro Book: The Unofficial Guide to the World’s Most Popular Disassembler

Curious about this published book I did some digging and finally ordered it because in the past I was always interested in knowing more about IDA after reading about it in some reverse engineering and disassembly books (more about them later) but was somewhat dissatisfied with IDA freeware version 4.3. The last argument in buying the book was my discovery that the new freeware version is available 4.9 which looks much better:
http://www.hex-rays.com/idapro/idadownfreeware.htm
I’ll keep investigating it for the purposes of memory dump analysis.
- Dmitry Vostokov @ DumpAnalysis.org -
Many people expressed interest in expanding Practical Foundations of Debugging (x64) and merging it with commented version of Practical Foundations of Debugging (x86) and Reading Windows-based Code. I therefore decided to dedicate some time during the next two months for this task and publish a book. Its main purpose is to help technical support and escalation engineers, testers and software developers without the knowledge of assembly language and C to master all necessary prerequisites to understand and start debugging and crash dump analysis on Windows platforms. It doesn’t require any specific knowledge, fills the gap and lowers the learning curve required for Advanced Windows Debugging and for my own books. It will also serve as a hardware complement to my seminars that I give from time to time. More details will be posted later but for now there are preliminary product details:
- Dmitry Vostokov @ DumpAnalysis.org -
Due to the request from blog readers I made my old Practical Foundations of Debugging lectures available in PDF format:
x64 version:
I keep both versions (HTMP and PDF) on the following pages where updates or corrections will be posted in the future:
Practical Foundations of Debugging (x86)
Practical Foundations of Debugging (x64)
- Dmitry Vostokov @ DumpAnalysis.org -
A. Both have online versions of processor manuals. But Intel also ships them in paper format for free (the paper is worse in the latest revision than 2 years ago but books are a bit lighter now):
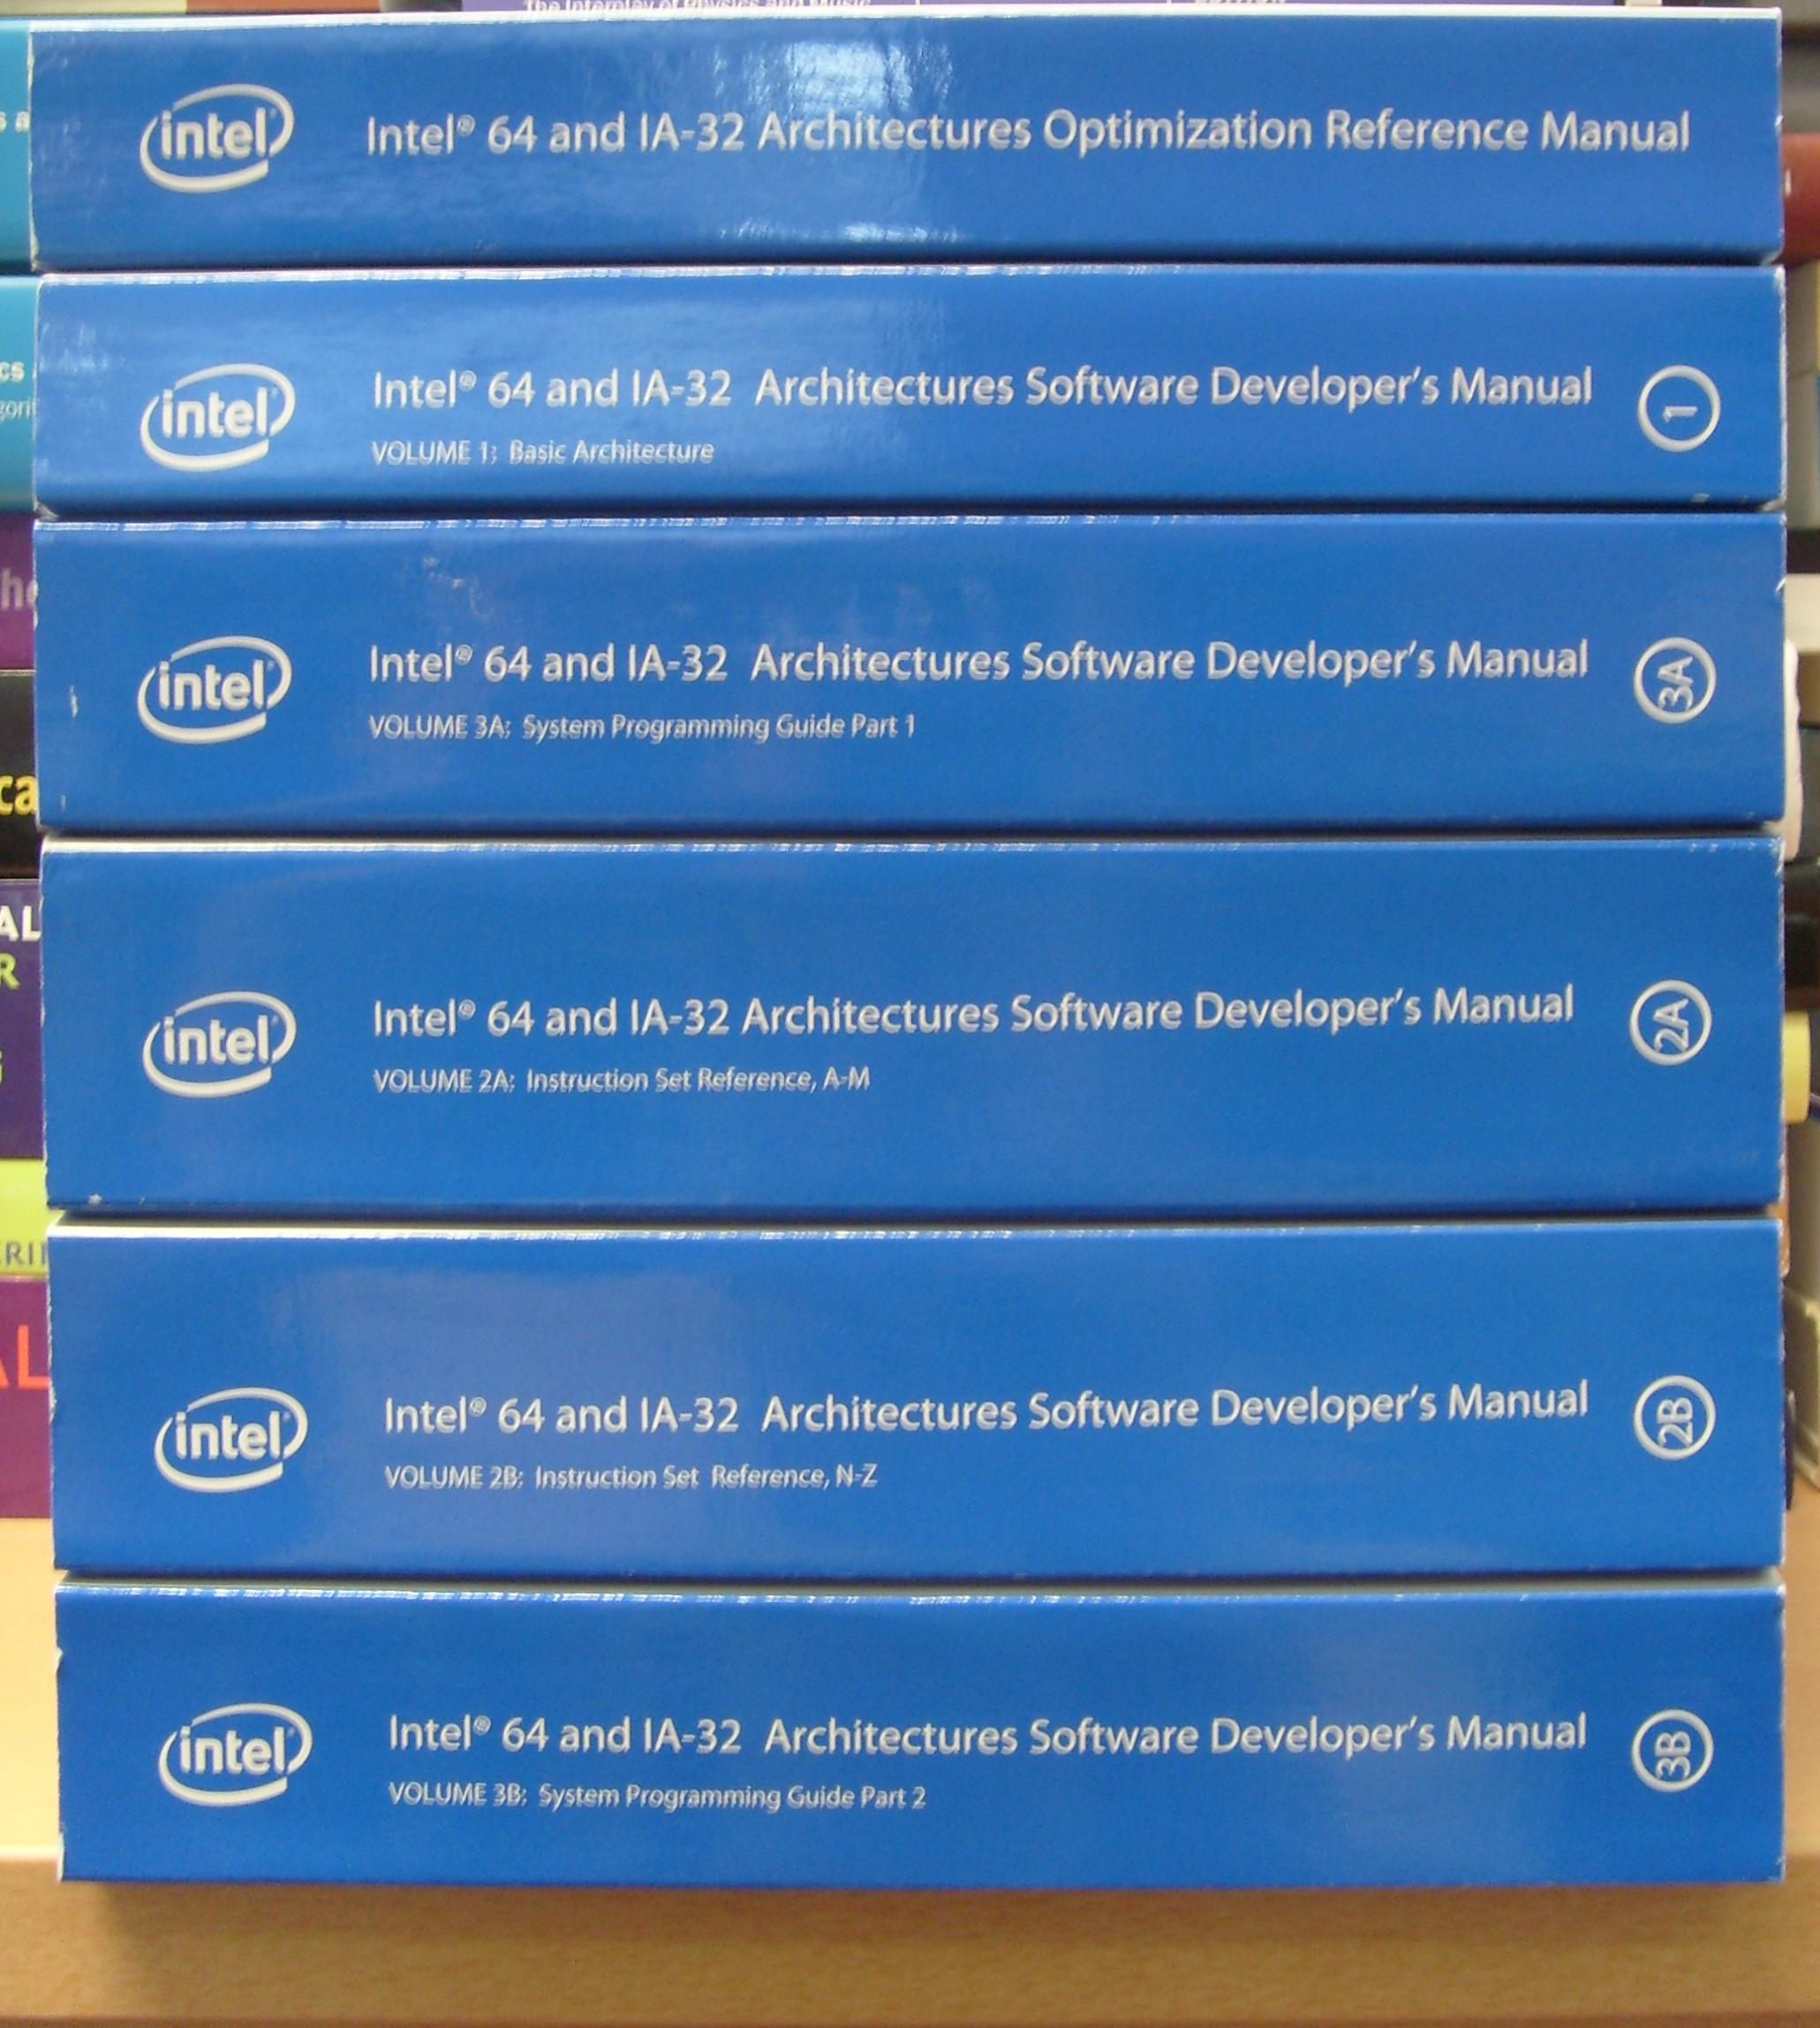
Information on how to order them can be found here:
http://www.intel.com/products/processor/manuals/index.htm
AMD docs can be downloaded from here:
http://developer.amd.com/documentation/guides/Pages/default.aspx
Comparing both online manuals I see sometimes that certain concepts are explained better in AMD docs and vice versa, so it is recommended to check both. It is also evident that AMD and Intel had to rephrase instruction descriptions differently when they talk about the same things, for example, BOUND instruction:
AMD: Check Array Bound
Intel: Check Array Index Against Bounds
- Dmitry Vostokov @ DumpAnalysis.org -
01:00 am 24.05 I noticed it reached #1 bestseller status in Assembly Language Programming category:
| Books > Computers & Internet > Programming > Languages & Tools > Assembly Language Programming |
Because the status is updated hourly you might not see the same status when you read this post ![]()
- Dmitry Vostokov @ DumpAnalysis.org -
This is a specialization of Invalid Pointer pattern called NULL Pointer and it is the most easily recognized pattern with a straightforward fix most of the time according to my experience. Checking the pointer value to be non-NULL might not work if the pointer value is random (Wild Pointer pattern) but at least it eliminates this class of problems. NULL pointers can be NULL data pointers or NULL code pointers. The latter happens when we have a pointer to some function and we try to call it. Consider this example:
0:002> r

eax=00000000 ebx=00000000 ecx=93630000 edx=00000000 esi=00000000 edi=00000000

eip=00000000 esp=0222ffbc ebp=0222ffec iopl=0  nv up ei pl zr na pe nc

cs=0023 ss=002b ds=002b es=002b fs=0053 gs=002b efl=00010246

00000000 ??              ???
0:002> kv

ChildEBP RetAddr  Args to Child

WARNING: Frame IP not in any known module. Following frames may be wrong.

0222ffb8 7d4dfe21 00000000 00000000 00000000 0×0

0222ffec 00000000 00000000 00000000 00000000 kernel32!BaseThreadStart+0×34
Clearly we have a NULL code pointer here and if we disassemble backwards the return address 7d4dfe21 or BaseThreadStart+0×34 we would suspect that BaseThreadStart function tried to call a thread start procedure:
0:002> ub 7d4dfe21

kernel32!BaseThreadStart+0x10:

7d4dfdfd mov     eax,dword ptr fs:[00000018h]

7d4dfe03 cmp     dword ptr [eax+10h],1E00h

7d4dfe0a jne     kernel32!BaseThreadStart+0x2e (7d4dfe1b)

7d4dfe0c cmp     byte ptr [kernel32!BaseRunningInServerProcess (7d560008)],0

7d4dfe13 jne     kernel32!BaseThreadStart+0x2e (7d4dfe1b)

7d4dfe15 call    dword ptr [kernel32!_imp__CsrNewThread (7d4d0310)]

7d4dfe1b push    dword ptr [ebp+0Ch]

7d4dfe1e call    dword ptr [ebp+8]
0:002> dp ebp+8 l1

0222fff4  00000000
To confirm this suspicion we can write a code that calls CreateThread function similar to this one:
typedef DWORD (WINAPI *THREADPROC)(PVOID);
DWORD WINAPI ThreadProc(PVOID pvParam)

{

  // Does some work

  return 0;

}
void foo()

{

  //..

  THREADPROC thProc = ThreadProc;

  //..

  // thProc becomes NULL because of a bug

  //..

  HANDLE Thread = CreateThread(NULL, 0, thProc, 0, 0, NULL);

  CloseHandle(hThread);

}
- Dmitry Vostokov @ DumpAnalysis.org -
This is the next scheduled book from Crash Dump Analysis Publishing Roadmap:
Draft Table of Contents will be published next month together with a sample chapter.
- Dmitry Vostokov @ DumpAnalysis.org -
Due to demand from people that prefer ebooks I published Memory Dump Analysis Anthology, Volume 1 in a digital format that can be purchased in Crash Dump Analysis Store. This format has color pictures inside.
- Dmitry Vostokov @ DumpAnalysis.org -
I’m very proud to announce that it is finally available in both paperback and hardback. Why have I made available both editions? Because I personally prefer hardcover books. You can order the book today and it will be printed in 3-5 days (paperback) or 5-10 days (hardcover) and sent to you:
Memory Dump Analysis Anthology, Volume 1
Note: although listed on Amazon and other online bookstores it is not immediately available at these stores at the moment due to the late submission. I apologize for this. However, I expect that in a few weeks pre-orders taken there will be eventually fulfilled. In the mean time, if you want the book now, you can use the link above.
- Dmitry Vostokov @ DumpAnalysis.org -
The case when a function pointer or a return address becomes a Wild Pointer and EIP or RIP value lies in a valid region of memory the execution path may continue through a region called Wild Code. This might loop on itself or eventually reach non-executable or invalid pages and produce an exception. Local Buffer Overflow might lead to this behavior and also data corruption that overwrites function pointers with valid memory addresses.
My favorite example is when a function pointer points to zeroed pages with EXECUTE page attribute. What will happen next when we dereference it? All zeroes are perfect x86/x64 code:
0:001> dd 0000000`771afdf0

00000000`771afdf0  00000000 00000000 00000000 00000000

00000000`771afe00  00000000 00000000 00000000 00000000

00000000`771afe10  00000000 00000000 00000000 00000000

00000000`771afe20  00000000 00000000 00000000 00000000

00000000`771afe30  00000000 00000000 00000000 00000000

00000000`771afe40  00000000 00000000 00000000 00000000

00000000`771afe50  00000000 00000000 00000000 00000000

00000000`771afe60  00000000 00000000 00000000 00000000
0:001> u

ntdll!DbgUserBreakPoint:

00000000`771afe00 0000    add     byte ptr [rax],al

00000000`771afe02 0000    add     byte ptr [rax],al

00000000`771afe04 0000    add     byte ptr [rax],al

00000000`771afe06 0000    add     byte ptr [rax],al

00000000`771afe08 0000    add     byte ptr [rax],al

00000000`771afe0a 0000    add     byte ptr [rax],al

00000000`771afe0c 0000    add     byte ptr [rax],al

00000000`771afe0e 0000    add     byte ptr [rax],al
Now if RAX points to a valid memory page with WRITE attribute the code will modify the first byte at that address:
0:001> dq @rax

000007ff`fffdc000 00000000`00000000 00000000`035a0000

000007ff`fffdc010 00000000`0359c000 00000000`00000000

000007ff`fffdc020 00000000`00001e00 00000000`00000000

000007ff`fffdc030 000007ff`fffdc000 00000000`00000000

000007ff`fffdc040 00000000`0000142c 00000000`00001504

000007ff`fffdc050 00000000`00000000 00000000`00000000

000007ff`fffdc060 000007ff`fffd8000 00000000`00000000

000007ff`fffdc070 00000000`00000000 00000000`00000000
Therefore the code will be perfectly executed:
0:001> t

ntdll!DbgBreakPoint+0x2:

00000000`771afdf2 0000    add     byte ptr [rax],al ds:000007ff`fffdc000=00
0:001> t

ntdll!DbgBreakPoint+0x4:

00000000`771afdf4 0000    add     byte ptr [rax],al ds:000007ff`fffdc000=00
0:001> t

ntdll!DbgBreakPoint+0x6:

00000000`771afdf6 0000    add     byte ptr [rax],al ds:000007ff`fffdc000=00
0:001> t

ntdll!DbgBreakPoint+0x8:

00000000`771afdf8 0000    add     byte ptr [rax],al ds:000007ff`fffdc000=00
0:001> t

ntdll!DbgBreakPoint+0xa:

00000000`771afdfa 0000    add     byte ptr [rax],al ds:000007ff`fffdc000=00
- Dmitry Vostokov @ DumpAnalysis.org -
Although the first volume has not been published yet (scheduled for 15th of April, 2008) the planning for the second volume has already begun. Preliminary information is:
Hardcover version is also planned. PDF version will be available for download too.
(*) subject to change
- Dmitry Vostokov @ DumpAnalysis.org -
This is a forthcoming reference book for technical support and escalation engineers troubleshooting and debugging complex software issues. The book is also invaluable for software maintenance and development engineers debugging unmanaged, managed and native code.
- Dmitry Vostokov @ DumpAnalysis.org -
Beginner users of WinDbg sometimes confuse the first 3 parameters (or 4 for x64) displayed by kb or kv commands with real function parameters:
0:000> kbnL

 # ChildEBP RetAddr  Args to Child

00 002df5f4 0041167b 002df97c 00000000 7efdf000 ntdll!DbgBreakPoint

01 002df6d4 004115c9 00000000 40000000 00000001 CallingConventions!A::thiscallFunction+0×2b

02 002df97c 004114f9 00000001 40001000 00000002 CallingConventions!fastcallFunction+0×69

03 002dfbf8 0041142b 00000000 40000000 00000001 CallingConventions!cdeclFunction+0×59

04 002dfe7c 004116e8 00000000 40000000 00000001 CallingConventions!stdcallFunction+0×5b

05 002dff68 00411c76 00000001 005a2820 005a28c8 CallingConventions!wmain+0×38

06 002dffb8 00411abd 002dfff0 7d4e7d2a 00000000 CallingConventions!__tmainCRTStartup+0×1a6

07 002dffc0 7d4e7d2a 00000000 00000000 7efdf000 CallingConventions!wmainCRTStartup+0xd

08 002dfff0 00000000 00411082 00000000 000000c8 kernel32!BaseProcessStart+0×28
The calling sequence for it is:
stdcallFunction(0, 0x40000000, 1, 0x40001000, 2, 0x40002000) ->

cdeclFunction(0, 0x40000000, 1, 0x40001000, 2, 0x40002000) ->

fastcallFunction(0, 0x40000000, 1, 0x40001000, 2, 0x40002000) ->

A::thiscallFunction(0, 0x40000000, 1, 0x40001000, 2, 0x40002000)
and we see that only in the case of fastcall calling convention we have discrepancy due to the fact that the first 2 parameters are passed not via stack but through ECX and EDX:
0:000> ub 004114f9

CallingConventions!cdeclFunction+0x45

004114e5 push    ecx

004114e6 mov     edx,dword ptr [ebp+14h]

004114e9 push    edx

004114ea mov     eax,dword ptr [ebp+10h]

004114ed push    eax

004114ee mov     edx,dword ptr [ebp+0Ch]

004114f1 mov     ecx,dword ptr [ebp+8]

004114f4 call    CallingConventions!ILT+475(?fastcallFunctionYIXHHHHHHZ) (004111e0)
However if we have full symbols we can see all parameters:
0:000> .frame 2

02 002df97c 004114f9 CallingConventions!fastcallFunction+0x69
0:000> dv /i /V

prv param  002df974 @ebp-0x08               a = 0

prv param  002df968 @ebp-0x14               b = 1073741824

prv param  002df984 @ebp+0x08               c = 1

prv param  002df988 @ebp+0x0c               d = 1073745920

prv param  002df98c @ebp+0x10               e = 2

prv param  002df990 @ebp+0x14               f = 1073750016

prv local  002df7c7 @ebp-0x1b5             obj = class A

prv local  002df7d0 @ebp-0x1ac           dummy = int [100]
How does dv command know about values in ECX and EDX which were definitely overwritten by later code? This is because the called function prolog saved them as local variables which you can notice as negative offsets for EBP register in dv output above:
0:000> uf CallingConventions!fastcallFunction

CallingConventions!fastcallFunction

   32 00411560 push    ebp

   32 00411561 mov     ebp,esp

   32 00411563 sub     esp,27Ch

   32 00411569 push    ebx

   32 0041156a push    esi

   32 0041156b push    edi

   32 0041156c push    ecx

   32 0041156d lea     edi,[ebp-27Ch]

   32 00411573 mov     ecx,9Fh

   32 00411578 mov     eax,0CCCCCCCCh

   32 0041157d rep stos dword ptr es:[edi]

   32 0041157f pop     ecx

   32 00411580 mov     dword ptr [ebp-14h],edx

   32 00411583 mov     dword ptr [ebp-8],ecx

…

…

…
I call this pattern as False Function Parameters where double checks and knowledge of calling conventions are required. Sometimes this pattern is a consequence of another pattern that I previously called Optimized Code.
x64 stack traces don’t show any discrepancies except the fact that thiscall function parameters are shifted to the right:
0:000> kbL

RetAddr           : Args to Child                                                           : Call Site

00000001`40001397 : cccccccc`cccccccc cccccccc`cccccccc cccccccc`cccccccc cccccccc`cccccccc : ntdll!DbgBreakPoint

00000001`40001233 : 00000000`0012fa94 cccccccc`00000000 cccccccc`40000000 cccccccc`00000001 : CallingConventions!A::thiscallFunction+0×37

00000001`40001177 : cccccccc`00000000 cccccccc`40000000 cccccccc`00000001 cccccccc`40001000 : CallingConventions!fastcallFunction+0×93

00000001`400010c7 : cccccccc`00000000 cccccccc`40000000 cccccccc`00000001 cccccccc`40001000 : CallingConventions!cdeclFunction+0×87

00000001`400012ae : cccccccc`00000000 cccccccc`40000000 cccccccc`00000001 cccccccc`40001000 : CallingConventions!stdcallFunction+0×87

00000001`400018ec : 00000001`00000001 00000000`00481a80 00000000`00000000 00000001`400026ee : CallingConventions!wmain+0×4e

00000001`4000173e : 00000000`00000000 00000000`00000000 00000000`00000000 00000000`00000000 : CallingConventions!__tmainCRTStartup+0×19c

00000000`77d5964c : 00000000`77d59620 00000000`00000000 00000000`00000000 00000000`0012ffa8 : CallingConventions!wmainCRTStartup+0xe

00000000`00000000 : 00000001`40001730 00000000`00000000 00000000`00000000 00000000`00000000 : kernel32!BaseProcessStart+0×29
How this can happen if the standard x64 calling convention passes the first 4 parameters via ECX, EDX, R8 and R9? This is because the called function prolog saved them on stack (this might not be true in the case of optimized code):
0:000> uf CallingConventions!fastcallFunction

CallingConventions!fastcallFunction

   32 00000001`400011a0 44894c2420      mov     dword ptr [rsp+20h],r9d

   32 00000001`400011a5 4489442418      mov     dword ptr [rsp+18h],r8d

   32 00000001`400011aa 89542410        mov     dword ptr [rsp+10h],edx

   32 00000001`400011ae 894c2408        mov     dword ptr [rsp+8],ecx

...

...

...
A::thiscallFunction function passes this pointer via ECX too and this explains the right shift of parameters.
Here is the C++ code I used for experimentation:
#include "stdafx.h"

#include <windows.h>
void __stdcall stdcallFunction (int, int, int, int, int, int);

void __cdecl cdeclFunction (int, int, int, int, int, int);

void __fastcall fastcallFunction (int, int, int, int, int, int);
class A

{

public:

 void thiscallFunction (int, int, int, int, int, int) { DebugBreak(); };

};
void __stdcall stdcallFunction (int a, int b, int c, int d, int e, int f)

{

 int dummy[100] = {0};
 cdeclFunction (a, b, c, d, e, f);

}
void __cdecl cdeclFunction (int a, int b, int c, int d, int e, int f)

{

 int dummy[100] = {0};
 fastcallFunction (a, b, c, d, e, f);

}
void __fastcall fastcallFunction (int a, int b, int c, int d, int e, int f)

{

 int dummy[100] = {0};
A obj;
 obj.thiscallFunction (a, b, c, d, e, f);

}
int _tmain(int argc, _TCHAR* argv[])

{

 stdcallFunction (0, 0x40000000, 1, 0x40001000, 2, 0x40002000);
 return 0;

}
- Dmitry Vostokov @ DumpAnalysis.org -
It is very easy to become a publisher nowadays. Much easier than I thought. I registered myself as a publisher under the name of OpenTask which is my registered business name in Ireland. I also got the list of ISBN numbers and therefore can announce product details for the first volume of Memory Dump Analysis Anthology series:
Memory Dump Analysis Anthology, Volume 1
(*) subject to change
PDF file will be available for download too.
- Dmitry Vostokov @ DumpAnalysis.org -
This question was asked hundreds of times in 2007 and here is the short answer. This is a return function address for trap frames created for system calls on x86 post-W2K systems.
Since Pentium II Microsoft changed OS call dispatching from interrupt driven INT /IRETD mechanism used in Windows NT and Windows 2000 to faster optimized instruction sequence. This is SYSENTER / SYSEXIT pair on x86 32-bit Intel platforms and SYSCALL / SYSRET pair on x64 Intel and AMD platforms.
INT instruction saves a return address but SYSENTER doesn’t. Let’s look at a typical thread call stack from complete memory dump coming from x86 Windows 2003 system:
1: kd> kL

ChildEBP RetAddr

a5a2ac64 80502d26 nt!KiSwapContext+0x2f

a5a2ac70 804faf20 nt!KiSwapThread+0x8a

a5a2ac98 805a4d6c nt!KeWaitForSingleObject+0x1c2

a5a2ad48 8054086c nt!NtReplyWaitReceivePortEx+0x3dc

a5a2ad48 7c91eb94 nt!KiFastCallEntry+0xfc

00a0fe18 7c91e399 ntdll!KiFastSystemCallRet

00a0fe1c 77e56703 ntdll!NtReplyWaitReceivePortEx+0xc

00a0ff80 77e56c22 RPCRT4!LRPC_ADDRESS::ReceiveLotsaCalls+0xf4

00a0ff88 77e56a3b RPCRT4!RecvLotsaCallsWrapper+0xd

00a0ffa8 77e56c0a RPCRT4!BaseCachedThreadRoutine+0×79

00a0ffb4 7c80b683 RPCRT4!ThreadStartRoutine+0×1a

00a0ffec 00000000 kernel32!BaseThreadStart+0×37
RPC module calls the native function to wait for a reply from an LPC port. Note that we disassemble the return address instead of the symbolic address because of OMAP Code Optimization:
1: kd> ub RPCRT4!LRPC_ADDRESS::ReceiveLotsaCalls+0xf4

                                                    ^ Unable to find valid previous instruction for 'ub RPCRT4!LRPC_ADDRESS::ReceiveLotsaCalls+0xf4'
1: kd> ub 77e56703

RPCRT4!LRPC_ADDRESS::ReceiveLotsaCalls+0xd9:

77e566e8 e8edfeffff      call    RPCRT4!RpcpPurgeEEInfoFromThreadIfNecessary (77e565da)

77e566ed ff75ec          push    dword ptr [ebp-14h]

77e566f0 8d45f0          lea     eax,[ebp-10h]

77e566f3 ff75f4          push    dword ptr [ebp-0Ch]

77e566f6 ff75fc          push    dword ptr [ebp-4]

77e566f9 50              push    eax

77e566fa ff7658          push    dword ptr [esi+58h]

77e566fd ff15b010e577    call    dword ptr [RPCRT4!_imp__NtReplyWaitReceivePortEx (77e510b0)]
1: kd> dps 77e510b0 l1

77e510b0  7c91e38d ntdll!ZwReplyWaitReceivePortEx
NTDLL stub for the native function is small and transitions to level 0 via shared SystemCallSub immediately:
1: kd> uf ntdll!NtReplyWaitReceivePortEx

ntdll!ZwReplyWaitReceivePortEx:

7c91e38d mov     eax,0C4h

7c91e392 mov     edx,offset SharedUserData!SystemCallStub (7ffe0300)

7c91e397 call    dword ptr [edx]

7c91e399 ret     14h
1: kd> dps 7ffe0300 l3

7ffe0300  7c91eb8b ntdll!KiFastSystemCall

7ffe0304  7c91eb94 ntdll!KiFastSystemCallRet

7ffe0308  00000000
1: kd> uf ntdll!KiFastSystemCall

ntdll!KiFastSystemCall:

7c91eb8b mov     edx,esp

7c91eb8d sysenter

7c91eb8f nop

7c91eb90 nop

7c91eb91 nop

7c91eb92 nop

7c91eb93 nop

7c91eb94 ret
Before executing SYSENTER ESP points to the following return address:
1: kd> u 7c91e399

ntdll!NtReplyWaitReceivePortEx+0xc:

7c91e399 ret     14h
SYSENTER instruction changes ESP and EIP to new values contained in machine-specific registers (MSR). As a result EIP points to nt!KiFastCallEntry. After saving a trap frame and checking parameters it calls nt!NtReplyWaitReceivePortEx address from system function table. When the latter function returns KiFastCallEntry proceeds to KiServiceExit and KiSystemCallExit2:
1: kd> ub 8054086c

nt!KiFastCallEntry+0xe2:

80540852 mov     ebx,dword ptr [edi+eax*4]

80540855 sub     esp,ecx

80540857 shr     ecx,2

8054085a mov     edi,esp

8054085c cmp     esi,dword ptr [nt!MmUserProbeAddress (80561114)]

80540862 jae     nt!KiSystemCallExit2+0×9f (80540a10)

80540868 rep movs dword ptr es:[edi],dword ptr [esi]

8054086a call    ebx
1: kd> u

nt!KiFastCallEntry+0x105:

80540875 mov     edx,dword ptr [ebp+3Ch]

80540878 mov     dword ptr [ecx+134h],edx

nt!KiServiceExit:

8054087e cli

8054087f test    dword ptr [ebp+70h],20000h

80540886 jne     nt!KiServiceExit+0x10 (8054088e)

80540888 test    byte ptr [ebp+6Ch],1

8054088c je      nt!KiServiceExit+0x66 (805408e4)

8054088e mov     ebx,dword ptr fs:[124h]
1: kd> u

nt!KiSystemCallExit2+0x12:

80540983 sti

80540984 sysexit
Let’s inspect the trap frame:
1: kd> kv5

ChildEBP RetAddr  Args to Child

a5a2ac64 80502d26 82ffc090 82ffc020 804faf20 nt!KiSwapContext+0x2f

a5a2ac70 804faf20 e12424b0 8055c0a0 e12424b0 nt!KiSwapThread+0x8a

a5a2ac98 805a4d6c 00000001 00000010 00000001 nt!KeWaitForSingleObject+0x1c2

a5a2ad48 8054086c 000000c8 00a0ff70 00000000 nt!NtReplyWaitReceivePortEx+0x3dc

a5a2ad48 7c91eb94 000000c8 00a0ff70 00000000 nt!KiFastCallEntry+0xfc (TrapFrame @ a5a2ad64)
1: kd> .trap a5a2ad64

ErrCode = 00000000

eax=00000000 ebx=00000000 ecx=00a0fd6c edx=7c91eb94 esi=00159b38 edi=00000100

eip=7c91eb94 esp=00a0fe1c ebp=00a0ff80 iopl=0 nv up ei pl zr na pe nc

cs=001b ss=0023 ds=0023 es=0023 fs=003b gs=0000 efl=00000246

ntdll!KiFastSystemCallRet:

001b:7c91eb94 ret
1: kd> kL

  *** Stack trace for last set context - .thread/.cxr resets it

ChildEBP RetAddr

00a0fe18 7c91e399 ntdll!KiFastSystemCallRet

00a0fe1c 77e56703 ntdll!NtReplyWaitReceivePortEx+0xc

00a0ff80 77e56c22 RPCRT4!LRPC_ADDRESS::ReceiveLotsaCalls+0xf4

00a0ff88 77e56a3b RPCRT4!RecvLotsaCallsWrapper+0xd

00a0ffa8 77e56c0a RPCRT4!BaseCachedThreadRoutine+0x79

00a0ffb4 7c80b683 RPCRT4!ThreadStartRoutine+0x1a

00a0ffec 00000000 kernel32!BaseThreadStart+0x37
Therefore I believe the dummy ntdll!KiFastSystemCallRet function with one RET instruction is used to create a uniform trap frame across system calls. Otherwise trap frames for different native API calls would contain different return values.
While reading this post I found two related articles. The first one explains old mechanism for Windows NT and the second one explains the new one:
I’ll cover SYSCALL / SYSRET in another blog post.
- Dmitry Vostokov @ DumpAnalysis.org -
Found the following book which is an interesting read to see crash dump analysis from a different operating system architecture perspective but on the same Intel / AMD platform:
http://www.genunix.org/gen/crashdump/book.pdf
- Dmitry Vostokov @ DumpAnalysis.org -
Where do native exceptions come from? How do they propagate from hardware and eventually result in crash dumps? I was asking these questions when I started doing crash dump analysis more than four years ago and I tried to find answers using IA-32 Intel® Architecture Software Developer’s Manual, WinDbg and complete memory dumps.
Eventually I wrote some blog posts about my findings. They are buried between many other posts so I dug them out and put on a dedicated page:
Interrupts and Exceptions Explained
- Dmitry Vostokov @ DumpAnalysis.org -