Now it is the turn for the yet another pattern of a deadlock variety involving mixed objects in kernel space. Previously we discussed deadlock patterns involving critical sections in user space, executive resources in kernel space, mixed objects in user space and LPC.
Let’s look at a complete manual dump file from a hanging system:
0: kd> !analyze -v
NMI_HARDWARE_FAILURE (80)

This is typically due to a hardware malfunction.  The hardware supplier should

be called.

Arguments:

Arg1: 004f4454

Arg2: 00000000

Arg3: 00000000

Arg4: 00000000
Here we have problems reading all executive resource locks:
3: kd> !locks

**** DUMP OF ALL RESOURCE OBJECTS ****

KD: Scanning for held locks....
Resource @ nt!CmpRegistryLock (0x808a48c0)    Shared 36 owning threads

    Contention Count = 48

     Threads: 86aecae0-01<*> 8b76db40-01<*> 8b76ddb0-01<*> 89773020-01<*>

              87222db0-01<*> 87024ba8-01<*> 89a324f0-01<*> 86b4e298-01<*>

              87925b40-01<*> 86b4db40-01<*> 8701f738-01<*> 86ffb198-01<*>

              86b492f0-01<*> 8701bad8-01<*> 86ae2db0-01<*> 86c85db0-01<*>

              86a9ddb0-01<*> 86a86db0-01<*> 86aa7db0-01<*> 86a9f5c0-01<*>

              86c5adb0-01<*> 8767ba38-01<*> 86afedb0-01<*> 89877960-01<*>

              8772cdb0-01<*> 87348628-01<*> 874d6748-01<*> 872365e0-01<*>

              87263970-01<*> 873bf020-01<*> 86c13db0-01<*> 893dcdb0-01<*>

              86afa020-01<*> 878e5020-01<*> 874959f8-01<*> 86b2dc70-01<*>

KD: Scanning for held locks…Error 1 in reading nt!_ERESOURCE.SystemResourcesList.Flink @ f76ee2a0
This is probably because the dump was truncated:
Loading Dump File [MEMORY.DMP]

Kernel Complete Dump File: Full address space is available
WARNING: Dump file has been truncated. Data may be missing.
However looking at the resource 808a48c0 closely we see that it is owned by the thread 86aecae0 (Cid 2810.2910) which is blocked on a mutant owned by the thread 86dcf3a8:
3: kd> !locks -v 0x808a48c0
Resource @ nt!CmpRegistryLock (0x808a48c0)    Shared 36 owning threads

    Contention Count = 48

     Threads: 86aecae0-01<*>
     THREAD 86aecae0  Cid 2810.2910  Teb: 7ffdd000 Win32Thread: bc54ab88 WAIT: (Unknown) KernelMode Non-Alertable

         86dda264  Mutant - owning thread 86dcf3a8

     Not impersonating

     DeviceMap                 da534618

     Owning Process            86f30b70       Image:         ApplicationA.exe

     Wait Start TickCount      1074481        Ticks: 51601 (0:00:13:26.265)

     Context Switch Count      9860                 LargeStack

     UserTime                  00:00:01.125

     KernelTime                00:00:00.890

     Win32 Start Address 0×300019f0

     Start Address kernel32!BaseProcessStartThunk (0×7c8217f8)

     Stack Init b5342000 Current b5341150 Base b5342000 Limit b533d000 Call 0

     Priority 12 BasePriority 10 PriorityDecrement 0

     ChildEBP RetAddr

     b5341168 80833465 nt!KiSwapContext+0×26

     b5341194 80829a62 nt!KiSwapThread+0×2e5

     b53411dc b91f4c08 nt!KeWaitForSingleObject+0×346

WARNING: Stack unwind information not available. Following frames may be wrong.

     b5341200 b91ee770 driverA+0xec08

     b5341658 b91e9ca7 driverA+0×8770

     b5341af0 8088978c driverA+0×3ca7

     b5341af0 8082f829 nt!KiFastCallEntry+0xfc

     b5341b7c 808ce716 nt!ZwSetInformationFile+0×11

     b5341bbc 808dd8d8 nt!CmpDoFileSetSize+0×5e

     b5341bd4 808bd798 nt!CmpFileSetSize+0×16

     b5341bf4 808be23f nt!HvpGrowLog1+0×52

     b5341c18 808bfc6b nt!HvMarkDirty+0×453

     b5341c40 808c3fd4 nt!HvMarkCellDirty+0×255

     b5341cb4 808b7e2f nt!CmSetValueKey+0×390

     b5341d44 8088978c nt!NtSetValueKey+0×241

     b5341d44 7c9485ec nt!KiFastCallEntry+0xfc

     0013f5fc 00000000 ntdll!KiFastSystemCallRet
8b76db40-01<*>
     THREAD 8b76db40  Cid 0004.00c8  Teb: 00000000 Win32Thread: 00000000 GATEWAIT

     Not impersonating

     DeviceMap                 d6600900

     Owning Process            8b7772a8       Image:         System

     Wait Start TickCount      1074667        Ticks: 51415 (0:00:13:23.359)

     Context Switch Count      65106

     UserTime                  00:00:00.000

     KernelTime                00:00:00.781

     Start Address nt!ExpWorkerThread (0x80880352)

     Stack Init bae35000 Current bae34c68 Base bae35000 Limit bae32000 Call 0

     Priority 12 BasePriority 12 PriorityDecrement 0

     ChildEBP RetAddr

     bae34c80 80833465 nt!KiSwapContext+0x26

     bae34cac 8082ffc0 nt!KiSwapThread+0x2e5

     bae34cd4 8087d6f6 nt!KeWaitForGate+0x152

     dbba6d78 00000000 nt!ExfAcquirePushLockExclusive+0x112
[...]
A reminder about Cid. It is the so called Client id composed from Process id and Thread id (Pid.Tid). Also a mutant is just another name for a mutex object which has an ownership semantics:
0: kd> dt _KMUTANT 86dda264

nt!_KMUTANT

   +0x000 Header           : _DISPATCHER_HEADER

   +0x010 MutantListEntry  : _LIST_ENTRY [ 0x86dcf3a8 - 0x86dcf3a8 ]

   +0×018 OwnerThread      : 86dcf3a8 _KTHREAD

   +0×01c Abandoned        : 0 ”

   +0×01d ApcDisable       : 0×1 ”
Now we look at that thread 86dcf3a8 and see that it belongs to ApplicationB (Cid 25a0.14b8):
3: kd> !thread 86dcf3a8

THREAD 86dcf3a8  Cid 25a0.14b8  Teb: 7ffa9000 Win32Thread: bc3e0d20 WAIT: (Unknown) UserMode Non-Alertable

    8708b888  Thread

    86dcf420  NotificationTimer

Not impersonating

DeviceMap                 da534618

Owning Process            87272d88       Image:         ApplicationB.exe

Wait Start TickCount      1126054        Ticks: 28 (0:00:00:00.437)

Context Switch Count      2291                 LargeStack

UserTime                  00:00:00.078

KernelTime                00:00:00.218

Win32 Start Address msvcrt!_endthreadex (0×77b9b4bc)

Start Address kernel32!BaseThreadStartThunk (0×7c8217ec)

Stack Init b550a000 Current b5509c60 Base b550a000 Limit b5507000 Call 0

Priority 8 BasePriority 8 PriorityDecrement 0

ChildEBP RetAddr  Args to Child

b5509c78 80833465 86dcf3a8 86dcf450 00000003 nt!KiSwapContext+0×26

b5509ca4 80829a62 00000000 b5509d14 00000000 nt!KiSwapThread+0×2e5

b5509cec 80938d0c 8708b888 00000006 00000001 nt!KeWaitForSingleObject+0×346

b5509d50 8088978c 00000960 00000000 b5509d14 nt!NtWaitForSingleObject+0×9a

b5509d50 7c9485ec 00000960 00000000 b5509d14 nt!KiFastCallEntry+0xfc

WARNING: Stack unwind information not available. Following frames may be wrong.

0454f3cc 00000000 00000000 00000000 00000000 ntdll!KiFastSystemCallRet
We see that it is waiting on 8708b888 object which is a thread itself and it is waiting on the same mutant 86dda264 owned by the thread 86dcf3a8 (Cid 25a0.14b8):
3: kd> !thread 8708b888

THREAD 8708b888  Cid 25a0.1cb0  Teb: 7ffa6000 Win32Thread: bc3ecb20 WAIT: (Unknown) KernelMode Non-Alertable

    86dda264  Mutant - owning thread 86dcf3a8

Not impersonating

DeviceMap                 da534618

Owning Process            87272d88       Image:         ApplicationB.exe

Wait Start TickCount      1070470        Ticks: 55612 (0:00:14:28.937)

Context Switch Count      11                 LargeStack

UserTime                  00:00:00.000

KernelTime                00:00:00.000

Win32 Start Address dll!_beginthread (0×1b1122a9)

Start Address kernel32!BaseThreadStartThunk (0×7c8217ec)

Stack Init b4d12000 Current b4d117fc Base b4d12000 Limit b4d0f000 Call 0

Priority 9 BasePriority 8 PriorityDecrement 0

ChildEBP RetAddr  Args to Child

b4d11814 80833465 8708b888 8708b930 00000003 nt!KiSwapContext+0×26

b4d11840 80829a62 0000096c b4d118c4 b91e8f08 nt!KiSwapThread+0×2e5

b4d11888 b91f4c08 86dda264 00000006 00000000 nt!KeWaitForSingleObject+0×346

WARNING: Stack unwind information not available. Following frames may be wrong.

b4d118ac b91ee818 86dda260 b4d11d64 86dda000 DriverA+0xec08

b4d11d04 b91e8f58 000025a0 0000096c b4d11d64 DriverA+0×8818

b4d11d58 8088978c 0000096c 0567f974 7c9485ec DriverA+0×2f58

b4d11d58 7c9485ec 0000096c 0567f974 7c9485ec nt!KiFastCallEntry+0xfc

0567f974 30cba6ad 0000096c 00000000 00000003 ntdll!KiFastSystemCallRet
We can summarize our findings on the following wait chain diagram:
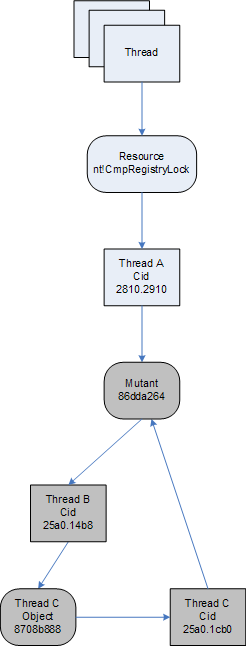
Looking from the component-object relationship perspective it is DriverA.sys that is waiting on the mutant 86dda264 although both blocked threads B and C belong to ApplicationB process.
- Dmitry Vostokov @ DumpAnalysis.org -