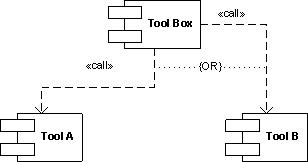
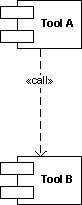
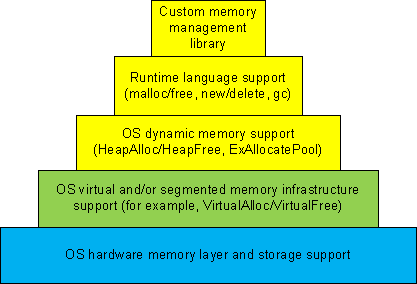
Dynamic memory allocation architecture usually consists of different layers where the lower layers provide support for the upper ones and some general layers can be combined or omitted like in TCP/IP implementation of OSI reference model:
-
1a. Custom memory management library.
-
1b. Runtime language support (malloc/free, new/delete, gc).
-
1c. OS dynamic memory support (HeapAlloc/HeapFree, ExAllocatePool/ExFreePool).
-
2. OS virtual and/or segmented memory infrastructure support (VirtualAlloc/VirtualFree).
-
3. OS hardware memory layer and storage support.
We can call it DMI (Dynamic Memory Infrastructure) and this can be summarized on the following diagram:
First-order memory leaks happen when an application uses layers 1a, 1b or 1c and doesn’t free allocated memory. Typical pattern examples include:
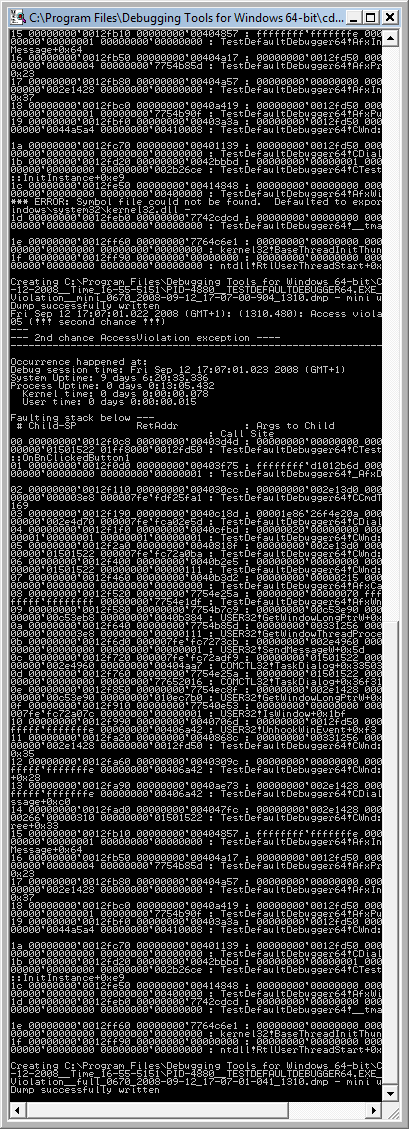
What we cover here are second-order leaks in layers 2 an 3. These include cases when an application frees memory but the underlying supporting layer doesn’t due to its design or factors like fragmentation. Consider an example of a Windows service that undergone committed memory increase from 600Mb to almost 1.2Gb during peak hours and then remained at that size even when no activity happened afterwards. We can examine virtual memory statistics using !address WinDbg command from 3 sampled memory dumps:
Before peak hours:
-------------------- Usage SUMMARY --------------------------

    TotSize (      KB)   Pct(Tots) Pct(Busy)   Usage

    734d000 (  118068) : 05.63%    07.50%    : RegionUsageIsVAD

   1ff11000 (  523332) : 24.96%    00.00%    : RegionUsageFree

    4352000 (   68936) : 03.29%    04.38%    : RegionUsageImage

    5a00000 (   92160) : 04.39%    05.86%    : RegionUsageStack

      5a000 (     360) : 00.02%    00.02%    : RegionUsageTeb

   4efe3000 ( 1294220) : 61.72%    82.24%    : RegionUsageHeap

          0 (       0) : 00.00%    00.00%    : RegionUsagePageHeap

       1000 (       4) : 00.00%    00.00%    : RegionUsagePeb

       1000 (       4) : 00.00%    00.00%    : RegionUsageProcessParametrs

       1000 (       4) : 00.00%    00.00%    : RegionUsageEnvironmentBlock

       Tot: 7fff0000 (2097088 KB) Busy: 600df000 (1573756 KB)
-------------------- Type SUMMARY --------------------------

    TotSize (      KB)   Pct(Tots)  Usage

   1ff11000 (  523332) : 24.96%   : <free>

    4352000 (   68936) : 03.29%   : MEM_IMAGE

     b78000 (   11744) : 00.56%   : MEM_MAPPED

   5b215000 ( 1493076) : 71.20%   : MEM_PRIVATE
-------------------- State SUMMARY --------------------------

    TotSize (      KB)   Pct(Tots)  Usage

   25e50000 (  620864) : 29.61%   : MEM_COMMIT

   1ff11000 (  523332) : 24.96%   : MEM_FREE

   3a28f000 (  952892) : 45.44%   : MEM_RESERVE
During peak hours:
-------------------- Usage SUMMARY --------------------------

  TotSize ( KB) Pct(Tots) Pct(Busy) Usage

  734d000 ( 118068) : 05.63% 07.49% : RegionUsageIsVAD

  1fd0f000 ( 521276) : 24.86% 00.00% : RegionUsageFree

  4352000 ( 68936) : 03.29% 04.37% : RegionUsageImage

  5c00000 ( 94208) : 04.49% 05.98% : RegionUsageStack

  5c000 ( 368) : 00.02% 00.02% : RegionUsageTeb

4efe3000 ( 1294220) : 61.72% 82.13% : RegionUsageHeap

  0 ( 0) : 00.00% 00.00% : RegionUsagePageHeap

  1000 ( 4) : 00.00% 00.00% : RegionUsagePeb

  1000 ( 4) : 00.00% 00.00% : RegionUsageProcessParametrs

  1000 ( 4) : 00.00% 00.00% : RegionUsageEnvironmentBlock

  Tot: 7fff0000 (2097088 KB) Busy: 602e1000 (1575812 KB)
-------------------- Type SUMMARY --------------------------

  TotSize ( KB) Pct(Tots) Usage

  1fd0f000 ( 521276) : 24.86% :

  4352000 ( 68936) : 03.29% : MEM_IMAGE

  b78000 ( 11744) : 00.56% : MEM_MAPPED

  5b417000 ( 1495132) : 71.30% : MEM_PRIVATE
-------------------- State SUMMARY --------------------------

  TotSize ( KB) Pct(Tots) Usage

41498000 ( 1069664) : 51.01% : MEM_COMMIT

  1fd0f000 ( 521276) : 24.86% : MEM_FREE

  1ee49000 ( 506148) : 24.14% : MEM_RESERVE
After peak hours:
-------------------- Usage SUMMARY --------------------------

    TotSize (      KB)   Pct(Tots) Pct(Busy)   Usage

    734d000 (  118068) : 05.63%    07.49%    : RegionUsageIsVAD

   1fd0f000 (  521276) : 24.86%    00.00%    : RegionUsageFree

    4352000 (   68936) : 03.29%    04.37%    : RegionUsageImage

    5c00000 (   94208) : 04.49%    05.98%    : RegionUsageStack

      5c000 (     368) : 00.02%    00.02%    : RegionUsageTeb

   4efe3000 ( 1294220) : 61.72%    82.13%    : RegionUsageHeap

          0 (       0) : 00.00%    00.00%    : RegionUsagePageHeap

       1000 (       4) : 00.00%    00.00%    : RegionUsagePeb

       1000 (       4) : 00.00%    00.00%    : RegionUsageProcessParametrs

       1000 (       4) : 00.00%    00.00%    : RegionUsageEnvironmentBlock

       Tot: 7fff0000 (2097088 KB) Busy: 602e1000 (1575812 KB)
-------------------- Type SUMMARY --------------------------

    TotSize (      KB)   Pct(Tots)  Usage

   1fd0f000 (  521276) : 24.86%   : <free>

    4352000 (   68936) : 03.29%   : MEM_IMAGE

     b78000 (   11744) : 00.56%   : MEM_MAPPED

   5b417000 ( 1495132) : 71.30%   : MEM_PRIVATE
-------------------- State SUMMARY --------------------------

    TotSize (      KB)   Pct(Tots)  Usage

   4505d000 ( 1130868) : 53.93%   : MEM_COMMIT

   1fd0f000 (  521276) : 24.86%   : MEM_FREE

   1b284000 (  444944) : 21.22%   : MEM_RESERVE
We see that in every memory dump the amount of process heap is the same 1.2Gb but during peak hours the amount of committed memory increased by 20% and remained the same even after. At the same time if we look at process heap statistics we would see the increase of free heap KB and blocks and this means that allocated memory was freed after peak hours but underlying virtual memory ranges were not decommitted and fragmentation increased by 25%.
Before peak hours:
0:000> !heap -s

LFH Key : 0x07262959

  Heap     Flags   Reserv  Commit  Virt   Free  List   UCR  Virt  Lock  Fast

                    (k)     (k)    (k)     (k) length      blocks cont. heap

[...]

00310000 00001002 1255320 512712 1177236 260583 45362 41898 2 3751a5 L

  External fragmentation 50 % (45362 free blocks)

  Virtual address fragmentation 56 % (41898 uncommited ranges)

  Lock contention 3625381

[…]
During peak hours:
0:000> !heap -s

LFH Key : 0x07262959

  Heap     Flags   Reserv  Commit  Virt   Free  List   UCR  Virt  Lock  Fast

                    (k)     (k)    (k)     (k) length      blocks cont. heap

[...]

00310000 00001002 1255320 961480 1249548 105378 0 16830 2 453093 L

  Virtual address fragmentation 23 % (16830 uncommited ranges)

  Lock contention 4534419

[…]
After peak hours:
0:000> !heap -s

LFH Key : 0x07262959

  Heap     Flags   Reserv  Commit  Virt   Free  List   UCR  Virt  Lock  Fast

                    (k)     (k)    (k)     (k) length      blocks cont. heap

[...]

00310000 00001002 1255320 1022648 1224344 772682 264787 17512 2 580634 L

  External fragmentation 75 % (264787 free blocks)

  Virtual address fragmentation 16 % (17512 uncommited ranges)

  Lock contention 5768756

[…]
Another example would be custom memory management library that by design never releases virtual memory allocated to accommodate the increased number of allocation requests after all of them are freed.
- Dmitry Vostokov @ DumpAnalysis.org -