Windows imposes a restriction for the number of GDI handles per process and by default it is approx. 10,000. If this number is reached we can have abnormal software behaviour symptoms such as hangs, glitches in visual appearance, and out-of-memory exceptions resulted in error messages and crashes. We already documented this analysis pattern for kernel and complete memory dumps that we called Handle Limit (GDI). However, one of Software Diagnostics Services’ training customers reported an out-of-memory exception with trace analysis diagnostics pointing to 10,000 leaked GDI objects. The process memory dump was saved and the customer asked whether it was possible to analyze it or similar memory dumps to find out from the dump itself whether we have GDI leak and what GDI objects were involved.
We recreated one of the applications from the kernel pattern variant (the one that leaks fonts) with one modification that it just stops after 10,000 font creation attempts. After launch we tried to open About dialog box but the whole application became unresponsive and no dialog box was visible. We save the process memory dump ad found out that its Main Thread was inside Dialog Box processing:
0:000> kc

# Call Site

00 user32!NtUserWaitMessage

01 user32!DialogBox2

02 user32!InternalDialogBox

03 user32!DialogBoxIndirectParamAorW

04 user32!DialogBoxParamW

05 GUIHandleLeak!WndProc

06 user32!UserCallWinProcCheckWow

07 user32!DispatchMessageWorker

08 GUIHandleLeak!wWinMain

09 GUIHandleLeak!invoke_main

0a GUIHandleLeak!__scrt_common_main_seh

0b kernel32!BaseThreadInitThunk

0c ntdll!RtlUserThreadStart
In order to look at GDI handle table we studied the relevant chapters in Feng Yuan’s book “Windows Graphics Programming” and this post which has all necessary structure definitions: http://stackoverflow.com/questions/13905661/how-to-get-list-of-gdi-handles
We get the current process GDI table address from the disassembly:
0:000> .asm no_code_bytes

Assembly options: no_code_bytes
0:000> uf gdi32!GdiQueryTable

gdi32!GdiQueryTable:

00007ffc`7f172610 sub     rsp,38h

00007ffc`7f172614 or      qword ptr [rsp+20h],0FFFFFFFFFFFFFFFFh

00007ffc`7f17261a lea     rdx,[rsp+20h]

00007ffc`7f17261f mov     ecx,0Eh

00007ffc`7f172624 mov     byte ptr [rsp+28h],0

00007ffc`7f172629 call    qword ptr [gdi32!_imp_NtVdmControl (00007ffc`7f1ba5a8)]

00007ffc`7f17262f test    eax,eax

00007ffc`7f172631 js      gdi32!GdiQueryTable+0x33 (00007ffc`7f172643)  Branch
gdi32!GdiQueryTable+0x23:

00007ffc`7f172633 cmp     byte ptr [rsp+28h],0

00007ffc`7f172638 je      gdi32!GdiQueryTable+0x33 (00007ffc`7f172643)  Branch
gdi32!GdiQueryTable+0x2a:

00007ffc`7f17263a mov     rax,qword ptr [gdi32!pGdiSharedHandleTable (00007ffc`7f2541b8)]

00007ffc`7f172641 jmp     gdi32!GdiQueryTable+0×35 (00007ffc`7f172645)  Branch
gdi32!GdiQueryTable+0x33:

00007ffc`7f172643 xor     eax,eax
gdi32!GdiQueryTable+0x35:

00007ffc`7f172645 add     rsp,38h

00007ffc`7f172649 ret
0:000> dp 00007ffc`7f2541b8 L1

00007ffc`7f2541b8  000000db`56a50000
We dump the first 0×1000 qword values:
0:000> dq 000000db`56a50000 L1000

000000db`56a50000  00000000`00000000 40000000`00000000

000000db`56a50010  00000000`00000000 00000000`00000000

000000db`56a50020  40000000`00000000 00000000`00000000

000000db`56a50030  00000000`00000000 00000000`00000000

000000db`56a50040  00000000`00000000 00000000`00000000

000000db`56a50050  00000000`00000000 00000000`00000000

000000db`56a50060  00000000`00000000 00000000`00000000

000000db`56a50070  00000000`00000000 00000000`00000000

000000db`56a50080  00000000`00000000 00000000`00000000

000000db`56a50090  00000000`00000000 00000000`00000000

000000db`56a500a0  00000000`00000000 00000000`00000000

000000db`56a500b0  00000000`00000000 00000000`00000000

000000db`56a500c0  00000000`00000000 00000000`00000000

000000db`56a500d0  00000000`00000000 00000000`00000000

000000db`56a500e0  00000000`00000000 00000000`00000000

000000db`56a500f0  fffff901`40000e60 40040104`00000000

000000db`56a50100  00000000`00000000 fffff901`40000d60

000000db`56a50110  40080188`00000000 00000000`00000000

000000db`56a50120  fffff901`400008b0 40080108`00000000

000000db`56a50130  00000000`00000000 fffff901`400007c0

000000db`56a50140  40080108`00000000 00000000`00000000

000000db`56a50150  fffff901`400006d0 40080108`00000000

[…]

000000db`56a57ce0  fffff901`429d24f0 400aee0a`00002c30

000000db`56a57cf0  000000db`564f3b20 fffff901`42910570

000000db`56a57d00  400a360a`00002c30 000000db`564e57b0

000000db`56a57d10  fffff901`40700420 40105310`000002b4

000000db`56a57d20  00000089`39410fc0 fffff901`407ec4a0

000000db`56a57d30  400a010a`000002b4 00000089`3900ae70

000000db`56a57d40  fffff901`407036d0 400a010a`000002b4

000000db`56a57d50  00000089`3900ae60 fffff901`440b56e0

000000db`56a57d60  400a030a`00002c30 000000db`564f0e90

000000db`56a57d70  fffff901`43e7fd50 40040104`00000000

000000db`56a57d80  00000000`00000000 fffff901`42c0f010

000000db`56a57d90  400a4b0a`00003190 0000003a`1a30b670

000000db`56a57da0  fffff901`440deaf0 400a6d0a`00002c30

000000db`56a57db0  000000db`564f3b00 fffff901`407f2010

000000db`56a57dc0  40100510`00001704 000000d8`d6230f60

000000db`56a57dd0  fffff901`40714180 40100210`00001704

000000db`56a57de0  000000d8`d6230f48 fffff901`4009d840

000000db`56a57df0  40100210`00001704 000000d8`d6230f78

000000db`56a57e00  fffff901`43e50950 40100230`00001704

000000db`56a57e10  00000000`00000000 fffff901`43e30010

000000db`56a57e20  40100230`00001704 00000000`00000000

000000db`56a57e30  fffff901`44f1d010 4005a105`0000168c

000000db`56a57e40  00000000`00000000 fffff901`440ded80

000000db`56a57e50  400a2e0a`00002c30 000000db`564f3b10

000000db`56a57e60  fffff901`4070b3b0 40050405`00000000

000000db`56a57e70  00000000`00000000 fffff901`42a0a010

000000db`56a57e80  400a870a`00002c30 000000db`564e7160

000000db`56a57e90  fffff901`407a7450 4008cd08`00000000

000000db`56a57ea0  00000000`00000000 fffff901`400c49c0

000000db`56a57eb0  40046904`000002b4 00000089`39410f90

000000db`56a57ec0  fffff901`41fb8010 4005c705`00000000

000000db`56a57ed0  00000000`00000000 fffff901`423dc790

000000db`56a57ee0  40086708`00000000 00000000`00000000

000000db`56a57ef0  fffff901`40699620 40010301`0000168c

000000db`56a57f00  00000000`01100000 fffff901`43e54510

000000db`56a57f10  40050305`0000168c 00000000`00000000

000000db`56a57f20  fffff901`407164c0 40100610`00001448

000000db`56a57f30  000000fe`4d8d0cf0 fffff901`407eee50

000000db`56a57f40  40100410`00001448 000000fe`4d8d0cd8

000000db`56a57f50  fffff901`43e2abb0 40080508`00000000

000000db`56a57f60  00000000`00000000 fffff901`40715010

000000db`56a57f70  40050305`0000168c 00000000`00000000

000000db`56a57f80  fffff901`42872b80 40084e08`00000000

000000db`56a57f90  00000000`00000000 fffff901`407175a0

000000db`56a57fa0  410f080f`00000000 00000000`00000000

000000db`56a57fb0  fffff901`407f4000 40050605`00000000

000000db`56a57fc0  00000000`00000000 fffff901`406d6bb0

000000db`56a57fd0  40080508`00000000 00000000`00000000

000000db`56a57fe0  fffff901`43e3a4c0 40120812`00000000

000000db`56a57ff0  00000000`00000000 fffff901`44fe1010
We see that typical cell value has 3 qwords (8-byte or 4-word sized values for both x64 and Virtualized Process). The non-zeroed data starts from 000000db`56a500f0 address. Clearly some entries have wProcessId equal to the PID from our dump:
0:000> ~

.  0  Id: 2c30.292c Suspend: 0 Teb: 00007ff7`1bf3e000 Unfrozen
Let’s look at one of such entries (the first and the last qword values are pointers):
0:000> dq 000000db`56a57da0 L3

000000db`56a57da0  fffff901`440deaf0 400a6d0a`00002c30

000000db`56a57db0  000000db`564f3b00
0:000> dw 000000db`56a57da0 L3*4

000000db`56a57da0  eaf0 440d f901 ffff 2c30 0000 6d0a 400a

000000db`56a57db0  3b00 564f 00db 0000
Applying 7f to wType word 400a gives us 0xa or 10 which is a font handle:
0:000> ? 400a & 7f

Evaluate expression: 10 = 00000000`0000000a
Since there are entries from other processes from the same session in this table assessing the handle leak visually is difficult so we wrote a WinDbg script that goes from the first non-zero pKernelAddress ($t0) to the first zero entry and for the given wProcessId ($tpid) counts the number of entries ($t1) and the number of entries ($t3) for the given wType ($t2). The script also counts the total entries till the first zero one ($t4):
.while (qwo(@$t0)) { .if (wo(@$t0+8) == @$tpid) {r $t1 = @$t1+1; .if (((qwo(@$t0+8) >> 0n48) & 7f) == @$t2) {r $t3 = @$t3+1} }; r $t0 = @$t0+3*8; r $t4 = @$t4+1}
To execute it we prepare the variables:
0:000> r $t0=000000db`56a500f0
0:000> r $t1=0
0:000> r $t2=a
0:000> r $t3=0
0:000> r $t4=0
0:000> .while (qwo(@$t0)) { .if (wo(@$t0+8) == @$tpid) {r $t1 = @$t1+1; .if (((qwo(@$t0+8) >> 0n48) & 7f) == @$t2) {r $t3 = @$t3+1} }; r $t0 = @$t0+3*8; r $t4 = @$t4+1}
After execution we get the modified variables that show us that the total consecutive non-zero handle table entries is 21464, the total number of entries for the current process is 9990, and the total number of fonts is 9982:
0:000> ? $t0

Evaluate expression: 942052007216 = 000000db`56acdd30
0:000> ? $t1

Evaluate expression: 9990 = 00000000`00002706
0:000> ? $t2

Evaluate expression: 10 = 00000000`0000000a
0:000> ? $t3

Evaluate expression: 9982 = 00000000`000026fe
0:000> ? $t4

Evaluate expression: 21464 = 00000000`000053d8
If we repeat the same script for device contexts (wType is 1) we get only 2 entries for our PID:
0:000> r $t0=000000db`56a500f0
0:000> r $t1=0
0:000> r $t2=1
0:000> r $t3=0
0:000> r $t4=0
0:000> .while (qwo(@$t0)) { .if (wo(@$t0+8) == @$tpid) {r $t1 = @$t1+1; .if (((qwo(@$t0+8) >> 0n48) & 7f) == @$t2) {r $t3 = @$t3+1} }; r $t0 = @$t0+3*8; r $t4 = @$t4+1}
0:000> ? $t3

Evaluate expression: 2 = 00000000`00000002
Of course, this script may be further improved, for example, to process all possible wType values and print their statistics. It can also be made as a textual WinDbg script procedure with arguments.
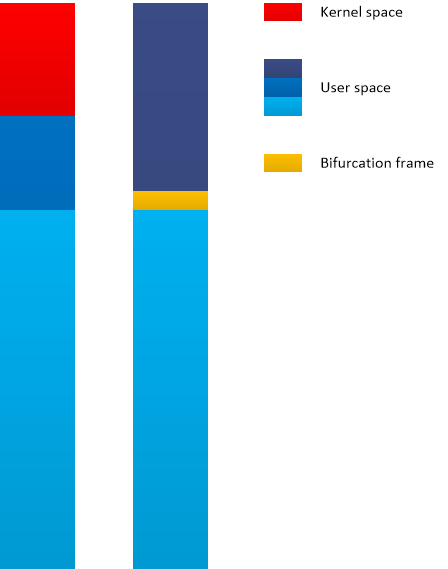
We rename the original pattern variant to Handle Limit (GDI, kernel space) and name this pattern variant as Handle Limit (GDI, user space).
- Dmitry Vostokov @ DumpAnalysis.org + TraceAnalysis.org -