Archive for the ‘Victimware’ Category
Sunday, May 1st, 2011
To model software behavior at application and system levels, test generative debugging scenarious and construct software defects using metaprogramming I started working on MdTL (Metadefect Template Library). Its consists of C++ templates for structural and behavioral patterns. The simplest examples include Threads<Spike> and Spike<Thread>. The template classes can be more complex, of course, utilizing the full power of C++, STL, and existing libraries like Boost. The unique and novel feature of this library is the inclusion of dual classes of behaviour such as Leak<>, Deadlock<>, Overflow<>, Residue<>, Exception<>, Contention<>, etc. parameterized by various structural memory classes like Process<>, Thread<>, Heap<>, Stack<>, Region<>, Buffer<>, etc. MdTL also includes classes to model software tracing and this will be used for simultaneous software trace and memory dump analysis case study in the forthcoming presentation. I also plan to extend this metaprogramming approach in the future to model malware analysis patterns by introducing Metamalware Template Library (MmTL).
Forthcoming parts will introduce template classes and examples.
- Dmitry Vostokov @ DumpAnalysis.org + TraceAnalysis.org -
Posted in C and C++, Crash Dump Patterns, Debugging, Generative Debugging, Malware Analysis, Malware Patterns, Metadefect Template Library, Metamalware, New Acronyms, Software Behavior Patterns, Software Defect Construction, Structural Memory Patterns, Structural Trace Patterns, Tools, Trace Analysis Patterns, Victimware | No Comments »
Sunday, April 17th, 2011
I’m pleased to announce that MDAA, Volume 5 is available in PDF format:
www.dumpanalysis.org/Memory+Dump+Analysis+Anthology+Volume+5
It features:
- 25 new crash dump analysis patterns
- 11 new pattern interaction case studies (including software tracing)
- 16 new trace analysis patterns
- 7 structural memory patterns
- 4 modeling case studies for memory dump analysis patterns
- Discussion of 3 common analysis mistakes
- Malware analysis case study
- Computer independent architecture of crash analysis report service
- Expanded coverage of software narratology
- Metaphysical and theological implications of memory dump worldview
- More pictures of memory space and physicalist art
- Classification of memory visualization tools
- Memory visualization case studies
- Close reading of the stories of Sherlock Holmes: Dr. Watson’s observational patterns
- Fully cross-referenced with Volume 1, Volume 2, Volume 3, and Volume 4
Its table of contents is available here:
www.dumpanalysis.org/MDAA/MDA-Anthology-V5-TOC.pdf
Paperback and hardcover versions should be available in a week or two. I also started working on Volume 6 that should be available in November-December.
- Dmitry Vostokov @ DumpAnalysis.org + TraceAnalysis.org -
Posted in Aesthetics of Memory Dumps, Analysis Notation, Announcements, AntiPatterns, Archaeology of Computer Memory, Art, Assembly Language, Best Practices, Books, C and C++, CDF Analysis Tips and Tricks, Categorical Debugging, Citrix, Common Mistakes, Common Questions, Complete Memory Dump Analysis, Computer Forensics, Computer Science, Crash Analysis Report Environment (CARE), Crash Dump Analysis, Crash Dump De-analysis, Crash Dump Patterns, Crash Dumps for Dummies, Cyber Warfare, Debugging, Debugging Bureau, Debugging Industry, Debugging Methodology, Debugging Slang, Debugging Trends, Deep Down C++, Dr. Watson, Dublin School of Security, Education and Research, Escalation Engineering, Fun with Crash Dumps, Fun with Debugging, Fun with Software Traces, General Memory Analysis, Hermeneutics of Memory Dumps and Traces, Images of Computer Memory, Kernel Development, Malware Analysis, Mathematics of Debugging, Memiotics (Memory Semiotics), Memory Analysis Forensics and Intelligence, Memory Diagrams, Memory Dump Analysis Services, Memory Dumps in Myths, Memory Space Art, Memory Systems Language, Memory Visualization, Memory and Glitches, Metaphysics of Memory Worldview, Multithreading, Music for Debugging, New Acronyms, New Debugging School, New Words, Pattern Models, Philosophy, Physicalist Art, Publishing, Reverse Engineering, Science of Memory Dump Analysis, Science of Software Tracing, Security, Software Architecture, Software Behavior Patterns, Software Chorography, Software Chorology, Software Defect Construction, Software Engineering, Software Generalist, Software Maintenance Institute, Software Narratology, Software Technical Support, Software Trace Analysis, Software Trace Reading, Software Trace Visualization, Software Tracing for Dummies, Software Troubleshooting Patterns, Software Victimology, Structural Memory Patterns, Structural Trace Patterns, Systems Thinking, Testing, The Way of Philip Marlowe, Tools, Trace Analysis Patterns, Training and Seminars, Troubleshooting Methodology, Victimware, Vista, Webinars, WinDbg Scripting Extensions, WinDbg Scripts, WinDbg Tips and Tricks, WinDbg for GDB Users, Windows 7, Windows Server 2008, Windows System Administration, Workaround Patterns, x64 Windows | No Comments »
Saturday, January 1st, 2011
With the new year starts the new initiative to integrate traditional multidisciplinary debugging approaches and methodologies with multiplatform pattern-driven software problem solving, unified debugging patterns, best practices in memory dump analysis and software tracing, computer security, economics, and the new emerging trends I’m going to write about during this year.
- Dmitry Vostokov @ DumpAnalysis.org + TraceAnalysis.org -
Posted in Announcements, Best Practices, Computer Forensics, Computer Science, Countefactual Debugging, Crash Analysis Report Environment (CARE), Crash Dump Analysis, Crash Dump Patterns, DebugWare Patterns, Debugging, Debugging Industry, Debugging Methodology, Debugging Trends, Dublin School of Security, Economics, Education and Research, Escalation Engineering, First Fault Problem Solving, Malware Analysis, Malware Patterns, Mathematics of Debugging, Memiotics (Memory Semiotics), Memoretics, Memory Analysis Forensics and Intelligence, Memory Analysis Report System, Memory Dump Analysis Services, Memory Systems Language, Memory Visualization, New Debugging School, Science of Memory Dump Analysis, Science of Software Tracing, Security, Software Behavior Patterns, Software Defect Construction, Software Engineering, Software Generalist, Software Maintenance Institute, Software Narratology, Software Trace Analysis, Software Trace Visualization, Software Tracing Implementation Patterns, Software Troubleshooting Patterns, Structural Memory Patterns, Structural Trace Patterns, Systems Thinking, Testing, Tool Objects, Tools, Trace Analysis Patterns, Training and Seminars, Troubleshooting Methodology, Unified Debugging Patterns, Victimware, Visual Dump Analysis, Webinars, Workaround Patterns | No Comments »
Saturday, December 25th, 2010
As a part of my efforts to unify malware and forensic analysis with memory dump and software trace analysis from behavioral and structural patterns perspective I created this domain name. The word victimware was borrowed and extended from its previous limited use:
Software Victimology (Part 1)
Software Victimology (Part 2)
- Dmitry Vostokov @ DumpAnalysis.org + TraceAnalysis.org -
Posted in Announcements, Computer Forensics, Malware Analysis, Memory Analysis Forensics and Intelligence, Victimware | No Comments »
Friday, December 24th, 2010
Borrowing routine activity theory (RAT) from criminology I would like to introduce the similar approach to abnormal software behavior with patterning activities that adds additional unmotivated offenders to combine malware (software rats) with unintentional ordinary common bugware:
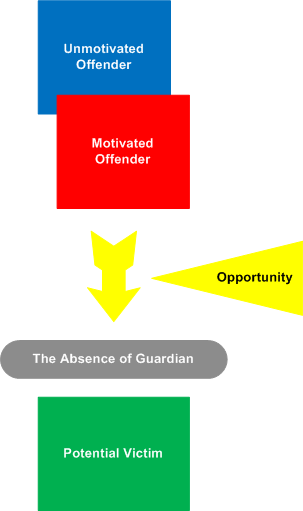
The application of RAT to software can be metaphorically named as Function Activity Theory (FAT).
- Dmitry Vostokov @ DumpAnalysis.org + TraceAnalysis.org -
Posted in Malware Analysis, Security, Software Behavior Patterns, Software Victimology, Structural Memory Patterns, Victimware | No Comments »
Friday, December 17th, 2010
As the new decade is approaching (2011-2020) we would like to make a few previews and predictions:
- Increased complexity of software will bring more methods from biological, social sciences and humanities in addition to existing methods of automated debugging and computer science techniques
- Focus on first fault software problem solving (when aspect)
- Focus on pattern-driven software problem solving (how aspect)
- Fusion of debugging and malware analysis into a unified structural and behavioral pattern framework
- Visual debugging, memory and software trace visualization techniques
- Software maintenance certification
- Focus on domain-driven troubleshooting and debugging tools as a service (debugware TaaS)
- Focus on security issues related to memory dumps and software traces
- New scripting languages and programming language extensions for debugging
- The maturation of the science of memory snapshots and software traces (memoretics)
Imagining is not not limited to the above and more to come and explain in the forthcoming parts.
- Dmitry Vostokov @ DumpAnalysis.org + TraceAnalysis.org -
Posted in Announcements, Anthropology, Archaeology of Computer Memory, Biology, Certification, Computer Science, Countefactual Debugging, Crash Analysis Report Environment (CARE), Crash Dump Analysis, Crash Dump Patterns, DebugWare Patterns, Debugging, Debugging Industry, Debugging Methodology, Debugging Trends, Dublin School of Security, EasyDbg, Economics, Escalation Engineering, Evolution, First Fault Problem Solving, Futuristic Memory Dump Analysis, General Memory Analysis, General Science, Geography, Hardware, Hermeneutics of Memory Dumps and Traces, History, Humanities, Language, Laws of Troubleshooting and Debugging, Logic, Malware Analysis, Malware Patterns, Mathematics of Debugging, Memiotics (Memory Semiotics), Memoretics, Memory Analysis Forensics and Intelligence, Memory Analysis Report System, Memory Dump Analysis and History, Memory Systems Language, Memory Visualization, Paleo-debugging, Pattern Models, Pattern Prediction, Physics, Psychology, Publishing, Science of Memory Dump Analysis, Science of Software Tracing, Security, Social Media, Social Sciences, Software Architecture, Software Behavior Patterns, Software Chorography, Software Chorology, Software Defect Construction, Software Engineering, Software Generalist, Software Maintenance Institute, Software Narrative Fiction, Software Narratology, Software Technical Support, Software Trace Analysis, Software Trace Analysis and History, Software Trace Deconstruction, Software Trace Linguistics, Software Trace Visualization, Software Troubleshooting Patterns, Software Victimology, Statistics, Structural Memory Analysis and Social Sciences, Structural Memory Patterns, Structural Trace Patterns, Systems Thinking, Testing, Tools, Trace Analysis Patterns, Troubleshooting Methodology, Unified Debugging Patterns, Uses of UML, Victimware, Virtualization, Visual Dump Analysis, Windows System Administration, Workaround Patterns | No Comments »
Friday, November 12th, 2010
Five volumes of cross-disciplinary Anthology (dubbed by the author “The Summa Memorianica”) lay the foundation of the scientific discipline of Memoretics (study of computer memory snapshots and their evolution in time) that is also called Memory Dump and Software Trace Analysis.ca
The 5th volume contains revised, edited, cross-referenced, and thematically organized selected DumpAnalysis.org blog posts about crash dump, software trace analysis and debugging written in February 2010 - October 2010 for software engineers developing and maintaining products on Windows platforms, quality assurance engineers testing software on Windows platforms, technical support and escalation engineers dealing with complex software issues, and security researchers, malware analysts and reverse engineers. The fifth volume features:
- 25 new crash dump analysis patterns
- 11 new pattern interaction case studies (including software tracing)
- 16 new trace analysis patterns
- 7 structural memory patterns
- 4 modeling case studies for memory dump analysis patterns
- Discussion of 3 common analysis mistakes
- Malware analysis case study
- Computer independent architecture of crash analysis report service
- Expanded coverage of software narratology
- Metaphysical and theological implications of memory dump worldview
- More pictures of memory space and physicalist art
- Classification of memory visualization tools
- Memory visualization case studies
- Close reading of the stories of Sherlock Holmes: Dr. Watson’s observational patterns
- Fully cross-referenced with Volume 1, Volume 2, Volume 3, and Volume 4
Product information:
- Title: Memory Dump Analysis Anthology, Volume 5
- Author: Dmitry Vostokov
- Language: English
- Product Dimensions: 22.86 x 15.24
- Paperback: 400 pages
- Publisher: Opentask (10 December 2010)
- ISBN-13: 978-1-906717-96-4
- Hardcover: 400 pages
- Publisher: Opentask (10 December 2010)
- ISBN-13: 978-1-906717-97-1

Back cover features memory space art image Hot Computation: Memory on Fire.
- Dmitry Vostokov @ DumpAnalysis.org + TraceAnalysis.org -
Posted in Aesthetics of Memory Dumps, Announcements, Archaeology of Computer Memory, Art, Assembly Language, Books, C and C++, CDF Analysis Tips and Tricks, Categorical Debugging, Common Mistakes, Complete Memory Dump Analysis, Computer Science, Crash Analysis Report Environment (CARE), Crash Dump Analysis, Crash Dump De-analysis, Crash Dump Patterns, Debugging, Debugging Methodology, Debugging Slang, Deep Down C++, Dr. Watson, Dublin School of Security, Education and Research, Escalation Engineering, Fun with Crash Dumps, Fun with Debugging, Fun with Software Traces, General Memory Analysis, Hermeneutics of Memory Dumps and Traces, Images of Computer Memory, Kernel Development, Malware Analysis, Malware Patterns, Mathematics of Debugging, Memiotics (Memory Semiotics), Memoidealism, Memoretics, Memory Analysis Culture, Memory Analysis Forensics and Intelligence, Memory Analysis Report System, Memory Diagrams, Memory Dreams, Memory Dump Analysis Jobs, Memory Dump Analysis Services, Memory Dump Analysis and History, Memory Dumps in Movies, Memory Dumps in Myths, Memory Religion (Memorianity), Memory Space Art, Memory Systems Language, Memory Visualization, Memory and Glitches, Memuonics, Metaphysical Society of Ireland, Minidump Analysis, Movies and Debugging, Multithreading, Museum of Debugging, Music for Debugging, Music of Computation, New Acronyms, New Words, Paleo-debugging, Pattern Models, Pattern Prediction, Philosophy, Physicalist Art, Psychoanalysis of Software Maintenance and Support, Publishing, Science of Memory Dump Analysis, Science of Software Tracing, Security, Software Architecture, Software Behavior Patterns, Software Chorography, Software Chorology, Software Defect Construction, Software Engineering, Software Generalist, Software Maintenance Institute, Software Narratology, Software Technical Support, Software Trace Analysis, Software Trace Analysis and History, Software Trace Deconstruction, Software Trace Reading, Software Trace Visualization, Software Tracing for Dummies, Software Troubleshooting Patterns, Software Victimology, Stack Trace Collection, Structural Memory Analysis and Social Sciences, Structural Memory Patterns, Structural Trace Patterns, Systems Thinking, Testing, Theology, Tool Objects, Tools, Trace Analysis Patterns, Training and Seminars, Troubleshooting Methodology, Uses of UML, Victimware, Virtualization, Vista, Visual Dump Analysis, Webinars, WinDbg Scripts, WinDbg Tips and Tricks, WinDbg for GDB Users, Windows 7, Windows Server 2008, Windows System Administration, Workaround Patterns, x64 Windows | No Comments »
Saturday, November 6th, 2010
I’m pleased to announce that MDAA, Volume 4 is available in PDF format:
www.dumpanalysis.org/Memory+Dump+Analysis+Anthology+Volume+4
It features:
- 15 new crash dump analysis patterns
- 13 new pattern interaction case studies
- 10 new trace analysis patterns
- 6 new Debugware patterns and case study
- Workaround patterns
- Updated checklist
- Fully cross-referenced with Volume 1, Volume 2 and Volume 3
- Memory visualization tutorials
- Memory space art
Its table of contents is available here:
http://www.dumpanalysis.org/MDAA/MDA-Anthology-V4-TOC.pdf
Paperback and hardcover versions should be available in a week or two. I also started working on Volume 5 that should be available in December.
- Dmitry Vostokov @ DumpAnalysis.org + TraceAnalysis.org -
Posted in .NET Debugging, Aesthetics of Memory Dumps, Announcements, AntiPatterns, Art, Assembly Language, Books, C and C++, CDF Analysis Tips and Tricks, Categorical Debugging, Common Mistakes, Complete Memory Dump Analysis, Computer Science, Countefactual Debugging, Crash Dump Analysis, Crash Dump Patterns, DebugWare Patterns, Debugging, Debugging Slang, Deep Down C++, Education and Research, Escalation Engineering, Fun with Crash Dumps, Fun with Debugging, Images of Computer Memory, Kernel Development, Memiotics (Memory Semiotics), Memoidealism, Memoretics, Memory Space Art, Memory Visualization, Memuonics, Metaphysics of Memory Worldview, Multithreading, Opcodism, Philosophy, Physicalist Art, Publishing, Science Fiction, Science of Memory Dump Analysis, Science of Software Tracing, Security, Software Architecture, Software Behavior Patterns, Software Defect Construction, Software Engineering, Software Narratology, Software Technical Support, Software Trace Analysis, Software Trace Reading, Software Victimology, Stack Trace Collection, Testing, Tools, Trace Analysis Patterns, Troubleshooting Methodology, Uses of UML, Victimware, Virtualization, Vista, Visual Dump Analysis, WinDbg Scripts, WinDbg Tips and Tricks, Windows 7, Windows Server 2008, Windows System Administration, Workaround Patterns, x64 Windows | No Comments »
Friday, October 22nd, 2010
I detour for MARS expedition. You may also call it Memory Analysis Report System as malware analysis is always exploration of memory (in general). Why is this sudden change of course? After reading Gilles Deleuze I want to broaden the concept of “malware” and give it new orientation and direction of thinking. Beside that I also want new challenges after many years of research in pattern-driven memory dump and software trace analysis of abnormal software behaviour.
You may have also noticed small restructuring (rebranding) of this blog and DumpAnalysis.org headers.
See you there 
- Dmitry Vostokov @ DumpAnalysis.org + TraceAnalysis.org -
Posted in Announcements, Archaeology of Computer Memory, Assembly Language, Computer Science, Education and Research, General Memory Analysis, Malware Analysis, Malware Patterns, Memiotics (Memory Semiotics), Memoretics, Memory Analysis Forensics and Intelligence, Memory Analysis Report System, Memory Dump Analysis Services, New Acronyms, Philosophy, Science of Memory Dump Analysis, Science of Software Tracing, Security, Software Trace Analysis, Software Victimology, Structural Memory Patterns, Systems Thinking, Tools, Trace Analysis Patterns, Victimware, Windows System Administration | No Comments »
Wednesday, October 20th, 2010
As a practical example of applying behavioral and structural pattern analysis of computer memory and traces OpenTask plans to publish the following title next year:
- Title: Malware Patterns: Structure and Behavior of Computer Adware, Crimeware, Rootkits, Scareware, Spyware, Trojans, Viruses, Victimware and Worms
- Author: Dmitry Vostokov
- Paperback: 1200 pages
- Publisher: OpenTask (October 2011)
- ISBN-13: 978-1-908043-01-6
The inclusion of victimware is necessary because of the effects of defective malware.
- Dmitry Vostokov @ DumpAnalysis.org + TraceAnalysis.org -
Posted in Announcements, Books, Crash Dump Analysis, Crash Dump Patterns, Malware Analysis, Malware Patterns, Memiotics (Memory Semiotics), Memoretics, Memory Analysis Forensics and Intelligence, Publishing, Science of Memory Dump Analysis, Science of Software Tracing, Security, Software Behavior Patterns, Software Defect Construction, Software Trace Analysis, Software Victimology, Structural Memory Patterns, Trace Analysis Patterns, Victimware | No Comments »
Monday, October 18th, 2010
One of my home computers got infected. I confess that I don’t have an antivirus because I’m conscious while browsing Internet (the last infected machine I had was an MSDOS one) so perhaps one of my family members was less careful. I paid attention to the possible infection when IE started crashing when I was pushing a login button on one of online banking websites. However I didn’t pay enough attention because it was a heap corruption (see my previous case study) and simply switched to another non-crashing browser vendor such as Apple Safari. Since then IE was crashing periodically when I was pushing various admin buttons in WordPress but I didn’t pay much attention too because it was still heap corruption and I was thinking it was a script processing defect, waiting for a new IE update. Until one day explorer.exe crashed as well when I was entering a password for an ftp account. Here’s the stack trace that I got after opening a crash dump in WinDbg:
0:030> kL 100

ChildEBP RetAddr

0663e9c4 76f05610 ntdll!KiFastSystemCallRet

0663e9c8 7706a5d7 ntdll!NtWaitForMultipleObjects+0xc

0663ea64 7706a6f0 kernel32!WaitForMultipleObjectsEx+0×11d

0663ea80 770de2a5 kernel32!WaitForMultipleObjects+0×18

0663eaec 770de4d1 kernel32!WerpReportFaultInternal+0×16d

0663eb00 770bff4d kernel32!WerpReportFault+0×70

0663eb8c 76f17fc1 kernel32!UnhandledExceptionFilter+0×1b5

0663eb94 76ea9bdc ntdll!__RtlUserThreadStart+0×6f

0663eba8 76ea4067 ntdll!_EH4_CallFilterFunc+0×12

0663ebd0 76f05f79 ntdll!_except_handler4+0×8e

0663ebf4 76f05f4b ntdll!ExecuteHandler2+0×26

0663eca4 76f05dd7 ntdll!ExecuteHandler+0×24

0663eca4 93181a08 ntdll!KiUserExceptionDispatcher+0xf

WARNING: Frame IP not in any known module. Following frames may be wrong.

0663efa0 0321aaaf 0×93181a08

0663efac 6b887974 0×321aaaf

0663efbc 6b8973ad msieftp!InternetCloseHandleWrap+0×10

0663f810 6b897fbf msieftp!CFtpSite::_QueryServerFeatures+0×57

0663fa50 6b8981ae msieftp!CFtpSite::_LoginToTheServer+0×235

0663fa94 6b88b39e msieftp!CFtpSite::GetHint+0xe8

0663fab4 6b88b412 msieftp!CFtpDir::GetHint+0×1f

0663fae4 6b88ed38 msieftp!CFtpDir::WithHint+0×49

0663fb10 6b88eda4 msieftp!CFtpEidl::_Init+0×6e

0663fb2c 7584ecb4 msieftp!CFtpEidl::Next+0×41

0663fb64 7584f63b shell32!CEnumThread::_EnumFolder+0×65

0663fb80 7584f5ba shell32!CEnumThread::_RunEnum+0×6f

0663fb8c 7645c2c9 shell32!CEnumThread::s_EnumThreadProc+0×14

0663fc10 7706d0e9 shlwapi!WrapperThreadProc+0×11c

0663fc1c 76ee19bb kernel32!BaseThreadInitThunk+0xe

0663fc5c 76ee198e ntdll!__RtlUserThreadStart+0×23

0663fc74 00000000 ntdll!_RtlUserThreadStart+0×1b
Notice 0×321aaaf address. We see that wininet function was hooked by a code running in 0×0321XXXX range:
0:030> ub 6b887974

msieftp!InternetOpenWrap+0×46:

6b887963 cc              int     3

msieftp!InternetCloseHandleWrap:

6b887964 8bff            mov     edi,edi

6b887966 55              push    ebp

6b887967 8bec            mov     ebp,esp

6b887969 56              push    esi

6b88796a ff7508          push    dword ptr [ebp+8]

6b88796d 33f6            xor     esi,esi

6b88796f e82e610100      call    msieftp!InternetCloseHandle (6b89daa2)
0:030> u 6b89daa2

msieftp!InternetCloseHandle:

6b89daa2 ff2500278a6b    jmp     dword ptr [msieftp!_imp__InternetCloseHandle (6b8a2700)]

msieftp!_imp_load__InternetConnectW:

6b89daa8 b834278a6b      mov     eax,offset msieftp!_imp__InternetConnectW (6b8a2734)

6b89daad e9b4feffff      jmp     msieftp!_tailMerge_WININET_dll (6b89d966)

6b89dab2 cc              int     3

6b89dab3 cc              int     3

6b89dab4 cc              int     3

6b89dab5 cc              int     3

6b89dab6 cc              int     3
0:030> dp 6b8a2700 l1

6b8a2700  76dc9088
0:030> u 76dc9088

wininet!InternetCloseHandle:

76dc9088 e9031a458c      jmp     0321aa90

76dc908d 51              push    ecx

76dc908e 51              push    ecx

76dc908f 53              push    ebx

76dc9090 56              push    esi

76dc9091 57              push    edi

76dc9092 33db            xor     ebx,ebx

76dc9094 33ff            xor     edi,edi
0:030> u 0321aa90

0321aa90 55              push    ebp

0321aa91 8bec            mov     ebp,esp

0321aa93 837d0800        cmp     dword ptr [ebp+8],0

0321aa97 740c            je      0321aaa5

0321aa99 8b4508          mov     eax,dword ptr [ebp+8]

0321aa9c 50              push    eax

0321aa9d e82eedffff      call    032197d0

0321aaa2 83c404          add     esp,4
This address range was not on a loaded module list so I used image scanning command to detect Hidden Module:
0:030> .imgscan

MZ at 00080000, prot 00000002, type 01000000 - size 2cd000

Name: explorer.exe

MZ at 003d0000, prot 00000002, type 00040000 - size 2000

MZ at 018a0000, prot 00000008, type 00040000 - size 7000

MZ at 031c0000, prot 00000008, type 00040000 - size 3000

MZ at 031d0000, prot 00000002, type 01000000 - size c000

Name: DLAAPI_W.DLL

MZ at 03210000, prot 00000040, type 00020000 - size 1d000

[…]
!dh command was not showing any useful hints so I dumped the whole address range of that Unknown Component and found strange strings inside:
0:030> db 03210000 03210000+1d000

[...]

032246d0  2a 00 00 00 2a 00 00 00-42 6c 61 63 6b 77 6f 6f  *...*...Blackwoo

032246e0  64 50 52 4f 00 00 00 00-46 69 6e 61 6d 44 69 72  dPRO....FinamDir

032246f0  65 63 74 00 47 72 61 79-42 6f 78 00 4d 62 74 50  ect.GrayBox.MbtP

03224700  52 4f 00 00 4c 61 73 65-72 00 00 00 4c 69 67 68  RO..Laser...Ligh

03224710  74 53 70 65 65 64 00 00-4c 54 47 72 6f 75 70 00  tSpeed..LTGroup.

03224720  4d 62 74 00 53 63 6f 74-54 72 61 64 65 72 00 00  Mbt.ScotTrader..

03224730  53 61 78 6f 54 72 61 64-65 72 00 00 00 00 00 00  SaxoTrader......

03224740  50 72 6f 67 72 61 6d 3a-20 20 20 25 73 0d 0a 55  Program:   %s..U

03224750  73 65 72 6e 61 6d 65 3a-20 20 25 73 0d 0a 50 61  sername:  %s..Pa

03224760  73 73 77 6f 72 64 3a 20-20 25 73 0d 0a 41 63 63  ssword:  %s..Acc

03224770  6f 75 6e 74 4e 4f 3a 20-25 73 0d 0a 53 65 72 76  ountNO: %s..Serv

03224780  65 72 3a 20 20 20 20 25-73 0d 0a 00 5c 00 00 00  er:    %s...\...

03224790  25 73 20 25 73 00 00 00-25 73 00 00 50 52 4f 43  %s %s...%s..PROC

032247a0  45 53 53 4f 52 5f 49 44-45 4e 54 49 46 49 45 52  ESSOR_IDENTIFIER

032247b0  00 00 00 00 25 64 00 00-25 30 32 58 00 00 00 00  ....%d..%02X....

032247c0  30 00 00 00 2c 00 00 00-25 30 32 58 00 00 00 00  0...,...%02X....

[...]

03225000  01 01 00 00 5c 00 63 00-68 00 6b 00 6e 00 74 00  ....\.c.h.k.n.t.

03225010  66 00 73 00 2e 00 65 00-78 00 65 00 00 00 00 00  f.s...e.x.e.....

03225020  5c 00 63 00 68 00 6b 00-6e 00 74 00 66 00 73 00  \.c.h.k.n.t.f.s.

03225030  2e 00 64 00 61 00 74 00-00 00 00 00 a6 b7 04 5e  ..d.a.t........^

[...]
I didn’t pay attention to chkntfs.exe but did a search for SaxoTrader string in all files using findstr command and found chkntfs.exe as a system file in Start Menu \ Programs \ Startup folder in roaming user AppData. I couldn’t remove it so I had to boot in command line mode to do that. The crashes were gone since that. I double checked various iexplore.exe crash dumps saved previously and found the same module loaded, for example:
0:005> .imgscan

MZ at 00040000, prot 00000040, type 00020000 - size 1d000

MZ at 00340000, prot 00000002, type 01000000 - size 9c000

Name: iexplore.exe

[…]
Here we consider IE and Explorer as victimware of malware.
- Dmitry Vostokov @ DumpAnalysis.org + TraceAnalysis.org -
Posted in Crash Dump Analysis, Crash Dump Patterns, Malware Analysis, Memory Analysis Forensics and Intelligence, Security, Victimware, Victimware Analysis | 2 Comments »
Sunday, April 18th, 2010
OpenTask to offer first 3 volumes of Memory Dump Analysis Anthology in one set:


The set is available exclusively from OpenTask e-Commerce web site starting from June. Individual volumes are also available from Amazon, Barnes & Noble and other bookstores worldwide.
Product information:
- Title: Modern Memory Dump and Software Trace Analysis: Volumes 1-3
- Author: Dmitry Vostokov
- Language: English
- Product Dimensions: 22.86 x 15.24
- Paperback: 1600 pages
- Publisher: Opentask (31 May 2010)
- ISBN-13: 978-1-906717-99-5
Information about individual volumes:
- Dmitry Vostokov @ DumpAnalysis.org + TraceAnalysis.org -
Posted in .NET Debugging, Aesthetics of Memory Dumps, Announcements, AntiPatterns, Art, Assembly Language, Books, Bugchecks Depicted, C and C++, CDA Pattern Classification, CDF Analysis Tips and Tricks, Categorical Debugging, Certification, Citrix, Code Reading, Common Mistakes, Computational Ghosts and Bug Hauntings, Computer Science, Countefactual Debugging, Crash Analysis Report Environment (CARE), Crash Dump Analysis, Crash Dump Patterns, Crash Dumps for Dummies, Data Recovery, DebugWare Patterns, Debugging, Debugging Methodology, Debugging Slang, Deep Down C++, Dictionary of Debugging, Dr. Watson, Education and Research, Escalation Engineering, Fun with Crash Dumps, Futuristic Memory Dump Analysis, GDB for WinDbg Users, Hardware, History, Horrors of Computation, Hyper-V, Intelligent Memory Movement, Kernel Development, Laws of Troubleshooting and Debugging, Mathematics of Debugging, Memiotics (Memory Semiotics), Memoidealism, Memoretics, Memory Analysis Culture, Memory Analysis Forensics and Intelligence, Memory Auralization, Memory Dump Analysis Jobs, Memory Religion (Memorianity), Memory Space Art, Memory Space Music, Memory Systems Language, Memory Visualization, Memuonics, Minidump Analysis, Multithreading, Music for Debugging, Music of Computation, New Acronyms, New Words, Occult Debugging, Philosophy, Psi-computation, Publishing, Science of Memory Dump Analysis, Science of Software Tracing, Security, Software Architecture, Software Defect Construction, Software Engineering, Software Generalist, Software Maintenance Institute, Software Narratology, Software Technical Support, Software Trace Analysis, Software Trace Visualization, Software Tracing for Dummies, Software Victimology, Stack Trace Collection, Testing, Tools, Trace Analysis Patterns, Training and Seminars, Troubleshooting Methodology, Victimware, Virtualization, Vista, Visual Dump Analysis, WinDbg Scripts, WinDbg Tips and Tricks, WinDbg for GDB Users, Windows 7, Windows Server 2008, Windows System Administration | No Comments »
Friday, April 9th, 2010
Plan to start providing training and seminars in my free time. If you are interested please answer these questions (you can either respond here in comments or use this form for private communication http://www.dumpanalysis.org/contact):
- Are you interested in on-site training, prefer traveling or attending webinars?
- Are you interested in software trace analysis as well?
- What specific topics are you interested in?
- What training level (beginner, intermediate, advanced) are you interested in? (please provide an example, if possible)
Additional topics of expertise that can be integrated into training include Source Code Reading and Analysis, Debugging, Windows Architecture, Device Drivers, Troubleshooting Tools Design and Implementation, Multithreading, Deep Down C and C++, x86 and x64 Assembly Language Reading.
Looking forward to your responses. Any suggestions are welcome.
- Dmitry Vostokov @ DumpAnalysis.org + TraceAnalysis.org -
Posted in .NET Debugging, Announcements, AntiPatterns, Assembly Language, Bugchecks Depicted, C and C++, CDA Pattern Classification, CDF Analysis Tips and Tricks, Certification, Code Reading, Common Mistakes, Crash Analysis Report Environment (CARE), Crash Dump Analysis, Crash Dump Patterns, Crash Dumps for Dummies, Data Recovery, DebugWare Patterns, Debugging, Debugging Methodology, Deep Down C++, Education and Research, Escalation Engineering, FreeBSD Crash Corner, GDB for WinDbg Users, Hardware, Hyper-V, Java Debugging, Kernel Development, Laws of Troubleshooting and Debugging, Linux Crash Corner, Mac Crash Corner, Memory Analysis Forensics and Intelligence, Memory Visualization, Minidump Analysis, Multithreading, Security, Software Architecture, Software Defect Construction, Software Engineering, Software Generalist, Software Maintenance Institute, Software Narratology, Software Technical Support, Software Trace Analysis, Software Trace Visualization, Software Tracing for Dummies, Software Victimology, Stack Trace Collection, Testing, Tools, Trace Analysis Patterns, Training and Seminars, Troubleshooting Methodology, Victimware, Virtualization, Vista, Visual Dump Analysis, WinDbg Scripts, WinDbg Tips and Tricks, WinDbg for GDB Users, Windows 7, Windows Server 2008, Windows System Administration, Workaround Patterns | No Comments »
Thursday, February 11th, 2010
This is a revised, edited, cross-referenced and thematically organized volume of selected DumpAnalysis.org blog posts about crash dump analysis and debugging written in July 2009 - January 2010 for software engineers developing and maintaining products on Windows platforms, quality assurance engineers testing software on Windows platforms and technical support and escalation engineers dealing with complex software issues. The fourth volume features:
- 13 new crash dump analysis patterns
- 13 new pattern interaction case studies
- 10 new trace analysis patterns
- 6 new Debugware patterns and case study
- Workaround patterns
- Updated checklist
- Fully cross-referenced with Volume 1, Volume 2 and Volume 3
- New appendixes
Product information:
- Title: Memory Dump Analysis Anthology, Volume 4
- Author: Dmitry Vostokov
- Language: English
- Product Dimensions: 22.86 x 15.24
- Paperback: 410 pages
- Publisher: Opentask (30 March 2010)
- ISBN-13: 978-1-906717-86-5
- Hardcover: 410 pages
- Publisher: Opentask (30 April 2010)
- ISBN-13: 978-1-906717-87-2

Back cover features memory space art image: Internal Process Combustion.
- Dmitry Vostokov @ DumpAnalysis.org + TraceAnalysis.org -
Posted in .NET Debugging, Aesthetics of Memory Dumps, Announcements, AntiPatterns, Art, Assembly Language, Books, C and C++, CDA Pattern Classification, CDF Analysis Tips and Tricks, Categorical Debugging, Certification, Citrix, Code Reading, Common Mistakes, Computer Science, Countefactual Debugging, Crash Analysis Report Environment (CARE), Crash Dump Analysis, Crash Dump Patterns, Crash Dumps for Dummies, DebugWare Patterns, Debugging, Debugging Slang, Education and Research, Escalation Engineering, Fun with Crash Dumps, Games for Debugging, Hardware, Horrors of Computation, Hyper-V, Kernel Development, Laws of Troubleshooting and Debugging, Mathematics of Debugging, Memiotics (Memory Semiotics), Memoidealism, Memoretics, Memory Analysis Culture, Memory Analysis Forensics and Intelligence, Memory Dreams, Memory Dump Analysis Jobs, Memory Dumps in Movies, Memory Space Art, Memory Visualization, Memuonics, Minidump Analysis, Multithreading, Music for Debugging, New Acronyms, New Words, Opcodism, Philosophy, Physicalist Art, Publishing, Science Fiction, Science of Memory Dump Analysis, Science of Software Tracing, Security, Software Architecture, Software Defect Construction, Software Engineering, Software Generalist, Software Maintenance Institute, Software Narratology, Software Technical Support, Software Trace Analysis, Software Trace Visualization, Software Tracing for Dummies, Software Victimology, Stack Trace Collection, Testing, Tools, Trace Analysis Patterns, Training and Seminars, Troubleshooting Methodology, Victimware, Virtualization, Vista, Visual Dump Analysis, WinDbg Scripts, WinDbg Tips and Tricks, WinDbg for GDB Users, Windows 7, Windows Server 2008, Windows System Administration, Workaround Patterns | No Comments »
Sunday, December 20th, 2009
“Memory dumps are facts.”
I’m very excited to announce that Volume 3 is available in paperback, hardcover and digital editions:
Memory Dump Analysis Anthology, Volume 3
Table of Contents
In two weeks paperback edition should also appear on Amazon and other bookstores. Amazon hardcover edition is planned to be available in January 2010.
The amount of information was so voluminous that I had to split the originally planned volume into two. Volume 4 should appear by the middle of February together with Color Supplement for Volumes 1-4.
- Dmitry Vostokov @ DumpAnalysis.org -
Posted in .NET Debugging, Aesthetics of Memory Dumps, Announcements, AntiPatterns, Art, Assembly Language, Books, Bugtations, C and C++, CDA Pattern Classification, CDF Analysis Tips and Tricks, Certification, Citrix, Code Reading, Common Mistakes, Computer Science, Crash Dump Analysis, Crash Dump Patterns, Crash Dumps for Dummies, DebugWare Patterns, Debugging, Debugging Slang, Deep Down C++, Education and Research, Escalation Engineering, Fun with Crash Dumps, Hardware, Horrors of Computation, Kernel Development, Mathematics of Debugging, Memiotics (Memory Semiotics), Memoidealism, Memoretics, Memory Analysis Culture, Memory Analysis Forensics and Intelligence, Memory Space Art, Memory Visualization, Minidump Analysis, Multithreading, Philosophy, Poetry, Publishing, Science of Memory Dump Analysis, Science of Software Tracing, Security, Software Architecture, Software Defect Construction, Software Engineering, Software Narratology, Software Technical Support, Software Trace Analysis, Software Trace Visualization, Software Tracing for Dummies, Software Victimology, Stack Trace Collection, Testing, Tools, Trace Analysis Patterns, Training and Seminars, Troubleshooting Methodology, Victimware, Virtualization, Vista, Visual Dump Analysis, WinDbg Scripts, WinDbg Tips and Tricks, WinDbg for GDB Users, Windows 7, Windows Server 2008, Windows System Administration | 1 Comment »
Friday, October 23rd, 2009
What prompted me to found this discipline (that is supposed to be a sister discipline of software criminology, software security, secure code construction and software defect construction) is understanding that some software components are innocent victims of other component coding mistakes or deliberate subversion and some start as a part of crimeware but eventually become victims themselves (they crash, hang, spike, leak, are dumped, subverted, etc.). I would also like to borrow and reuse the neglected term victimware here in a broad sense. More on this later as I have to switch to software trace analysis patterns.
- Dmitry Vostokov @ DumpAnalysis.org -
Posted in Code Reading, Crash Dump Analysis, Debugging, Memory Analysis Forensics and Intelligence, Security, Software Defect Construction, Software Engineering, Software Trace Analysis, Software Victimology, Victimware | 1 Comment »