Archive for the ‘Software Trace Analysis’ Category
Tuesday, September 1st, 2009
Recently I came upon two software traces from working and non-working software environments that were a perfect example of Bifurcation Point pattern (the name is borrowed from catastrophe theory):
Working (issue is absent):
#   PID  TID  Message

[…]

25  2768 3056 Trace Statement A

26  3756 2600 Trace Statement B

27  3756 2600 Trace Statement C

[…]

149 3756  836 Trace Statement X (Query result: XXX)

150 3756  836 Trace Statement 150.1

151 3756  836 Trace Statement 151.1

152 3756  836 Trace Statement 152.1

153 3756  836 Trace Statement 153.1

[…]
Non-working (issue is present):
#   PID  TID  Message

[…]

27  2768 3056 Trace Statement A

28  3756 2176 Trace Statement B

29  3756 2176 Trace Statement C

[…]

151 3756 5940 Trace Statement Y (Query result: YYY)

152 3756 5940 Trace Statement 152.2

153 3756 5940 Trace Statement 153.2

154 3756 5940 Trace Statement 154.2

155 3756 5940 Trace Statement 155.2

[…]
First, we notice that in both traces PID are the same (2768 and 3756) and we can conclude that most likely both traces came from the same environment and session. Second, messages A, B, C and further are identical up to messages X and Y. The latter two messages differ greatly in their query results XXX and YYY. After that, message distribution differs greatly in both size and content. Despite the same tracing time, 15 seconds, statement current is 155 msg/s for working and 388 msg/s for non-working case.
Bifurcation points are easily observed when tracing noise ratio is small and, for example, in the case of Citrix terminal services environments, could be achieved by selecting appropriate tracing modules based on problem description or filtering irrelevant ones from full CDF traces.
- Dmitry Vostokov @ TraceAnalysis.org -
Posted in CDF Analysis Tips and Tricks, Citrix, Debugging, Software Trace Analysis, Trace Analysis Patterns | 1 Comment »
Tuesday, August 18th, 2009
Finally, the front cover has materialized for this issue of Debugged! magazine:
Debugged! MZ/PE: Software Tracing (ISBN: 978-1906717797)
If you have an article idea or if you’d like to write an article for us please use the following contact form:
http://www.dumpanalysis.org/contact
The deadline for this issue is 25th of September.
- Dmitry Vostokov @ DumpAnalysis.org -
Posted in Announcements, Crash Dump Analysis, Debugged! MZ/PE, Debugging, Publishing, Software Technical Support, Software Trace Analysis, Trace Analysis Patterns | 1 Comment »
Monday, August 10th, 2009
I’m very delighted to be a Dr. DebugLove! There are many Dr. Debug out there (Google shows 1,840,000 hits) but do they really love debugging like I do? Of course, they do, but I’m the first to acknowledge my strange love publicly by accepting a pseudonym.
- Dmitry Vostokov @ DumpAnalysis.org -
Posted in Announcements, Citrix, Crash Dump Analysis, Debugging, Fun with Crash Dumps, Fun with Debugging, Software Technical Support, Software Trace Analysis | No Comments »
Sunday, August 9th, 2009
Last week I was comparing the existing collection of memory dump analysis patterns to the collection of trace analysis patterns (in formation) in the search of isomorphism (or more correctly, general morphism) similar to Missing Component pattern. It is not a coincidence that such pattern pairs can be formed. For example, it is possible to discern deadlocks from both crash dumps and software traces (if appropriate information is available there). Fundamentally, it is implied by the definition of a software trace as some sort of a memory dump. And we can see traces in memory dumps too, for example, Execution Residue pattern. Because raw stack data resides in stack pages and in contemporary operating systems they are created from zero pages (metaphorically, out of the void) we can say that stack regions of threads are sorted by their creation time, for example, in this process user memory dump:
0:017> !runaway 4

 Elapsed Time

  Thread       Time

   0:49c       0 days 5:16:31.076

   4:4d8       0 days 5:16:30.967

   3:4d0       0 days 5:16:30.967

   2:4cc       0 days 5:16:30.967

   1:4c8       0 days 5:16:30.967

   5:4e8       0 days 5:16:30.936

   6:b6c       0 days 5:16:15.695

   7:b70       0 days 5:16:15.679

   9:b88       0 days 5:16:15.586

   8:b84       0 days 5:16:15.586

  11:348       0 days 5:16:12.934

  10:bfc       0 days 5:16:12.934

  12:1200      0 days 5:15:16.528

  15:1298      0 days 5:15:15.220

  14:1290      0 days 5:15:15.220

  13:128c      0 days 5:15:15.220

  17:12e4      0 days 5:15:13.257

  16:12dc      0 days 5:15:13.257

  18:12ec      0 days 5:15:13.117

  20:12f4      0 days 5:15:13.085

  19:12f0      0 days 5:15:13.085

  21:17a0      0 days 5:13:16.321

  22:1628      0 days 5:13:15.729

  24:1778      0 days 1:35:50.773

  23:17ec      0 days 1:35:50.773

  25:1570      0 days 1:27:54.190

  26:1724      0 days 1:27:10.151

  27:1490      0 days 0:05:46.732

  28:1950      0 days 0:02:28.153

  29:19b4      0 days 0:00:58.108

  30:177c      0 days 0:00:38.358

  31:1798      0 days 0:00:23.351

  32:1a7c      0 days 0:00:08.343
If we have complete memory dumps we can also account for other processes and their elapsed time. Within stack pages we have partial stack traces but do not have exact timing information between them except for stack frames from the current frozen thread stack trace or, if we are lucky, from a partial stack trace from the past execution. However, the timing between frames from different stacks is undefined and we can only guess it from higher level considerations like semantics of procedure calls and other information.
These considerations and the notion of a poset (partially ordered set) let me thinking about memory dumps as posets. I even created my interpretation of POSET abbreviation for this occasion:
POSET
Partially Ordered Software Execution Trace
- Dmitry Vostokov @ DumpAnalysis.org -
Posted in Crash Dump Analysis, Crash Dump Patterns, Debugging, Mathematics of Debugging, New Acronyms, Science of Memory Dump Analysis, Science of Software Tracing, Software Trace Analysis | No Comments »
Thursday, August 6th, 2009
There is an obvious pattern called Missing Component. We don’t see trace statements we expect and wonder whether the component was not loaded, its container ceased to exist or simply it wasn’t selected for tracing. In many support cases there is a trade-off between tracing everything and the size of trace files. Customers and engineers usually prefer smaller files to analyze. However in the case of predictable and reproducible issues with short duration we can always select all components or deselect a few (instead of selecting a few). Here is the article for Citrix CDF tracing best practices and it can be applied to other software traces as well:
Tracing Best Practices
We can find an example from Discontinuity pattern where the possibility of a sudden and silent gap in trace statements could happen because not all necessary components were selected for tracing.
Sometimes, in cases when the missing component was selected for tracing but we don’t see any trace output from it other module traces can give us an indication, perhaps showing the load failure message. For example, Process Monitor tracing done in parallel can reveal load failures.
- Dmitry Vostokov @ TraceAnalysis.org -
Posted in CDF Analysis Tips and Tricks, Citrix, Debugging, Software Trace Analysis, Trace Analysis Patterns | 4 Comments »
Tuesday, August 4th, 2009
Sometimes there are reported delays in application startup, session initialization, long response times and simply the absence of response. All these problems can be reflected in software traces showing sudden gaps in threads of activity. I call this pattern Discontinuity per analogy with continuous and discontinuous functions in mathematics. Here is an example I came upon recently and it will be covered fully in the forthcoming pattern cooperation case study spanning both memory dump and trace analysis. One process was reported to have a long period of CPU spiking calculation and a CDF trace was recorded. When we open it we see this periodic error:
N   PID  TID  Time         Message

[…]

326 2592 5476 08:17:18.823 OpenRegistry: Attempting to open [… Hive path …]

327 2592 5476 08:17:18.824 OpenRegistry: Failed: 2

[…]
However when looking for any discontinuities for the thread 5476 we see this gap of more than 7 minutes:
N    PID  TID  Time         Message

[...]

3395 2592 5476 08:17:19.608 OpenRegistry: Attempting to open [... Hive path ...]

3396 2592 5476 08:17:19.608 OpenRegistry: Failed: 2

3461 2592 5476 08:24:31.137 OpenRegistry: Attempting to open [… Hive path …]

3462 2592 5476 08:24:31.137 OpenRegistry: Failed: 2

[…]
Therefore we have 3 possibilities here:
1. The process twice did lengthy CPU spiking calculations involving registry access and was quiet between them.
2. Registry access belonged to some background activity and ceased for 7 minutes and during that time it had CPU spiking intensive calculation.
3. This discontinuity is irrelevant because either the calculation module was not selected for tracing or it simply doesn’t have relevant tracing statement coverage for the code that does calculation.
Stay tuned because this story will be unfolded in other patterns and in the final case study.
- Dmitry Vostokov @ TraceAnalysis.org -
Posted in CDF Analysis Tips and Tricks, Debugging, Software Trace Analysis, Trace Analysis Patterns | 2 Comments »
Monday, August 3rd, 2009
When we have software traces that record process identifiers (PID) and thread identifiers (TID) it is important to differentiate between trace statements sorted by time and by Thread of Activity. The latter is simply the flow of trace messages sorted by TID and it is very helpful in cases with dense traces coming from hundreds of processes and components. Here is an example from MessageHistory bulk trace fragment showing different threads of activity in different colors:
Start time: 21:5:36:651

Format time: 21:5:43:133

Number of messages sent: 24736

Number of messages posted: 905
[...]

21:5:41:990 S PID: a7c TID: 554 HWND: 0×0000000000010E62  Class: “ToolbarWindow32″ Title: “” WM_USER+4b (0×44b) wParam: 0×14 lParam: 0×749e300

21:5:41:990 S PID: a7c TID: 554 HWND: 0×00010E4A  Class: “CtrlNotifySink” Title: “” WM_NOTIFY (0×4e) wParam: 0×0 lParam: 0×749efa8

21:5:41:990 S PID: a7c TID: 554 HWND: 0×00010E62  Class: “ToolbarWindow32″ Title: “” WM_USER+3f (0×43f) wParam: 0×14 lParam: 0×749e1e0

21:5:41:990 S PID: a7c TID: 554 HWND: 0×00010E62  Class: “ToolbarWindow32″ Title: “” WM_USER+4b (0×44b) wParam: 0×14 lParam: 0×749e300

21:5:41:990 S PID: a7c TID: 554 HWND: 0×00010E62  Class: “ToolbarWindow32″ Title: “” WM_USER+19 (0×419) wParam: 0×14 lParam: 0×0

21:5:41:990 S PID: a7c TID: 554 HWND: 0×00010E62  Class: “ToolbarWindow32″ Title: “” WM_USER+61 (0×461) wParam: 0×6 lParam: 0×0

21:5:41:990 S PID: a7c TID: 554 HWND: 0×00010E62  Class: “ToolbarWindow32″ Title: “” WM_USER+56 (0×456) wParam: 0×0 lParam: 0×0

21:5:41:990 S PID: a7c TID: 554 HWND: 0×00010E4A  Class: “CtrlNotifySink” Title: “” WM_NOTIFY (0×4e) wParam: 0×0 lParam: 0×749f290

21:5:41:990 S PID: a7c TID: 554 HWND: 0×000E04A8  Class: “CtrlNotifySink” Title: “” WM_NCPAINT (0×85) wParam: 0xffffffffcc043bdb lParam: 0×0

21:5:41:990 P PID: a7c TID: 554 HWND: 0×000E04A8  Class: “CtrlNotifySink” Title: “” WM_PAINT (0xf) wParam: 0×0 lParam: 0×0

21:5:42:007 S PID: 1a8 TID: 660 HWND: 0×0001003C  Class: “CiceroUIWndFrame” Title: “TF_FloatingLangBar_WndTitle” WM_WINDOWPOSCHANGING (0×46) wParam: 0×0 lParam: 0×29af030

21:5:42:007 P PID: a7c TID: 9b4 HWND: 0×00010084  Class: “CiceroUIWndFrame” Title: “TF_FloatingLangBar_WndTitle” WM_TIMER (0×113) wParam: 0×6 lParam: 0×0

21:5:42:007 P PID: 1a8 TID: 660 HWND: 0×0001003C  Class: “CiceroUIWndFrame” Title: “TF_FloatingLangBar_WndTitle” WM_TIMER (0×113) wParam: 0×8 lParam: 0×0

21:5:42:007 P PID: a7c TID: 9b4 HWND: 0×00010084  Class: “CiceroUIWndFrame” Title: “TF_FloatingLangBar_WndTitle” WM_TIMER (0×113) wParam: 0×9 lParam: 0×0

21:5:42:022 P PID: a7c TID: a28 HWND: 0×0001061A  Class: “WPDShServiceObject” Title: “WPDShServiceObject_WND” WM_TIMER (0×113) wParam: 0xd lParam: 0×0

21:5:42:022 P PID: a7c TID: 9b4 HWND: 0×00010084  Class: “CiceroUIWndFrame” Title: “TF_FloatingLangBar_WndTitle” WM_TIMER (0×113) wParam: 0×8 lParam: 0×0

21:5:42:022 P PID: a7c TID: 9b4 HWND: 0×00010084  Class: “CiceroUIWndFrame” Title: “TF_FloatingLangBar_WndTitle” WM_PAINT (0xf) wParam: 0×0 lParam: 0×0

21:5:42:036 P PID: 1a8 TID: 660 HWND: 0×0001003C  Class: “CiceroUIWndFrame” Title: “TF_FloatingLangBar_WndTitle” WM_TIMER (0×113) wParam: 0×5 lParam: 0×0

21:5:42:054 S PID: a7c TID: 9b4 HWND: 0×0001006C  Class: “ReBarWindow32″ Title: “” WM_USER+10 (0×410) wParam: 0×2 lParam: 0×0

21:5:42:054 S PID: a7c TID: 9b4 HWND: 0×0001006C  Class: “ReBarWindow32″ Title: “” WM_USER+18 (0×418) wParam: 0×2 lParam: 0×1041a

21:5:42:054 S PID: a7c TID: 9b4 HWND: 0×0001006C  Class: “ReBarWindow32″ Title: “” WM_USER+1a (0×41a) wParam: 0×0 lParam: 0×1041c

21:5:42:054 S PID: a7c TID: 9b4 HWND: 0×0001006C  Class: “ReBarWindow32″ Title: “” WM_USER+19 (0×419) wParam: 0×0 lParam: 0×0

21:5:42:054 S PID: a7c TID: 9b4 HWND: 0×00010084  Class: “CiceroUIWndFrame” Title: “TF_FloatingLangBar_WndTitle” WM_WINDOWPOSCHANGING (0×46) wParam: 0×0 lParam: 0×2bef960

21:5:42:054 P PID: a7c TID: 9b4 HWND: 0×00010084  Class: “CiceroUIWndFrame” Title: “TF_FloatingLangBar_WndTitle” WM_TIMER (0×113) wParam: 0×10 lParam: 0×0

21:5:42:054 P PID: a7c TID: 9b4 HWND: 0×00010084  Class: “CiceroUIWndFrame” Title: “TF_FloatingLangBar_WndTitle” WM_TIMER (0×113) wParam: 0×5 lParam: 0×0

21:5:42:074 S PID: a7c TID: 554 HWND: 0×00010E32  Class: “DirectUIHWND” Title: “” WM_NCHITTEST (0×84) wParam: 0×0 lParam: 0×640406

21:5:42:074 S PID: a7c TID: 554 HWND: 0×00010E30  Class: “DUIViewWndClassName” Title: “” WM_NCHITTEST (0×84) wParam: 0×0 lParam: 0×640406

21:5:42:074 S PID: a7c TID: 554 HWND: 0×00010E32  Class: “DirectUIHWND” Title: “” WM_SETCURSOR (0×20) wParam: 0×10e32 lParam: 0×2000001

21:5:42:074 S PID: a7c TID: 554 HWND: 0×00010E30  Class: “DUIViewWndClassName” Title: “” WM_SETCURSOR (0×20) wParam: 0×10e32 lParam: 0×2000001

21:5:42:074 S PID: a7c TID: 554 HWND: 0×00010E20  Class: “ShellTabWindowClass” Title: “Release” WM_SETCURSOR

[…]
Ususally when we see an error indication we select its current thread of activity and investigate what happened in this process and thread before. Here is a synthesised example from real CDF traces:
No     PID  TID  Time         Message

[...]

165797 4280 5696 07:07:23.709 FreeToken Handle 00000000

165798 4660 7948 07:07:23.709 EnumProcesses failed. Error=-2144534527

165799 7984 6216 07:07:23.749 GetData threw exception

165800 7984 6216 07:07:23.750 === Begin Exception Dump ===

[…]
We see the error and sort by TID 7948 to see what happened before and get additional information like server name:
No     PID  TID  Time         Message

[...]

165223 4660 7948 07:07:23.704 GetServerName: Exit. ServerName = SERVER02

165224 4660 7948 07:07:23.704 GetServerProcesses: ServerName is SERVER02

165798 4660 7948 07:07:23.709 EnumProcesses failed. Error=-2144534527

[…]
- Dmitry Vostokov @ TraceAnalysis.org -
Posted in CDF Analysis Tips and Tricks, Debugging, Software Trace Analysis, Trace Analysis Patterns | 3 Comments »
Wednesday, July 29th, 2009
Often analysis of software traces starts with searching for short textual patterns, like a failure or an exception code or simply the word “exception”. And indeed, some software components are able to record their own exceptions or exceptions that were propagated to them including full stack traces. This is all common in .NET and Java environments. Here is a synthetic and beautified example based on real software traces:
N      PID  TID  Message

[...]

265799 8984 4216 ComponentA.Store.GetData threw exception: ‘System.Reflection.TargetInvocationException: DCOM connection to server failed with error: ‘Exception from HRESULT: 0×842D0001′ —> System.Runtime.InteropServices.COMException (0×842D0001): Exception from HRESULT: 0×842D0001

   at ComponentA.GetData(Byte[] pKey)

   at System.RuntimeMethodHandle._InvokeMethodFast(Object target, Object[] arguments, SignatureStruct& sig, MethodAttributes methodAttributes, RuntimeTypeHandle typeOwner)

   at System.RuntimeMethodHandle.InvokeMethodFast(Object target, Object[] arguments, Signature sig, MethodAttributes methodAttributes, RuntimeTypeHandle typeOwner)

   at System.Reflection.RuntimeMethodInfo.Invoke(Object obj, BindingFlags invokeAttr, Binder binder, Object[] parameters, CultureInfo culture, Boolean skipVisibilityChecks)

   at System.Reflection.RuntimeMethodInfo.Invoke(Object obj, BindingFlags invokeAttr, Binder binder, Object[] parameters, CultureInfo culture)

   at ComponentB.Connections.ComInterfaceProxy.Invoke(IMessage message)’

265800 8984 4216 === Begin Exception Dump ===

265801 8984 4216 ComponentB.Exceptions.ConnectionException: DCOM connection to server failed with error: ‘Exception from HRESULT: 0×842D0001′ —> System.Runtime.InteropServices.COMException (0×842D0001): Exception from HRESULT: 0×842D0001

265802 8984 4216 at ComponentA.Store.GetData(Byte[] pKey)

[…]

265808 8984 4216 Exception rethrown at [0]:

265809 8984 4216 at System.Runtime.Remoting.Proxies.RealProxy.HandleReturnMessage(IMessage reqMsg, IMessage retMsg)

265810 8984 4216 at System.Runtime.Remoting.Proxies.RealProxy.PrivateInvoke(MessageData& msgData, Int32 type)

265811 8984 4216 at ComponentA.Store.GetData(Byte[] pKey)

265812 8984 4216 at ComponentA.App.EnumBusinessObjects()

[…]

265816 8984 4216 ===> InnerException:

265817 8984 4216 ** COM Exception Error Code: 0×842d0001

265818 8984 4216 System.Runtime.InteropServices.COMException (0×842D0001): Exception from HRESULT: 0×842D0001

265819 8984 4216 at ComponentA.Store.GetData(Byte[] pKey)

265820 8984 4216 === End Exception Dump ===

[…]
In the embedded stack trace we see that App object was trying to enumerate business objects and asked Store object to get some data and the latter object was probably trying to communicate to the real data store via DCOM. The communication attempt failed with HRESULT.
- Dmitry Vostokov @ TraceAnalysis.org -
Posted in .NET Debugging, CDF Analysis Tips and Tricks, Citrix, Debugging, Software Trace Analysis, Trace Analysis Patterns | 2 Comments »
Wednesday, July 22nd, 2009
Sometimes we have several disjoint Periodic Errors and possible false positives. We wonder where should we start or assign relative priorities for troubleshooting suggestions. Here Statement Density and Current pattern can help. The statement or message density is simply the ratio of the number of occurrences of the specific trace statement (message) in the trace to the total number of all different recorded messages.
Consider this software trace with two frequent messages:
N     PID  TID

21    5928 8092 LookupAccountSid failed. Result = -2146238462

[...]

1013  5928 1340 SQL execution needs a retry. Result = 0
We have approx. 7,500 statements for the former and approx. 1,250 statements for the latter. The total number of trace statements is 185,700, so we have the corresponding approx. trace densities: 0.04 and 0.0067. Their relative ratio 7,500 / 1,250 is 6.
Another trace for the same problem was collected at a different time with the same errors. It has 71,100 statements and only 160 and 27 statements counted for messages above. We have a ratio 160 / 27 approx. the same, 5.93, that suggests that messages are correlated. However statement density is much lower, 0,002 and 0.00038 approx. and this suggests the closer look at the second trace to see whether these problems started at some time later after the start of the recording.
We can also check the statement current as the number of messages per unit of time. The first trace was recorded over the period of 195 seconds and the second over the period of 650 seconds. Therefore, we have 952 msg/s and 109 msg/s respectively. This suggests that the problem might have started at some time during the second trace or there were more modules selected for the first trace. To make sure, we adjust the total number of messages for these two traces. We find the first occurrence of the error and subtract its message number from the total number of messages. For our first trace we see that messages start from the very beginning, and in our second trace they also almost start from the beginning. So such adjustment shouldn’t give much better results here. Also these statements continue to be recorded till the very end of these traces.
To avoid being lost in this discusssion I repeat main results:
           Density             Relative Density   Current,

                                                  all msg/s

Trace 1    0.04 / 0.0067       6                  952

Trace 2    0.002 / 0.00038     5.93               109
The possibility that much more was traced that resulted in lower density for the second trace should be discarded because we have much lower current. Perhaps environment was not quite the same for the second tracing. However the same relative density for two different errors suggest that they are correlated and the higher density of the first error suggests that we should start our investigation from it.
The reason why I came up with this statistical trace analysis pattern is because 2 different engineers analyzed the same trace and both were suggesting different troubleshooting paths based on selected error messages from software traces. So I did a statistical analysis to prioritize their suggestions.
- Dmitry Vostokov @ TraceAnalysis.org -
Posted in Debugging, Software Trace Analysis, Trace Analysis Patterns, Troubleshooting Methodology | 6 Comments »
Friday, June 19th, 2009
The following group has been created on Facebook:
DATA (Dump Analysis + Trace Analysis)
Please don’t hesitate to join and spread news about it 
- Dmitry Vostokov @ DumpAnalysis.org -
Posted in Announcements, Crash Dump Analysis, Software Trace Analysis | No Comments »
Tuesday, June 16th, 2009
Sometimes we see a functional activity in a trace and / or see basic facts. Then we might want to find a correlation between that activity or facts in another part of the trace. If that intra-correlation fits into our problem description we may claim a possible explanation or, if we are lucky, we have just found, an inference to the best explanation, as philosophers of science like to say. Here is an example, but this time using Citrix WindowHistory tracing tool. A third-party application was frequently loosing the focus and the suspicion was on a terminal services client process. It was found that the following WindowHistory trace fragment corresponds to that application:
Handle: 00050586 Class: "Application A Class" Title: ""

     Title changed at 15:52:4:3 to "Application A"

     Title changed at 15:52:10:212 to "Application A - File1"

[...]

   Process ID: 89c

   Thread ID: d6c

[...]

   Visible: true

   Window placement command: SW_SHOWNORMAL

        Placement changed at 15:54:57:506 to SW_SHOWMINIMIZED

        Placement changed at 15:55:2:139 to SW_SHOWNORMAL

   Foreground: false

        Foreground changed at 15:52:4:3 to true

        Foreground changed at 15:53:4:625 to false

        Foreground changed at 15:53:42:564 to true

        Foreground changed at 15:53:44:498 to false

        Foreground changed at 15:53:44:498 to true

        Foreground changed at 15:53:44:592 to false

        Foreground changed at 15:53:45:887 to true

        Foreground changed at 15:53:47:244 to false

        Foreground changed at 15:53:47:244 to true

        Foreground changed at 15:53:47:353 to false

        Foreground changed at 15:54:26:416 to true

        Foreground changed at 15:54:27:55 to false

        Foreground changed at 15:54:27:55 to true

        Foreground changed at 15:54:27:180 to false

        Foreground changed at 15:54:28:428 to true

        Foreground changed at 15:54:28:771 to false

        Foreground changed at 15:54:28:865 to true

        Foreground changed at 15:54:29:99 to false

        Foreground changed at 15:54:30:877 to true

        Foreground changed at 15:54:57:521 to false

        Foreground changed at 15:55:2:76 to true

        Foreground changed at 15:57:3:378 to false

        Foreground changed at 15:57:11:396 to true

        Foreground changed at 15:57:29:601 to false

        Foreground changed at 15:57:39:803 to true

        Foreground changed at 15:58:54:41 to false

        Foreground changed at 15:59:8:96 to true

        Foreground changed at 16:1:19:478 to false

        Foreground changed at 16:1:27:527 to true

        Foreground changed at 16:1:39:914 to false

        Foreground changed at 16:2:0:515 to true

        Foreground changed at 16:7:14:628 to false

        Foreground changed at 16:7:24:246 to true

        Foreground changed at 16:9:53:523 to false

        Foreground changed at 16:10:15:919 to true

        Foreground changed at 16:10:31:426 to false

        Foreground changed at 16:11:12:818 to true

        Foreground changed at 16:11:59:538 to false

        Foreground changed at 16:12:39:456 to true

        Foreground changed at 16:13:6:364 to false
Corresponding terminal services client window trace fragment doesn’t have any foreground changes but another application main window has lots of them:
Handle: 000D0540 Class: "Application B Class" Title: "Application B"

[...]

   Process ID: 3ac

   Thread ID: bd4

[...]

   Foreground: false

        Foreground changed at 15:50:36:972 to true

        Foreground changed at 15:50:53:732 to false

        Foreground changed at 15:50:53:732 to true

        Foreground changed at 15:50:53:826 to false

        Foreground changed at 15:51:51:352 to true

        Foreground changed at 15:51:53:941 to false

        Foreground changed at 15:53:8:135 to true

        Foreground changed at 15:53:8:182 to false

        Foreground changed at 15:53:10:178 to true

        Foreground changed at 15:53:13:938 to false

        Foreground changed at 15:53:30:443 to true

        Foreground changed at 15:53:31:20 to false

        Foreground changed at 15:53:31:20 to true

        Foreground changed at 15:53:31:129 to false

        Foreground changed at 15:53:34:78 to true

        Foreground changed at 15:53:34:795 to false

        Foreground changed at 15:53:34:795 to true

        Foreground changed at 15:53:34:873 to false

        Foreground changed at 15:53:36:901 to true

        Foreground changed at 15:53:42:502 to false

        Foreground changed at 15:53:42:502 to true

        Foreground changed at 15:53:42:564 to false

        Foreground changed at 15:57:3:425 to true

        Foreground changed at 15:57:4:595 to false

        Foreground changed at 15:57:10:507 to true

        Foreground changed at 15:57:11:318 to false

        Foreground changed at 15:57:29:632 to true

        Foreground changed at 15:57:31:67 to false

        Foreground changed at 15:57:32:721 to true

        Foreground changed at 15:57:33:844 to false

        Foreground changed at 15:58:54:88 to true

        Foreground changed at 15:58:56:178 to false

        Foreground changed at 15:59:6:505 to true

        Foreground changed at 15:59:7:987 to false

        Foreground changed at 16:1:19:525 to true

        Foreground changed at 16:1:19:961 to false

        Foreground changed at 16:1:26:607 to true

        Foreground changed at 16:1:27:434 to false

        Foreground changed at 16:1:39:914 to true

        Foreground changed at 16:1:39:992 to false

        Foreground changed at 16:1:49:798 to true

        Foreground changed at 16:2:0:437 to false

        Foreground changed at 16:7:14:628 to true

        Foreground changed at 16:7:14:847 to false

        Foreground changed at 16:7:18:76 to true

        Foreground changed at 16:7:24:106 to false

        Foreground changed at 16:9:58:790 to true

        Foreground changed at 16:10:4:16 to false

        Foreground changed at 16:10:4:874 to true

        Foreground changed at 16:10:4:890 to false

        Foreground changed at 16:10:8:634 to true

        Foreground changed at 16:10:15:779 to false

        Foreground changed at 16:10:56:766 to true

        Foreground changed at 16:10:59:402 to false

        Foreground changed at 16:10:59:652 to true

        Foreground changed at 16:10:59:667 to false

        Foreground changed at 16:12:9:397 to true

        Foreground changed at 16:12:39:347 to false

        Foreground changed at 16:13:18:375 to true

        Foreground changed at 16:14:33:656 to false
We can see that most of the time when Application A window looses focus Application B window gets it.
- Dmitry Vostokov @ TraceAnalysis.org -
Posted in Citrix, Debugging, Software Trace Analysis, Tools, Trace Analysis Patterns | 1 Comment »
Friday, June 12th, 2009
Let’s define a software or computer narratology as an application of the theory and methods of literary narratology to the domain of software execution where software traces and logs are considered as a narrative, the story of a computation (*). As an example, we have the following correspondence between 4-tiers of literary and software narrative models:
Events            Instructions, statements, functions

History           Concrete execution path

Narrative         Software trace

Presentation      View (from a trace viewer)
(*) Please do not confuse software narratology with computational narratology.
- Dmitry Vostokov @ TraceAnalysis.org -
Posted in Science of Software Tracing, Software Narratology, Software Trace Analysis | 3 Comments »
Wednesday, June 3rd, 2009
DumpAnalysis.org acquires TraceAnalysis.org to complete computer DATA artifact analysis. The domain currently points to Dump Analysis Portal page but this might change in the future.
- Dmitry Vostokov @ DumpAnalysis.org -
Posted in Announcements, CDF Analysis Tips and Tricks, Citrix, Debugging, Science of Software Tracing, Software Technical Support, Software Trace Analysis, Software Tracing for Dummies, Tools, Trace Analysis Patterns, Troubleshooting Methodology, Windows System Administration | No Comments »
Wednesday, June 3rd, 2009
Next obvious structural trace analysis pattern is called Circular Trace. Sometimes this information is missing in the problem description or trace metadata doesn’t reflect this. Then circular traces can be detected by trace file size (usually large) and from timestamps, like this 100Mb CDF trace snippet:
No     Module  PID  TID  Date      Time         Statement

[Begin of trace listing]

1      ModuleA 4280 1736 5/28/2009 08:53:50.496 [... Trace statement 1]

2      ModuleB 6212 6216 5/28/2009 08:53:52.876 [... Trace statement 2]

3      ModuleA 4280 4776 5/28/2009 08:54:13.537 [... Trace statement 3]

[... Some traced exceptions helpful for analysis ...]

3799   ModuleA 4280 3776 5/28/2009 09:15:00.853 [… Trace statement 3799]

3800   ModuleA 4280 1736 5/27/2009 09:42:12.029 [… Trace statement 3800]

[… Skipped …]

[… Skipped …]

[… Skipped …]

579210 ModuleA 4280 4776 5/28/2009 08:53:35.989 [… Trace statement 579210]

[End of trace listing]
In such traces, the analysis region is usually found at the wrap point because, as soon as an elusive, hard-to-reproduce problem occurs, the trace is stopped.
- Dmitry Vostokov @ TraceAnalysis.org -
Posted in CDF Analysis Tips and Tricks, Debugging, Software Trace Analysis, Trace Analysis Patterns | 1 Comment »
Wednesday, June 3rd, 2009
DATA (Dump Artifact + Trace Artifact) - > DATA (Dump Analysis + Trace Analysis) examples:
1. Efficient
- My 64Gb server bluescreens. I set a complete memory dump option in Control Panel.
- A user cannot connect. I started tracing yesterday. Stopped today.
- I analyze all these artifacts every day.
2. Effective
- My 64Gb server bluescreens. I set a kernel memory dump option in Control Panel.
- A user cannot connect. I started tracing, tried to connect, stopped tracing.
- I analyze all these artifacts every day and write articles to reduce DATA load.
- Dmitry Vostokov @ DumpAnalysis.org -
Posted in Crash Dump Analysis, Crash Dumps for Dummies, Debugging, Software Technical Support, Software Trace Analysis, Software Tracing for Dummies | No Comments »
Wednesday, June 3rd, 2009
Good software engineers write good software trace statements. Good software support engineers and responsible customers trace(*) software wisely, enabling it at the right time and in the right quantities. The following preliminary article was written to help to trace software effectively to result in faster problem resolution via trace analysis:
Tracing Best Practices
Although, currently it’s geared towards CDF tracing in Citrix terminal services environment, these recommendations can be generalized to other traces as well and the article will be extended over time.
(*) Note the following terminological difference here. “Tracing” is meant in “select” / “start” / “stop” sense and not how to write good software trace statements during code construction and maintenance phases.
- Dmitry Vostokov @ TraceAnalysis.org -
Posted in Citrix, Debugging, Software Technical Support, Software Trace Analysis, Software Tracing for Dummies | No Comments »
Friday, May 29th, 2009
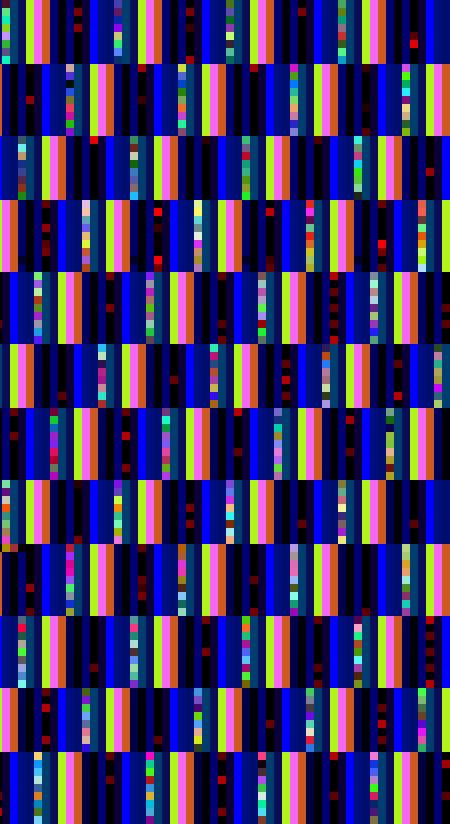
Now some pictures from Citrix CDF traces.
Deep waters of The Sea of Traces:

Considering software tracing as narrative no wonder one day I discovered the vast Library of Software Logs in the sea above:
- Dmitry Vostokov @ DumpAnalysis.org -
Posted in Art, Citrix, Fun with Crash Dumps, Memory Space Art, Memory Visualization, Software Trace Analysis, Software Trace Visualization | No Comments »
Tuesday, May 26th, 2009
I was suddenly enlightened by the unification of software traces with memory dumps and it came to me that DATA is simply Dump Analysis + Trace Analysis. It is commutative with TADA, the sound of accomplishment (tada.wav in Windows \ Media folder).
This can’t be a coincidence, can it?
- Dmitry Vostokov @ DumpAnalysis.org -
Posted in Crash Dump Analysis, Fun with Crash Dumps, New Acronyms, Software Trace Analysis | 5 Comments »
Tuesday, May 26th, 2009
What is a software trace from a mathematical standpoint? Before any software writes its trace data, it assembles it in memory. Therefore, generally, a software trace is a linear ordered sequence of specifically prepared memory fragments (trace statements):
(ts1, ts2, …, tsn)
where every tsi is a sequence of bits, bytes or other discrete units (see the definition of a memory dump):
(s11, s12, …, s1k, s21, s22, …, s2l, …, …, …, sn1, sn2, …, snm)
These trace statements can also be minidumps, selected regions of memory space. In the limit, if every tsi is a full memory snapshot saved at an instant of time (ti) we have a sequence of memory dumps:
(mt1, mt2, …, mtn)
Like with memory dump analysis we need symbol files to interpret saved memory fragments unless they were already interpreted during their construction. For example, traces written according ETW specification (Event Tracing for Windows), need TMF files (Trace Message Format) for their interpretation and viewing. Usually these files are generated from PDB files and therefore we have this correspondence:
memory dump file -> software trace file
PDB file -> TMF file
- Dmitry Vostokov @ TraceAnalysis.org -
Posted in Announcements, Debugging, Mathematics of Debugging, Science of Software Tracing, Software Trace Analysis | 5 Comments »
Monday, May 25th, 2009
“A trace is a narrative, the story of a computation.”
Dmitry Vostokov, Software Tracing and Logging: Architecture, Design, Implementation and Analysis Patterns
- Dmitry Vostokov @ TraceAnalysis.org -
Posted in Bugtations, Debugging, Software Trace Analysis, Trace Analysis Patterns | 1 Comment »