Crash Dump Analysis Patterns (Part 202)
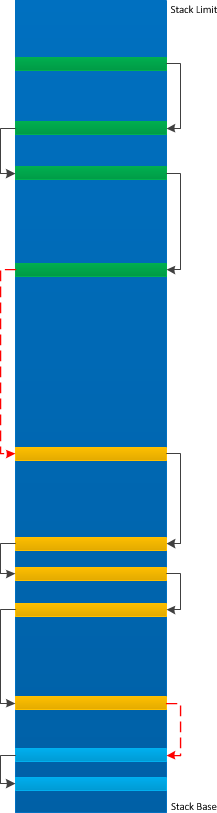
Saturday, November 9th, 2013Sometimes we see the so called Small Values in memory (such as on raw stack) or in CPU registers which can be an ASCII or UNICODE value, some ID or even a handle. When in aggregates they can form a certain Semantic Structure such as a PID.TID example or Regular Data pattern. Here we illustrate a handle example (also an example of a Wait Chain analysis in user space):
0:000> kv

Child-SP          RetAddr           : Args to Child                                                           : Call Site

00000000`0016de78 000007fe`fcf010dc : 00000000`02c79fa0 00000000`08c3faf0 00000000`021551f0 00000000`08c3fb00 : ntdll!NtWaitForSingleObject+0xa

00000000`0016de80 000007fe`f90e6d7f : 00000000`10b40010 00000000`10b40010 00000000`00000000 00000000`000007e0 : KERNELBASE!WaitForSingleObjectEx+0×79

[…]
0:000> !handle 00000000`000007e0 ff

Handle 00000000000007d0

  Type          Thread

  Attributes    0

  GrantedAccess 0x1fffff:

         Delete,ReadControl,WriteDac,WriteOwner,Synch

         Terminate,Suspend,Alert,GetContext,SetContext,SetInfo,QueryInfo,SetToken,

Impersonate,DirectImpersonate

  HandleCount   5

  PointerCount  9

  Name          <none>

  Object specific information

    Thread Id   278c.a58

    Priority    13

    Base Priority 0
0:000> ~~[a58]s

ntdll!NtWaitForMultipleObjects+0xa:

00000000`770c186a c3              ret
0:002> kv

Child-SP          RetAddr           : Args to Child                                                           : Call Site

00000000`0f6af758 000007fe`fcf01430 : 00000000`00000025 00000000`00000000 00000000`00000000 000007fe`e35a1fb0 : ntdll!NtWaitForMultipleObjects+0xa

00000000`0f6af760 00000000`76e61220 : 00000000`0f6af8a8 00000000`0f6af890 00000000`00000000 00000000`00000000 : KERNELBASE!WaitForMultipleObjectsEx+0xe8

[...]
0:026> dp 00000000`0f6af890 L4

00000000`0f6af890  00000000`00000dbc 00000000`000007c0

00000000`0f6af8a0  00000000`00000000 00000000`00000000
0:002> !handle dbc ff

Handle 0000000000000dbc

  Type          Thread

  Attributes    0

  GrantedAccess 0x1fffff:

         Delete,ReadControl,WriteDac,WriteOwner,Synch

         Terminate,Suspend,Alert,GetContext,SetContext,SetInfo,QueryInfo,SetToken,

Impersonate,DirectImpersonate

  HandleCount   2

  PointerCount  4

  Name          <none>

  Object specific information

    Thread Id   278c.24ac

    Priority    14

    Base Priority 0
0:002> !handle 7c0 ff

Handle 00000000000007c0

  Type          Thread

  Attributes    0

  GrantedAccess 0x1fffff:

         Delete,ReadControl,WriteDac,WriteOwner,Synch

         Terminate,Suspend,Alert,GetContext,SetContext,SetInfo,QueryInfo,SetToken,

Impersonate,DirectImpersonate

  HandleCount   2

  PointerCount  4

  Name          <none>

  Object specific information

    Thread Id   278c.628

    Priority    14

    Base Priority 0
- Dmitry Vostokov @ DumpAnalysis.org + TraceAnalysis.org -