Icons for Memory Dump Analysis Patterns (Part 35)
Monday, May 10th, 2010Today we introduce an icon for Waiting Thread Time (kernel dumps) pattern:
B/W
![]()
Color
![]()
- Dmitry Vostokov @ DumpAnalysis.org + TraceAnalysis.org -
Today we introduce an icon for Waiting Thread Time (kernel dumps) pattern:
B/W
![]()
Color
![]()
- Dmitry Vostokov @ DumpAnalysis.org + TraceAnalysis.org -
My drive to generalization led me to place an adornment on the portal to highlight the fact that memory and software trace analysis patterns are under an umbrella of general software behaviour patterns:
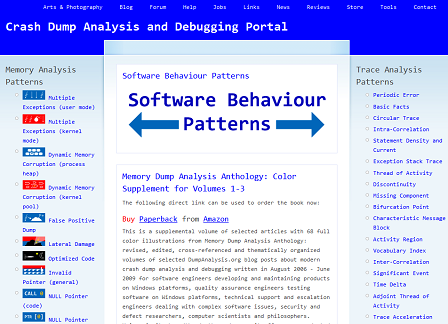
http://www.dumpanalysis.org/Software-Behavior-Patterns-Headline
In the forthcoming post series I plan to write about similarities between these two branches and also provide pattern examples from non-Windows platforms. All this material will provide the foundation for the forthcoming book Software Behavior: A Guide to Systematic Analysis (ISBN: 978-1906717162).
- Dmitry Vostokov @ DumpAnalysis.org + TraceAnalysis.org -
Previously announced book is now available on Amazon:
Memory Dump Analysis Anthology: Color Supplement for Volumes 1-3

- Dmitry Vostokov @ DumpAnalysis.org + TraceAnalysis.org -
Sometimes when a high number of interrupts is reported but there are no signs of an interrupt storm or pending DPCs in a memory dump file it is useful to search for Hardware Activity in running and / or suspected threads. This can be done by examining execution residue left on a thread raw stack. Although found driver activity might not be related to reported problems it can be a useful start for driver elimination procedure for the general recommendation to check drivers for any updates. Here is an example of a thread raw stack with a network card doing “Scatter-Gather” DMA (more extensive example is coming in a separate pattern cooperation case study):
1: kd> !thread

THREAD f7732090 Cid 0000.0000 Teb: 00000000 Win32Thread: 00000000 RUNNING on processor 1

Not impersonating

Owning Process 8089db40 Image: Idle

Attached Process N/A Image: N/A

Wait Start TickCount 0 Ticks: 24437545 (4:10:03:56.640)

Context Switch Count 75624870

UserTime 00:00:00.000

KernelTime 4 Days 08:56:05.125

Stack Init f78b3000 Current f78b2d4c Base f78b3000 Limit f78b0000 Call 0

Priority 0 BasePriority 0 PriorityDecrement 0

ChildEBP RetAddr Args to Child

f3b30c5c 00000000 00000000 00000000 00000000 LiveKdD+0x1c07
1: kd> dds f78b0000 f78b3000

f78b0000 00000000

f78b0004 00000000

f78b0008 00000000

f78b000c 00000000

f78b0010 00000000

[...]

f78b2870 8b3de0d0

f78b2874 80887b75 nt!KiFlushTargetSingleTb+0xd

f78b2878 8b49032c

f78b287c 00000000

f78b2880 2d003202

f78b2884 00000000

f78b2888 00000000

f78b288c 2d003202

f78b2890 8b490302

f78b2894 f78b28a4

f78b2898 80a61456 hal!KfLowerIrql+0x62

f78b289c 2d00320a

f78b28a0 00000000

f78b28a4 8b3de0d0

f78b28a8 8b3e3730

f78b28ac 00341eb0

f78b28b0 f78b2918

f78b28b4 f63fbf78 NetworkAdapterA!SendWithScatterGather+0×318

f78b28b8 8b3de0d0

f78b28bc 8b341eb0

f78b28c0 f78b28d4

f78b28c4 00000000

f78b28c8 80a5f3c0 hal!KfAcquireSpinLock

f78b28cc 00000000

f78b28d0 8b3de0d0

f78b28d4 00000000

f78b28d8 8b3de0d0

f78b28dc 8b3eb730

f78b28e0 005a7340

f78b28e4 f78b294c

f78b28e8 f63fbf78 NetworkAdapterA!SendWithScatterGather+0×318

f78b28ec 8b3de0d0

f78b28f0 8a5a7340

f78b28f4 f78b2908

f78b28f8 00000000

f78b28fc 8b3de0d0

f78b2900 8b0f5158

f78b2904 001e2340

f78b2908 f78b2970

f78b290c f63fbf78 NetworkAdapterA!SendWithScatterGather+0×318

f78b2910 8b3de0d0

f78b2914 8b1e2340

f78b2918 f78b292c

f78b291c 00000000

f78b2920 80a5f3c0 hal!KfAcquireSpinLock

f78b2924 00000000

f78b2928 8b3de0d0

f78b292c 00000000

f78b2930 8b3eb700

f78b2934 00000000

f78b2938 00000000

f78b293c 00000000

f78b2940 00000000

f78b2944 00000000

f78b2948 00000000

f78b294c 0a446aa2

f78b2950 f78b29b8

f78b2954 8b0f5158

f78b2958 8b01ce10

f78b295c 00000001

f78b2960 8b3de0d0

f78b2964 80a5f302 hal!HalpPerfInterrupt+0×32

f78b2968 00000001

f78b296c 8b3de0d0

f78b2970 80a5f302 hal!HalpPerfInterrupt+0×32

f78b2974 8b3de302

f78b2978 f78b2988

f78b297c 80a61456 hal!KfLowerIrql+0×62

f78b2980 80a5f3c0 hal!KfAcquireSpinLock

f78b2984 8b3de302

f78b2988 f78b29a4

f78b298c 80a5f44b hal!KfReleaseSpinLock+0xb

f78b2990 f63fbbbf NetworkAdapterA!SendPackets+0×1b3

f78b2994 8a446a90

f78b2998 8b0e8ab0

f78b299c 00000000

f78b29a0 008b29d0

f78b29a4 f78b29bc

f78b29a8 f7163790 NDIS!ndisMProcessSGList+0×90

f78b29ac 8b3de388

f78b29b0 f78b29d0

f78b29b4 00000001

f78b29b8 00000000

f78b29bc f78b29e8

f78b29c0 80a60147 hal!HalBuildScatterGatherList+0×1c7

f78b29c4 8b0e89b0

f78b29c8 00000000

f78b29cc 8a44cde8

f78b29d0 8b1e2340

f78b29d4 8a446aa2

f78b29d8 8b026ca0

f78b29dc 8b1e2340

f78b29e0 8b0e8ab0

f78b29e4 8b0e8ab0

f78b29e8 f78b2a44

f78b29ec f716369f NDIS!ndisMAllocSGList+0xda

f78b29f0 8a44cde8

f78b29f4 8b0e89b0

f78b29f8 8a446a70

f78b29fc 00000000

f78b2a00 00000036

f78b2a04 f7163730 NDIS!ndisMProcessSGList

f78b2a08 8b1e2340

f78b2a0c 00000000

f78b2a10 8a44cde8

f78b2a14 00000218

f78b2a18 8b1e2308

f78b2a1c 00000103

f78b2a20 8b0e8ab0

f78b2a24 8a446a70

f78b2a28 8a44cde8

f78b2a2c 00000036

f78b2a30 8b0e8ab0

f78b2a34 00000036

f78b2a38 00000000

f78b2a3c 00000000

f78b2a40 029a9e02

f78b2a44 f78b2a60

f78b2a48 f71402ff NDIS!ndisMSendX+0×1dd

f78b2a4c 8b490310

f78b2a50 8b1e2340

f78b2a54 8a446a70

f78b2a58 8a9a9e02

f78b2a5c 8a9a9e02

f78b2a60 f78b2a88

f78b2a64 f546c923 tcpip!ARPSendData+0×1a9

f78b2a68 8b3e76c8

f78b2a6c 8b1e2340

f78b2a70 8a9a9ea8

f78b2a74 8b490310

f78b2a78 80888b00 nt!RtlBackoff+0×68

f78b2a7c 8a446a70

f78b2a80 8a446aa2

f78b2a84 8a446a70

f78b2a88 f78b2ab4

f78b2a8c f546ba5d tcpip!ARPTransmit+0×112

f78b2a90 8b490310

f78b2a94 8b1e2340

f78b2a98 8a9a9ea8

f78b2a9c 00000103

f78b2aa0 8a446a70

f78b2aa4 00000000

f78b2aa8 8b342398

f78b2aac 8a47e1f8

f78b2ab0 8b1e2340

f78b2ab4 f78b2bf0

f78b2ab8 f546c4fc tcpip!_IPTransmit+0×866

f78b2abc 8a9a9ebc

f78b2ac0 f78b2b02

f78b2ac4 00000001

[…]
We also do a sanity check for coincidental symbols:
1: kd> ub f63fbf78

NetworkAdapterA!SendWithScatterGather+0x304:

f63fbf64 push    eax

f63fbf65 push    edi

f63fbf66 push    esi

f63fbf67 mov     dword ptr [ebp-44h],ecx

f63fbf6a mov     dword ptr [ebp-3Ch],ecx

f63fbf6d mov     dword ptr [ebp-34h],ecx

f63fbf70 mov     dword ptr [ebp-2Ch],ecx

f63fbf73 call    NetworkAdapterA!PacketRetrieveNicActions (f63facd2)
1: kd> ub f63fbbbf

NetworkAdapterA!SendPackets+0x190:

f63fbb9c cmp     dword ptr [esi+0Ch],2

f63fbba0 jl      NetworkAdapterA!SendPackets+0x19e (f63fbbaa)

f63fbba2 mov     dword ptr [ecx+3818h],eax

f63fbba8 jmp     NetworkAdapterA!SendPackets+0x1a4 (f63fbbb0)

f63fbbaa mov     dword ptr [ecx+438h],eax

f63fbbb0 mov     dl,byte ptr [esi+2BCh]

f63fbbb6 mov     ecx,dword ptr [ebp+8]

f63fbbb9 call    dword ptr [NetworkAdapterA!_imp_KfReleaseSpinLock (f640ca18)]
1: kd> ub 80a60147

hal!HalBuildScatterGatherList+0x1b0:

80a60130 je      hal!HalBuildScatterGatherList+0x1b9 (80a60139)

80a60132 mov     dword ptr [eax+4],1

80a60139 push    dword ptr [ebp+20h]

80a6013c push    eax

80a6013d mov     eax,dword ptr [ebp+0Ch]

80a60140 push    dword ptr [eax+14h]

80a60143 push    eax

80a60144 call    dword ptr [ebp+1Ch]
- Dmitry Vostokov @ DumpAnalysis.org + TraceAnalysis.org -
This is a variation of Hooked Functions pattern for kernel space. In addition to trampoline patching we also see a modified service table:
0: kd> !chkimg -lo 50 -d !nt -v

Searching for module with expression: !nt

Will apply relocation fixups to file used for comparison

Will ignore NOP/LOCK errors

Will ignore patched instructions

Image specific ignores will be applied

Comparison image path: c:\mss\ntkrnlmp.exe\4B7A8E62280000\ntkrnlmp.exe

No range specified
Scanning section:    .text

Size: 625257

Range to scan: 80801000-80899a69

    808373e3-808373e9  7 bytes - nt!KeAcquireQueuedSpinLockAtDpcLevel+1b

 [ f7 41 04 01 00 00 00:e9 00 0d b2 76 cc cc ]

    8083e6c8-8083e6cb  4 bytes - nt!KiServiceTable+440 (+0×72e5)

 [ 98 4e 98 80:d0 66 e9 f4 ]

    80840605-8084060a  6 bytes - nt!KxFlushEntireTb+9 (+0×1f3d)

 [ ff 15 1c 10 80 80:e9 a5 7a b1 76 cc ]

Total bytes compared: 625257(100%)

Number of errors: 17
Scanning section: MISYSPTE

Size: 1906

Range to scan: 8089a000-8089a772

Total bytes compared: 1906(100%)

Number of errors: 0
Scanning section:   POOLMI

Size: 7868

Range to scan: 8089b000-8089cebc

Total bytes compared: 7868(100%)

Number of errors: 0
Scanning section: POOLCODE

Size: 7754

Range to scan: 8089d000-8089ee4a

Total bytes compared: 7754(100%)

Number of errors: 0
Scanning section:     PAGE

Size: 1097281

Range to scan: 808bc000-809c7e41

Total bytes compared: 1097281(100%)

Number of errors: 0
Scanning section:   PAGELK

Size: 63633

Range to scan: 809c8000-809d7891

Total bytes compared: 63633(100%)

Number of errors: 0
Scanning section:  PAGEWMI

Size: 7095

Range to scan: 809ef000-809f0bb7

Total bytes compared: 7095(100%)

Number of errors: 0
Scanning section:   PAGEKD

Size: 16760

Range to scan: 809f1000-809f5178

Total bytes compared: 16760(100%)

Number of errors: 0
Scanning section: PAGEHDLS

Size: 7508

Range to scan: 809f7000-809f8d54

Total bytes compared: 7508(100%)

Number of errors: 0

17 errors : !nt (808373e3-8084060a)
0: kd> dds 8083e6c8

8083e6c8  f4e966d0 DriverA+0×20d8

8083e6cc  80983436 nt!NtUnloadKey2

8083e6d0  809837b5 nt!NtUnloadKeyEx

8083e6d4  8091cec8 nt!NtUnlockFile

8083e6d8  80805d80 nt!NtUnlockVirtualMemory

8083e6dc  80937630 nt!NtUnmapViewOfSection

8083e6e0  808e7154 nt!NtVdmControl

8083e6e4  809c6ba3 nt!NtWaitForDebugEvent

8083e6e8  8092dc24 nt!NtWaitForMultipleObjects

8083e6ec  8092ccf4 nt!NtWaitForSingleObject

8083e6f0  809c132f nt!NtWaitHighEventPair

8083e6f4  809c12c3 nt!NtWaitLowEventPair

8083e6f8  80925c8d nt!NtWriteFile

8083e6fc  80901790 nt!NtWriteFileGather

8083e700  8091214c nt!NtWriteRequestData

8083e704  8093e63b nt!NtWriteVirtualMemory

8083e708  80822751 nt!NtYieldExecution

8083e70c  808c7c46 nt!NtCreateKeyedEvent

8083e710  8093eee3 nt!NtOpenKeyedEvent

8083e714  809c1ee8 nt!NtReleaseKeyedEvent

8083e718  809c2183 nt!NtWaitForKeyedEvent

8083e71c  809a610b nt!NtQueryPortInformationProcess

8083e720  809a6123 nt!NtGetCurrentProcessorNumber

8083e724  809a1849 nt!NtWaitForMultipleObjects32

8083e728  90909090

8083e72c  1c0d3b90

8083e730  0f8089f1

8083e734  037aaa85

8083e738  00c1f700

8083e73c  0fffff00

8083e740  037a9e85

8083e744  9090c300
0: kd> u 808373e3

nt!KeAcquireQueuedSpinLockAtDpcLevel+0×1b:

808373e3 jmp     DriverB+0×10e8 (f73580e8)

808373e8 int     3

808373e9 int     3

808373ea je      nt!KeAcquireQueuedSpinLockAtDpcLevel+0×12 (808373da)

808373ec pause

808373ee jmp     nt!KeAcquireQueuedSpinLockAtDpcLevel+0×1b (808373e3)

nt!KeReleaseInStackQueuedSpinLockFromDpcLevel:

808373f0 lea     ecx,[ecx]

nt!KeReleaseQueuedSpinLockFromDpcLevel:

808373f2 mov     eax,ecx
0: kd> u 80840605

nt!KxFlushEntireTb+0×9:

80840605 jmp     DriverB+0×10af (f73580af)

8084060a int     3

8084060b mov     byte ptr [ebp-1],al

8084060e mov     ebx,offset nt!KiTbFlushTimeStamp (808a7100)

80840613 mov     ecx,dword ptr [nt!KiTbFlushTimeStamp (808a7100)]

80840619 test    cl,1

8084061c jne     nt!KxFlushEntireTb+0×19 (8082cd8d)

80840622 mov     eax,ecx
- Dmitry Vostokov @ DumpAnalysis.org + TraceAnalysis.org -
Today we introduce an icon for Truncated Dump pattern:
B/W
![]()
Color
![]()
- Dmitry Vostokov @ DumpAnalysis.org + TraceAnalysis.org -
Today we introduce an icon for Managed Code Exception pattern:
B/W
![]()
Color
![]()
- Dmitry Vostokov @ DumpAnalysis.org + TraceAnalysis.org -
Today we introduce an icon for Stack Overflow (user mode) pattern:
B/W
![]()
Color
![]()
- Dmitry Vostokov @ DumpAnalysis.org + TraceAnalysis.org -
Today we introduce an icon for Stack Overflow (kernel mode) pattern:
B/W
![]()
Color
![]()
- Dmitry Vostokov @ DumpAnalysis.org + TraceAnalysis.org -
It is time to start being systematic. In addition to all-encompassing multi-volume Memory Dump Analysis Anthology OpenTask starts Systematic Software Fault Analysis series with Crash Dump Analysis: Practical Foundations as the first book. It introduces basic definitions, tools, memory dump collection and preliminary analysis methods for Windows platforms including legacy versions. This practical reference guide is a must have for system administrators of Windows server platforms and client workstations, technical support engineers and general Windows users. It builds foundation for the second book Crash Dump Analysis for System Administrators and Support Engineers and the remaining tetralogy books Windows Crash Dump Analysis and Advanced Windows Crash Dump Analysis.
Product information:
Fromt cover:

Table of Contents to be published soon.
- Dmitry Vostokov @ DumpAnalysis.org + TraceAnalysis.org -
The book is about to be submitted for publication. It has 68 full color illustrations. Here is TOC:
- Dmitry Vostokov @ DumpAnalysis.org + TraceAnalysis.org -
Today we introduce an icon for Module Variety pattern:
B/W
![]()
Color
![]()
- Dmitry Vostokov @ DumpAnalysis.org + TraceAnalysis.org -
Memory Dump Analysis Anthology lacks full color inserts. This is rather a current limitation of POD technology that OpenTask publisher uses at the present time. The solution previously announced a year ago is to print a separate full color title with selected articles and illustrations. Finally, it is about to be published next month. The book front and back covers are collages from covers of individual memory dump analysis volumes:
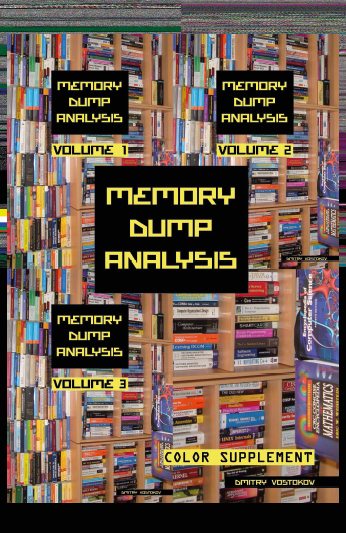
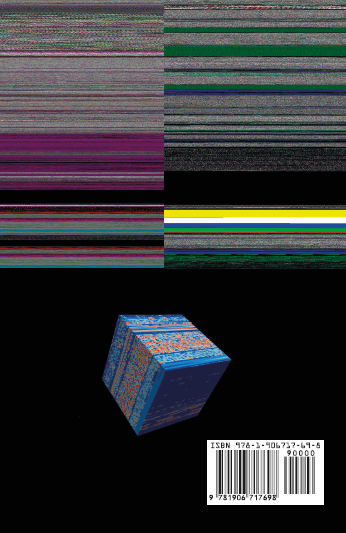
TOC will be available soon. Here is the book data:
OpenTask also plans a separate color supplement for volumes 4 and 5 once they are published.
- Dmitry Vostokov @ DumpAnalysis.org + TraceAnalysis.org -
Today we introduce an icon for Spiking Thread pattern:
B/W
![]()
Color
![]()
- Dmitry Vostokov @ DumpAnalysis.org + TraceAnalysis.org -
A print spooler service process was hanging and blocking print-related requests from other coupled processes. Default analysis of its dump doesn’t show any problem (it shows normal service main thread):
0:000> !analyze -v
EXCEPTION_RECORD:  ffffffff -- (.exr 0xffffffffffffffff)

ExceptionAddress: 00000000

   ExceptionCode: 80000003 (Break instruction exception)

  ExceptionFlags: 00000000

NumberParameters: 0
BUGCHECK_STR: APPLICATION_FAULT_STATUS_BREAKPOINT
STACK_TEXT:

0006fbcc 7c82776b 77e418b2 00000064 00000000 ntdll!KiFastSystemCallRet

0006fbd0 77e418b2 00000064 00000000 00000000 ntdll!NtReadFile+0xc

0006fc38 77f65edb 00000064 0006fd04 0000021a kernel32!ReadFile+0x16c

0006fc64 77f65f82 00000064 0006fd04 0000021a advapi32!ScGetPipeInput+0x2a

0006fcd8 77f51ed9 00000064 0006fd04 0000021a advapi32!ScDispatcherLoop+0x51

0006ff3c 01004019 0100d5bc 010047a2 00000001 advapi32!StartServiceCtrlDispatcherW+0xe3

0006ff44 010047a2 00000001 00263fa0 00262be0 spoolsv!main+0xb

0006ffc0 77e6f23b 00000000 00000000 7ffd7000 spoolsv!mainCRTStartup+0x12f

0006fff0 00000000 0100468c 00000000 78746341 kernel32!BaseProcessStart+0x23
0:000> !analyze -v -hang
EXCEPTION_RECORD:  ffffffff -- (.exr 0xffffffffffffffff)

ExceptionAddress: 00000000

   ExceptionCode: 80000003 (Break instruction exception)

  ExceptionFlags: 00000000

NumberParameters: 0
BUGCHECK_STR: HANG
STACK_TEXT:

0006fbcc 7c82776b 77e418b2 00000064 00000000 ntdll!KiFastSystemCallRet

0006fbd0 77e418b2 00000064 00000000 00000000 ntdll!NtReadFile+0xc

0006fc38 77f65edb 00000064 0006fd04 0000021a kernel32!ReadFile+0x16c

0006fc64 77f65f82 00000064 0006fd04 0000021a advapi32!ScGetPipeInput+0x2a

0006fcd8 77f51ed9 00000064 0006fd04 0000021a advapi32!ScDispatcherLoop+0x51

0006ff3c 01004019 0100d5bc 010047a2 00000001 advapi32!StartServiceCtrlDispatcherW+0xe3

0006ff44 010047a2 00000001 00263fa0 00262be0 spoolsv!main+0xb

0006ffc0 77e6f23b 00000000 00000000 7ffd7000 spoolsv!mainCRTStartup+0x12f

0006fff0 00000000 0100468c 00000000 78746341 kernel32!BaseProcessStart+0x23
Stack trace collection shows several threads waiting for a critical section when allocating heap blocks or calling loader functions, for example:
0:000> ~*k
[...]
  20  Id: 540.71d0 Suspend: 1 Teb: 7ffa2000 Unfrozen

ChildEBP RetAddr

0597fa20 7c827d0b ntdll!KiFastSystemCallRet

0597fa24 7c83d236 ntdll!NtWaitForSingleObject+0xc

0597fa60 7c83d281 ntdll!RtlpWaitOnCriticalSection+0×1a3

0597fa80 7c82a264 ntdll!RtlEnterCriticalSection+0xa8

0597fca8 77c7e5cf ntdll!RtlAllocateHeap+0×313

0597fcbc 77c7e5a6 rpcrt4!AllocWrapper+0×1e

0597fcc8 77c82069 rpcrt4!operator new+0xd

0597fdf4 77c812a5 rpcrt4!LRPC_SCALL::LrpcMessageToRpcMessage+0xd0

0597fe20 77c88678 rpcrt4!LRPC_ADDRESS::DealWithLRPCRequest+0×66

0597ff84 77c88792 rpcrt4!LRPC_ADDRESS::ReceiveLotsaCalls+0×430

0597ff8c 77c8872d rpcrt4!RecvLotsaCallsWrapper+0xd

0597ffac 77c7b110 rpcrt4!BaseCachedThreadRoutine+0×9d

0597ffb8 77e64829 rpcrt4!ThreadStartRoutine+0×1b

0597ffec 00000000 kernel32!BaseThreadStart+0×34
  21  Id: 540.5b3c Suspend: 1 Teb: 7ff9f000 Unfrozen

ChildEBP RetAddr

090dfea0 7c827d0b ntdll!KiFastSystemCallRet

090dfea4 7c83d236 ntdll!NtWaitForSingleObject+0xc

090dfee0 7c83d281 ntdll!RtlpWaitOnCriticalSection+0×1a3

090dff00 7c81909b ntdll!RtlEnterCriticalSection+0xa8

090dffa8 77e4f920 ntdll!LdrShutdownThread+0×33

090dffb8 77e6482e kernel32!ExitThread+0×2f

090dffec 00000000 kernel32!BaseThreadStart+0×39
[...]
!cs command shows wait chains and signs of critical section corruption. Here is the commented output:
0:000> !cs -l -o -s

-----------------------------------------

DebugInfo          = 0x7c8877c0

Critical section   = 0×7c8877a0 (ntdll!LdrpLoaderLock+0×0)

LOCKED

LockCount          = 0×5

WaiterWoken        = No

OwningThread       = 0×00005a20

RecursionCount     = 0×1

LockSemaphore      = 0×184

SpinCount          = 0×00000000

OwningThread DbgId = ~25s

OwningThread Stack =

 ChildEBP RetAddr  Args to Child

 0568f42c 7c827d0b 7c83d236 00000da0 00000000 ntdll!KiFastSystemCallRet

 0568f430 7c83d236 00000da0 00000000 00000000 ntdll!NtWaitForSingleObject+0xc

 0568f46c 7c83d281 00000da0 00000004 00080000 ntdll!RtlpWaitOnCriticalSection+0×1a3

 0568f48c 7c82a264 00080608 7c82e6b4 0000008e ntdll!RtlEnterCriticalSection+0xa8

 0568f6b4 77e6427d 00080000 00000000 00000594 ntdll!RtlAllocateHeap+0×313

 0568f718 77e643a2 77e643d0 00020abc 00000000 kernel32!BasepComputeProcessPath+0xc2

 0568f758 77e65348 00000000 00000000 00000000 kernel32!BaseComputeProcessDllPath+0xe3

 0568f79c 77e6528f 0568f7b8 00000000 4dc5822c kernel32!GetModuleHandleForUnicodeString+0×2b

 0568fc14 77e65155 00000001 00000002 0568fc38 kernel32!BasepGetModuleHandleExW+0×17f

 0568fc2c 4dc4d554 0568fc38 003a0043 0057005c kernel32!GetModuleHandleW+0×29

 0568fe4c 4dc49a0a 4dc32328 00000001 0568fe80 MSCTFIME!GetSystemModuleHandleW+0×40

 0568fe5c 4dc49bc3 4dc5822c 4dc32328 4dc32380 MSCTFIME!GetFn+0×2e

 0568fe74 4dc49039 00000003 0568fea0 4dc49fbb MSCTFIME!TF_DllDetachInOther+0×2a

 0568fe80 4dc49fbb 4dc30000 00000003 00000000 MSCTFIME!DllMain+0×1d

 0568fea0 7c81a352 4dc30000 00000003 00000000 MSCTFIME!_DllMainCRTStartup+0×52

 0568fec0 7c819178 4dc49f69 4dc30000 00000003 ntdll!LdrpCallInitRoutine+0×14

 0568ff74 77e4f920 3533e0ec 00000000 0568ff98 ntdll!LdrShutdownThread+0xd2

 0568ff84 77e52868 00000000 3533e0ec 77e5bf51 kernel32!ExitThread+0×2f

 0568ff98 3530cd31 35100000 00000000 00000000 kernel32!FreeLibraryAndExitThread+0×40

WARNING: Stack unwind information not available. Following frames may be wrong.

 0568ffb8 77e64829 00001430 00000000 00000000 PrintDriverA!DllGetClassObject+0×1dcdb1

ntdll!RtlpStackTraceDataBase is NULL. Probably the stack traces are not enabled.
The thread #25 is blocked waiting for the critical section 00080608 but it also owns another critical section LdrpLoaderLock and blocks 5 other threads. Stack trace features PrintDriverA module.
-----------------------------------------

DebugInfo          = 0x7c887be0

Critical section   = 0×7c887740 (ntdll!FastPebLock+0×0)

LOCKED

LockCount          = 0×0

WaiterWoken        = No

OwningThread       = 0×00005a20

RecursionCount     = 0×1

LockSemaphore      = 0×868

SpinCount          = 0×00000000

OwningThread DbgId = ~25s

OwningThread Stack =

 ChildEBP RetAddr  Args to Child

 0568f42c 7c827d0b 7c83d236 00000da0 00000000 ntdll!KiFastSystemCallRet

 0568f430 7c83d236 00000da0 00000000 00000000 ntdll!NtWaitForSingleObject+0xc

 0568f46c 7c83d281 00000da0 00000004 00080000 ntdll!RtlpWaitOnCriticalSection+0×1a3

 0568f48c 7c82a264 00080608 7c82e6b4 0000008e ntdll!RtlEnterCriticalSection+0xa8

 0568f6b4 77e6427d 00080000 00000000 00000594 ntdll!RtlAllocateHeap+0×313

 0568f718 77e643a2 77e643d0 00020abc 00000000 kernel32!BasepComputeProcessPath+0xc2

 0568f758 77e65348 00000000 00000000 00000000 kernel32!BaseComputeProcessDllPath+0xe3

 0568f79c 77e6528f 0568f7b8 00000000 4dc5822c kernel32!GetModuleHandleForUnicodeString+0×2b

 0568fc14 77e65155 00000001 00000002 0568fc38 kernel32!BasepGetModuleHandleExW+0×17f

 0568fc2c 4dc4d554 0568fc38 003a0043 0057005c kernel32!GetModuleHandleW+0×29

 0568fe4c 4dc49a0a 4dc32328 00000001 0568fe80 MSCTFIME!GetSystemModuleHandleW+0×40

 0568fe5c 4dc49bc3 4dc5822c 4dc32328 4dc32380 MSCTFIME!GetFn+0×2e

 0568fe74 4dc49039 00000003 0568fea0 4dc49fbb MSCTFIME!TF_DllDetachInOther+0×2a

 0568fe80 4dc49fbb 4dc30000 00000003 00000000 MSCTFIME!DllMain+0×1d

 0568fea0 7c81a352 4dc30000 00000003 00000000 MSCTFIME!_DllMainCRTStartup+0×52

 0568fec0 7c819178 4dc49f69 4dc30000 00000003 ntdll!LdrpCallInitRoutine+0×14

 0568ff74 77e4f920 3533e0ec 00000000 0568ff98 ntdll!LdrShutdownThread+0xd2

 0568ff84 77e52868 00000000 3533e0ec 77e5bf51 kernel32!ExitThread+0×2f

 0568ff98 3530cd31 35100000 00000000 00000000 kernel32!FreeLibraryAndExitThread+0×40

WARNING: Stack unwind information not available. Following frames may be wrong.

 0568ffb8 77e64829 00001430 00000000 00000000 PrintDriverA!DllGetClassObject+0×1dcdb1

ntdll!RtlpStackTraceDataBase is NULL. Probably the stack traces are not enabled.
This is the same thread #25 but it also owns another critical section FastPebLock but this doesn’t block additional threads.
-----------------------------------------

DebugInfo          = 0x7c887c80

Critical section   = 0×00080608 (+0×80608)

LOCKED

LockCount          = 0×4

WaiterWoken        = No

OwningThread       = 0×0000a8c4

RecursionCount     = 0×1

LockSemaphore      = 0xDA0

SpinCount          = 0×00000fa0

OwningThread DbgId = ~22s

OwningThread Stack =

 ChildEBP RetAddr  Args to Child

 03456830 7739bf53 7739610a 00000000 00000000 ntdll!KiFastSystemCallRet

 03456868 7738965e 186403ba 00000000 00000001 user32!NtUserWaitMessage+0xc

 03456890 7739f762 77380000 05bdc880 00000000 user32!InternalDialogBox+0xd0

 03456b50 7739f047 03456cac 00000000 ffffffff user32!SoftModalMessageBox+0×94b

 03456ca0 7739eec9 03456cac 00000028 00000000 user32!MessageBoxWorker+0×2ba

 03456cf8 773d7d0d 00000000 0ae7cc20 02639ea8 user32!MessageBoxTimeoutW+0×7a

 03456d80 773c42c8 00000000 03456e14 03456df4 user32!MessageBoxTimeoutA+0×9c

 03456da0 773c42a4 00000000 03456e14 03456df4 user32!MessageBoxExA+0×1b

 03456dbc 6dfcf8c2 00000000 03456e14 03456df4 user32!MessageBoxA+0×45

 034575f8 6dfd05cf 03456e5a 03457624 77bc6cd5 compstui!FilterException+0×174

 03458584 6dfcff1e 02638dc8 00000000 03458c58 compstui!CallpfnPSUI+0×110

 034587f0 6dfd00a2 02638b40 026393f8 00000000 compstui!InsertPSUIPage+0×201

 03458848 7307c9ae 43440001 00000005 02118690 compstui!CPSUICallBack+0xed

 03458870 6dfd059a 0345888c 03458c58 7307c8da winspool!DevicePropertySheets+0xd4

 034588d4 6dfcff1e 026393f8 00000000 03458c58 compstui!CallpfnPSUI+0xdb

 03458b40 6dfd00a2 02638b40 02638b40 00000000 compstui!InsertPSUIPage+0×201

 03458b98 6dfd06a3 43440000 00000005 7307c8da compstui!CPSUICallBack+0xed

 03458bcc 6dfd0799 00000000 7307c8da 03458c58 compstui!DoCommonPropertySheetUI+0×74

 03458be4 730801c5 00000000 7307c8da 03458c58 compstui!CommonPropertySheetUIW+0×17

ntdll!RtlpStackTraceDataBase is NULL. Probably the stack traces are not enabled.
The thread #22 is blocked waiting for the message box but it also owns the critical section 00080608 we have seen above and the thread blocks 4 other threads.
Cannot read structure field value at 0x04ddbb64, error 0

Cannot determine if the critical section is locked or not.

-----------------------------------------

Critical section   = 0x04ddbb60 (+0x4DDBB60)

DebugInfo          = 0x01e10858

ntdll!RtlpStackTraceDataBase is NULL. Probably the stack traces are not enabled.

-----------------------------------------

DebugInfo          = 0x05b24d38

Critical section   = 0x0589de08 (PrintDriverB+0×49DE8)

LOCKED

LockCount          = 0xC5D3FFF

WaiterWoken        = Yes

OwningThread       = 0×00008487

RecursionCount     = 0×8DD5FF50

LockSemaphore      = 0×50CE8B00

SpinCount          = 0×878dd5ff
WARNING: critical section DebugInfo = 0x0080878d doesn't point back

to the DebugInfo found in the active critical sections list = 0x05b24d38.

The critical section was probably reused without calling DeleteCriticalSection.
ntdll!RtlpStackTraceDataBase is NULL. Probably the stack traces are not enabled.

ntdll!RtlpStackTraceDataBase is NULL. Probably the stack traces are not enabled.

-----------------------------------------

DebugInfo          = 0x05b24c98

Critical section   = 0x0589ddd8 (PrintDriverB+0x49DB8)

LOCKED

LockCount          = 0x1D38F6EE

WaiterWoken        = Yes

OwningThread       = 0x1c2444db

RecursionCount     = 0xD3FF50CE

LockSemaphore      = 0x8D04EC83

SpinCount          = 0x1cd9744f
WARNING: critical section DebugInfo = 0x8dffff73 doesn't point back

to the DebugInfo found in the active critical sections list = 0x05b24c98.

The critical section was probably reused without calling DeleteCriticalSection.
Cannot read structure field value at 0x8dffff75, error 0

ntdll!RtlpStackTraceDataBase is NULL. Probably the stack traces are not enabled.

ntdll!RtlpStackTraceDataBase is NULL. Probably the stack traces are not enabled.

-----------------------------------------

DebugInfo          = 0x05b24f40

Critical section   = 0x0589de28 (PrintDriverB+0x49E08)

LOCKED

LockCount          = 0x1D38F6EE

WaiterWoken        = Yes

OwningThread       = 0x1c2444db

RecursionCount     = 0xD3FF50CE

LockSemaphore      = 0x8D04EC83

SpinCount          = 0x00008c8f
WARNING: critical section DebugInfo = 0x8d242454 doesn't point back

to the DebugInfo found in the active critical sections list = 0x05b24f40.

The critical section was probably reused without calling DeleteCriticalSection.
Cannot read structure field value at 0x8d242456, error 0

ntdll!RtlpStackTraceDataBase is NULL. Probably the stack traces are not enabled.

ntdll!RtlpStackTraceDataBase is NULL. Probably the stack traces are not enabled.

-----------------------------------------

DebugInfo          = 0x05b24d10

Critical section   = 0x0589de08 (PrintDriverB+0x49DE8)

LOCKED

LockCount          = 0xC5D3FFF

WaiterWoken        = Yes

OwningThread       = 0x00008487

RecursionCount     = 0x8DD5FF50

LockSemaphore      = 0x50CE8B00

SpinCount          = 0x878dd5ff
WARNING: critical section DebugInfo = 0x0080878d doesn't point back

to the DebugInfo found in the active critical sections list = 0x05b24d10.

The critical section was probably reused without calling DeleteCriticalSection.
ntdll!RtlpStackTraceDataBase is NULL. Probably the stack traces are not enabled.

ntdll!RtlpStackTraceDataBase is NULL. Probably the stack traces are not enabled.

-----------------------------------------

DebugInfo          = 0x05b24ec8

Critical section   = 0x0589de28 (PrintDriverB+0x49E08)

LOCKED

LockCount          = 0x1D38F6EE

WaiterWoken        = Yes

OwningThread       = 0x1c2444db

RecursionCount     = 0xD3FF50CE

LockSemaphore      = 0x8D04EC83

SpinCount          = 0x00008c8f
WARNING: critical section DebugInfo = 0x8d242454 doesn't point back

to the DebugInfo found in the active critical sections list = 0x05b24ec8.

The critical section was probably reused without calling DeleteCriticalSection.
Cannot read structure field value at 0x8d242456, error 0

ntdll!RtlpStackTraceDataBase is NULL. Probably the stack traces are not enabled.

ntdll!RtlpStackTraceDataBase is NULL. Probably the stack traces are not enabled.

-----------------------------------------

DebugInfo          = 0x05b24cc0

Critical section   = 0x0589ddd8 (PrintDriverB+0x49DB8)

LOCKED

LockCount          = 0x1D38F6EE

WaiterWoken        = Yes

OwningThread       = 0x1c2444db

RecursionCount     = 0xD3FF50CE

LockSemaphore      = 0x8D04EC83

SpinCount          = 0x1cd9744f
WARNING: critical section DebugInfo = 0x8dffff73 doesn't point back

to the DebugInfo found in the active critical sections list = 0x05b24cc0.

The critical section was probably reused without calling DeleteCriticalSection.
Cannot read structure field value at 0x8dffff75, error 0

ntdll!RtlpStackTraceDataBase is NULL. Probably the stack traces are not enabled.

ntdll!RtlpStackTraceDataBase is NULL. Probably the stack traces are not enabled.
Here we see the recurrence of PrintDriverB module in the output that looks like corruption. Because the thread #22 heads the wait chain we look at its full stack trace:
0:000> ~22s; kL 100

eax=00465758 ebx=00000000 ecx=00467514 edx=00000001 esi=00467500 edi=00000000

eip=7c8285ec esp=03456834 ebp=03456868 iopl=0         nv up ei pl zr na pe nc

cs=001b  ss=0023  ds=0023  es=0023  fs=003b  gs=0000             efl=00000246

ntdll!KiFastSystemCallRet:

7c8285ec c3              ret

ChildEBP RetAddr

03456830 7739bf53 ntdll!KiFastSystemCallRet

03456868 7738965e user32!NtUserWaitMessage+0xc

03456890 7739f762 user32!InternalDialogBox+0xd0

03456b50 7739f047 user32!SoftModalMessageBox+0x94b

03456ca0 7739eec9 user32!MessageBoxWorker+0x2ba

03456cf8 773d7d0d user32!MessageBoxTimeoutW+0x7a

03456d80 773c42c8 user32!MessageBoxTimeoutA+0x9c

03456da0 773c42a4 user32!MessageBoxExA+0x1b

03456dbc 6dfcf8c2 user32!MessageBoxA+0×45

034575f8 6dfd05cf compstui!FilterException+0×174

03458584 6dfcff1e compstui!CallpfnPSUI+0×110

034587f0 6dfd00a2 compstui!InsertPSUIPage+0×201

03458848 7307c9ae compstui!CPSUICallBack+0xed

03458870 6dfd059a winspool!DevicePropertySheets+0xd4

034588d4 6dfcff1e compstui!CallpfnPSUI+0xdb

03458b40 6dfd00a2 compstui!InsertPSUIPage+0×201

03458b98 6dfd06a3 compstui!CPSUICallBack+0xed

03458bcc 6dfd0799 compstui!DoCommonPropertySheetUI+0×74

03458be4 730801c5 compstui!CommonPropertySheetUIW+0×17

03458c2c 73080f5d winspool!CallCommonPropertySheetUI+0×43

03459074 35145947 winspool!PrinterPropertiesNative+0×10c

034590c4 3513a045 PrintDriverA!DllGetClassObject+0×159c7

0345e9ac 35131819 PrintDriverA!DllGetClassObject+0xa0c5

0345ebdc 32020661 PrintDriverA!DllGetClassObject+0×1899

0345ec04 3201b171 PS5UI!HComOEMPrinterEvent+0×33

0345ec48 02117a79 PS5UI!DrvPrinterEvent+0×239

0345eea4 7308218c PrintDriverA!DrvPrinterEvent+0xf9

0345eef0 761542cc winspool!SpoolerPrinterEventNative+0×57

0345ef0c 76155fd6 localspl!SplDriverEvent+0×21

0345ef30 76144799 localspl!PrinterDriverEvent+0×46

0345f3f8 76144ab2 localspl!SplAddPrinter+0×5f3

0345f424 74070193 localspl!LocalAddPrinterEx+0×2e

0345f874 7407025c spoolss!AddPrinterExW+0×151

0345f890 0100792d spoolss!AddPrinterW+0×17

0345f8ac 01006762 spoolsv!YAddPrinter+0×75

0345f8d0 77c80193 spoolsv!RpcAddPrinter+0×37

0345f8f8 77ce33e1 rpcrt4!Invoke+0×30

0345fcf8 77ce35c4 rpcrt4!NdrStubCall2+0×299

0345fd14 77c7ff7a rpcrt4!NdrServerCall2+0×19

0345fd48 77c8042d rpcrt4!DispatchToStubInCNoAvrf+0×38

0345fd9c 77c80353 rpcrt4!RPC_INTERFACE::DispatchToStubWorker+0×11f

0345fdc0 77c811dc rpcrt4!RPC_INTERFACE::DispatchToStub+0xa3

0345fdfc 77c812f0 rpcrt4!LRPC_SCALL::DealWithRequestMessage+0×42c

0345fe20 77c88678 rpcrt4!LRPC_ADDRESS::DealWithLRPCRequest+0×127

0345ff84 77c88792 rpcrt4!LRPC_ADDRESS::ReceiveLotsaCalls+0×430

0345ff8c 77c8872d rpcrt4!RecvLotsaCallsWrapper+0xd

0345ffac 77c7b110 rpcrt4!BaseCachedThreadRoutine+0×9d

0345ffb8 77e64829 rpcrt4!ThreadStartRoutine+0×1b

0345ffec 00000000 kernel32!BaseThreadStart+0×34
There is PrintDriverA module on the stack trace. Notice that we also have FilterException function on the stack trace. It raises the suspicion bar. We proceed to examining MessageBoxA parameters:
0:022> kv 100

ChildEBP RetAddr  Args to Child

03456830 7739bf53 7739610a 00000000 00000000 ntdll!KiFastSystemCallRet

03456868 7738965e 186403ba 00000000 00000001 user32!NtUserWaitMessage+0xc

03456890 7739f762 77380000 05bdc880 00000000 user32!InternalDialogBox+0xd0

03456b50 7739f047 03456cac 00000000 ffffffff user32!SoftModalMessageBox+0x94b

03456ca0 7739eec9 03456cac 00000028 00000000 user32!MessageBoxWorker+0x2ba

03456cf8 773d7d0d 00000000 0ae7cc20 02639ea8 user32!MessageBoxTimeoutW+0x7a

03456d80 773c42c8 00000000 03456e14 03456df4 user32!MessageBoxTimeoutA+0x9c

03456da0 773c42a4 00000000 03456e14 03456df4 user32!MessageBoxExA+0x1b

03456dbc 6dfcf8c2 00000000 03456e14 03456df4 user32!MessageBoxA+0×45

034575f8 6dfd05cf 03456e5a 03457624 77bc6cd5 compstui!FilterException+0×174

[…]
0:022> da /c 90 03456e14

03456e14  “Function address 0×7c8100ca caused a protection fault. (exception code 0xc0000005). Some or all property page(s) may not be displayed.”
There was an exception indeed diagnosed by FilterException call. The exception is probably hidden somewhere on the raw stack:
0:022> !teb

TEB at 7ffde000

    ExceptionList:        03456d40

    StackBase:            03460000

    StackLimit:           03450000

    SubSystemTib:         00000000

    FiberData:            00001e00

    ArbitraryUserPointer: 00000000

    Self:                 7ffde000

    EnvironmentPointer:   00000000

    ClientId:             00000540 . 0000a8c4

    RpcHandle:            00000000

    Tls Storage:          00000000

    PEB Address:          7ffd7000

    LastErrorValue:       0

    LastStatusValue:      c0000022

    Count Owned Locks:    0

    HardErrorMode:        0
0:022> dds 03450000 03460000

03450000  00000000

03450004  00000000

03450008  00000000

0345000c  00000000

[...]

03457674  03458574

03457678  7c8315c2 ntdll!RtlDispatchException+0×91

0345767c  03457710

03457680  03458574

03457684  0345772c

03457688  034576ec

0345768c  6dfd0a54 compstui!_except_handler3

03457690  00080000

03457694  03457710

03457698  0269b640

0345769c  026afc38

034576a0  00080000

034576a4  00080000

034576a8  026afc38

034576ac  026b2008

034576b0  034576cc

034576b4  7c82a771 ntdll!RtlpCoalesceFreeBlocks+0×383

034576b8  00000249

034576bc  026b2008

034576c0  00080000

034576c4  026afc38

034576c8  00080000

034576cc  00000000

034576d0  00080000

034576d4  034577b4

034576d8  7c82a90a ntdll!RtlFreeHeap+0×6b0

034576dc  00080608

034576e0  7c829f59 ntdll!RtlFreeHeap+0×70f

034576e4  03457870

034576e8  00000000

034576ec  00000001

034576f0  03460000

034576f4  006afc38

034576f8  03457c14

034576fc  7c82855e ntdll!KiUserExceptionDispatcher+0xe

03457700  03450000

03457704  0345772c

03457708  03457710

0345770c  0345772c

03457710  c0000005

03457714  00000000

03457718  00000000

0345771c  7c8100ca ntdll!RtlAllocateHeap+0×7b3

03457720  00000002

03457724  00000001

03457728  026c663c

0345772c  0001003f

03457730  00000000

03457734  00000000

03457738  00000000

0345773c  00000000

03457740  00000000

03457744  00000000

03457748  ffff027f

0345774c  ffff0000

[…]
It finally looks like a heap corruption:
0:022> .cxr 0345772c

eax=00000b28 ebx=00005e69 ecx=026c663c edx=0269b648 esi=0269b640 edi=00080000

eip=7c8100ca esp=034579f8 ebp=03457c14 iopl=0 nv up ei pl nz ac pe nc

cs=001b ss=0023 ds=0023 es=0023 fs=003b gs=0000 efl=00010216

ntdll!RtlAllocateHeap+0×7b3:

7c8100ca 8901  mov     dword ptr [ecx],eax  ds:0023:026c663c=????????
0:022> kL 100

ChildEBP RetAddr

03457c14 77c0b66f ntdll!RtlAllocateHeap+0×7b3

03457c44 77c1581a gdi32!EnumFontsInternalW+0×63

03457c68 32014246 gdi32!EnumFontFamiliesW+0×1c

03457ce4 32019ab4 PS5UI!BPackItemFontSubstTable+0×95

03457cf4 32014a0f PS5UI!BPackPrinterPropertyItems+0×19

03457d0c 32019e2b PS5UI!PPrepareDataForCommonUI+0×1af

0345813c 02118a57 PS5UI!DrvDevicePropertySheets+0×1dc

WARNING: Stack unwind information not available. Following frames may be wrong.

03458520 6dfd059a PrintDriverA!DrvDevicePropertySheets+0×3c7

03458584 6dfcff1e compstui!CallpfnPSUI+0xdb

034587f0 6dfd00a2 compstui!InsertPSUIPage+0×201

03458848 7307c9ae compstui!CPSUICallBack+0xed

03458870 6dfd059a winspool!DevicePropertySheets+0xd4

034588d4 6dfcff1e compstui!CallpfnPSUI+0xdb

03458b40 6dfd00a2 compstui!InsertPSUIPage+0×201

03458b98 6dfd06a3 compstui!CPSUICallBack+0xed

03458bcc 6dfd0799 compstui!DoCommonPropertySheetUI+0×74

03458be4 730801c5 compstui!CommonPropertySheetUIW+0×17

03458c2c 73080f5d winspool!CallCommonPropertySheetUI+0×43

03459074 35145947 winspool!PrinterPropertiesNative+0×10c

034590c4 3513a045 PrintDriverA!DllGetClassObject+0×159c7

0345e9ac 35131819 PrintDriverA!DllGetClassObject+0xa0c5

0345ebdc 32020661 PrintDriverA!DllGetClassObject+0×1899

0345ec04 3201b171 PS5UI!HComOEMPrinterEvent+0×33

0345ec48 02117a79 PS5UI!DrvPrinterEvent+0×239

0345eea4 7308218c PrintDriverA!DrvPrinterEvent+0xf9

0345eef0 761542cc winspool!SpoolerPrinterEventNative+0×57

0345ef0c 76155fd6 localspl!SplDriverEvent+0×21

0345ef30 76144799 localspl!PrinterDriverEvent+0×46

0345f3f8 76144ab2 localspl!SplAddPrinter+0×5f3

0345f424 74070193 localspl!LocalAddPrinterEx+0×2e

0345f874 7407025c spoolss!AddPrinterExW+0×151

0345f890 0100792d spoolss!AddPrinterW+0×17

0345f8ac 01006762 spoolsv!YAddPrinter+0×75

0345f8d0 77c80193 spoolsv!RpcAddPrinter+0×37

0345f8f8 77ce33e1 rpcrt4!Invoke+0×30

0345fcf8 77ce35c4 rpcrt4!NdrStubCall2+0×299

0345fd14 77c7ff7a rpcrt4!NdrServerCall2+0×19

0345fd48 77c8042d rpcrt4!DispatchToStubInCNoAvrf+0×38

0345fd9c 77c80353 rpcrt4!RPC_INTERFACE::DispatchToStubWorker+0×11f

0345fdc0 77c811dc rpcrt4!RPC_INTERFACE::DispatchToStub+0xa3

0345fdfc 77c812f0 rpcrt4!LRPC_SCALL::DealWithRequestMessage+0×42c

0345fe20 77c88678 rpcrt4!LRPC_ADDRESS::DealWithLRPCRequest+0×127

0345ff84 77c88792 rpcrt4!LRPC_ADDRESS::ReceiveLotsaCalls+0×430

0345ff8c 77c8872d rpcrt4!RecvLotsaCallsWrapper+0xd

0345ffac 77c7b110 rpcrt4!BaseCachedThreadRoutine+0×9d

0345ffb8 77e64829 rpcrt4!ThreadStartRoutine+0×1b

0345ffec 00000000 kernel32!BaseThreadStart+0×34
lmt command shows many loaded print drivers but we advise the fans of driver elimination to remove or upgrade PrintDriverB and PrintDriveA. We also advise to enable full page heap on the spooler service to find the direct offender.
- Dmitry Vostokov @ DumpAnalysis.org + TraceAnalysis.org -
One common question is to how determine a service name from kernel memory dump where PEB information is not available (!peb). For example, there are plenty of svchost.exe processes running and one has a handle leak. I’m looking for a good simple method and in the mean time I suggested to use the following empirical data:
1. Look at driver modules on stack traces (e.g. termdd)
2. Look at the relative position of svchost.exe in the list of processes that reflects service startup dependency (!process 0 0)
3. Execution residue and string pointers on thread raw stacks (WinDbg script)
4. Process handle table (usually available for the current process according to my experience)
5. The number of threads and distribution of modules on thread stack traces (might require reference stack traces)
6. IRP information (e.g. a driver, device and file objects), for example:
THREAD fffffa800c21fbb0  Cid 0264.4ba4  Teb: 000007fffff92000 Win32Thread: fffff900c2001d50 WAIT: (WrQueue) UserMode Alertable

    fffffa800673f330  QueueObject

IRP List:

fffffa800c388010: (0006,0478) Flags: 00060070  Mdl: 00000000

Not impersonating

DeviceMap                 fffff88000006160

Owning Process            fffffa8006796c10       Image:         svchost.exe

Attached Process          N/A            Image:         N/A

Wait Start TickCount      30553196       Ticks: 1359 (0:00:00:21.200)

Context Switch Count      175424                 LargeStack

UserTime                  00:00:05.834

KernelTime                00:00:32.541

Win32 Start Address 0x0000000077a77cb0

Stack Init fffffa60154c6db0 Current fffffa60154c6820

Base fffffa60154c7000 Limit fffffa60154bf000 Call 0

Priority 10 BasePriority 8 PriorityDecrement 0 IoPriority 2 PagePriority 5

Child-SP          RetAddr           Call Site

fffffa60`154c6860 fffff800`01ab20fa nt!KiSwapContext+0x7f

fffffa60`154c69a0 fffff800`01ab55a4 nt!KiSwapThread+0x13a

fffffa60`154c6a10 fffff800`01d17427 nt!KeRemoveQueueEx+0x4b4

fffffa60`154c6ac0 fffff800`01ae465b nt!IoRemoveIoCompletion+0x47

fffffa60`154c6b40 fffff800`01aaf933 nt!NtWaitForWorkViaWorkerFactory+0x1fe

fffffa60`154c6c20 00000000`77aa857a nt!KiSystemServiceCopyEnd+0x13 (TrapFrame @ fffffa60`154c6c20)

00000000`04e7fb58 00000000`00000000 0x77aa857a
3: kd> !irp fffffa800c388010

Irp is active with 6 stacks 6 is current (= 0xfffffa800c388248)

 No Mdl: System buffer=fffffa800871b210: Thread fffffa800c21fbb0:  Irp stack trace.

     cmd  flg cl Device   File     Completion-Context

 [  0, 0]   0  0 00000000 00000000 00000000-00000000
   Args: 00000000 00000000 00000000 00000000

 [  0, 0]   0  0 00000000 00000000 00000000-00000000
   Args: 00000000 00000000 00000000 00000000

 [  0, 0]   0  0 00000000 00000000 00000000-00000000
   Args: 00000000 00000000 00000000 00000000

 [  0, 0]   0  0 00000000 00000000 00000000-00000000
   Args: 00000000 00000000 00000000 00000000

 [  0, 0]   0  0 00000000 00000000 00000000-00000000
   Args: 00000000 00000000 00000000 00000000

>[  e, 0]   5  1 fffffa8006018060 fffffa8007bf0e60 00000000-00000000    pending

        \Driver\rdpdr

   Args: 00000100 00000000 00090004 00000000
3: kd> !fileobj fffffa8007bf0e60
\TSCLIENT\SCARD\14
Device Object: 0xfffffa8006018060   \Driver\rdpdr

Vpb is NULL

Access: Read Write SharedRead SharedWrite
Flags:  0x44000

 Cleanup Complete

 Handle Created
FsContext: 0xfffff8801807c010 FsContext2: 0xfffff8801807c370

CurrentByteOffset: 0

Cache Data:

  Section Object Pointers: fffffa800c50fdc8

  Shared Cache Map: 00000000
Any other ideas are appreciated. Please comment.
- Dmitry Vostokov @ DumpAnalysis.org + TraceAnalysis.org -
I’ve decided to adapt archaeological classificatory framework (using my favourite method of inquiry: metaphorical bijectionism) to lay out foundations for yet another attempt to classify DA+TA patterns):
Attribute ↔ Pattern 2
Artefact ↔ Component Artefact1
Assemblage ↔ Component Assemblage
Culture ↔ Memory System Culture

1 Can be either a component-generated artefact or a component like a module or symbol file
2 Typical examples of memory system cultures are Windows, UNIX or even “Multiplatform”
I propose a word Memoarchaeological for such a framework and Memoarchaeology for a branch of Memoretics that studies saved computer memory artifacts from past computations (as opposed to live memory).
Note: In one of the forthcoming issues of Debugged! MZ/PE magazine there will be presented yet another classificatory scheme.
- Dmitry Vostokov @ DumpAnalysis.org + TraceAnalysis.org -
Today we introduce an icon for Insufficient Memory (control blocks) pattern:
B/W
![]()
Color
![]()
- Dmitry Vostokov @ DumpAnalysis.org + TraceAnalysis.org -
Forthcoming CARE and STARE online systems additionally aim to provide software behaviour pattern identification via debugger log and trace analysis and suggest possible software troubleshooting patterns. The purpose of these post series is to provide high level overview of possible patterns of software behavior and how they can be recognised and analyzed. This work started in October, 2006 with the identification of computer memory patterns and later continued with software trace patterns. Bringing all of them under a unified linked framework seems quite natural to me.
- Dmitry Vostokov @ DumpAnalysis.org + TraceAnalysis.org -
Today we introduce an icon for Insufficient Memory (physical memory) pattern:
B/W
![]()
Color
![]()
- Dmitry Vostokov @ DumpAnalysis.org + TraceAnalysis.org -