Bugtation No.22
Saturday, September 13th, 2008“One can best feel in dealing with” systems “how primitive” debugging “still is.”
Albert Einstein, Communication to Leó Szilárd
- Dmitry Vostokov @ DumpAnalysis.org -
“One can best feel in dealing with” systems “how primitive” debugging “still is.”
Albert Einstein, Communication to Leó Szilárd
- Dmitry Vostokov @ DumpAnalysis.org -
Dealing with a problem today where NTSD failed to save a dump file either because of improper configuration for a default postmortem debugger or for other reasons I advised to use ADPlus from Debugging Tools for Windows in crash mode but found that I haven’t yet written about it. In the past I didn’t recommend ADPlus because no one wanted to install something extra on production environments.
I had to show how ADPlus works for crashes because the usual Microsoft article was too big for an immediate grasp:
How to use ADPlus to troubleshoot “hangs” and “crashes”
Here is the quick polished tutorial:
1. Download and install Debugging Tools for Windows appropriate for your application or service platform. For example, if your service is 32-bit but runs on x64 you need to download 32-bit package. Refer to http://www.windbg.org for quick download links.
2. Get ready for the test and download TesDefaultDebugger package.
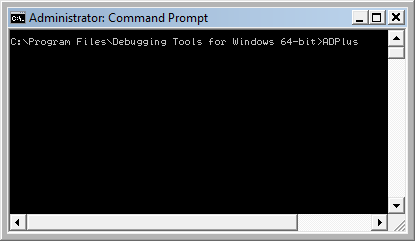
3. Open a command prompt elevated as Administrator and cd to Debugging Tools for Windows installation folder.
4. Run ADPlus command:
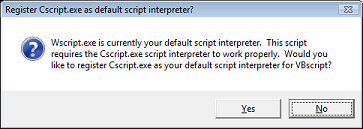
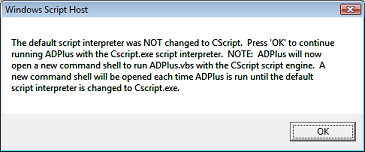
5. Skip any warnings related to script interpreter if any:
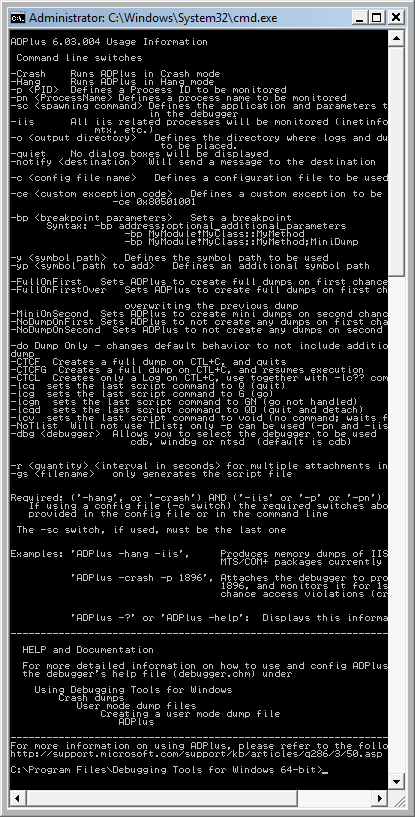
6. Another command line window appears with ADPlus switches:
7. Close it, go back to the first command line window we used to launch-test ADPlus and type this command:
ADPlus -crash -pn TestDefaultDebugger64.exe
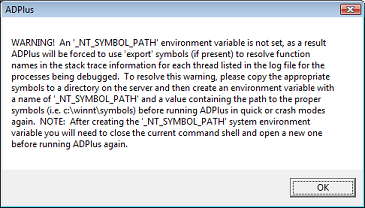
8. Skip warnings from step 5 if any and the symbol path warning if it appears too:
9. The second command line window is opened with the following expected output because we didn’t run TestDefaultDebugger64.exe:
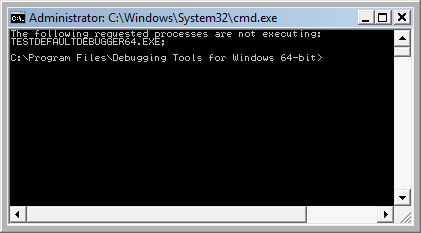
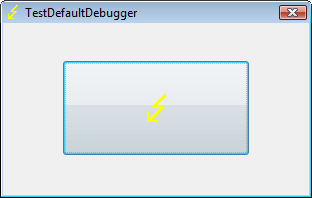
10. Close it and launch TestDefaultDebugger64.exe from the package downloaded in step 2:
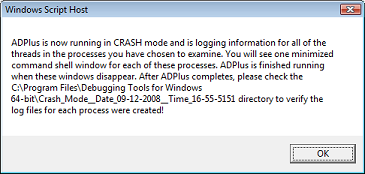
11. Go back to the first command line window and repeat the command from step 7. You can also specify PID by -p <PID> instead of -pn <Name> option. Skip warnings from steps 5 and 8 if any and you would see the following message showing where ADPlus will store logs and memory dumps if any:
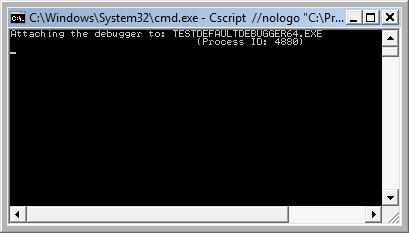
There are also 2 additional command line windows appear. One is showing which PID the debugger was attached to:
and the other showing the output of attached console debugger, CDB by default:
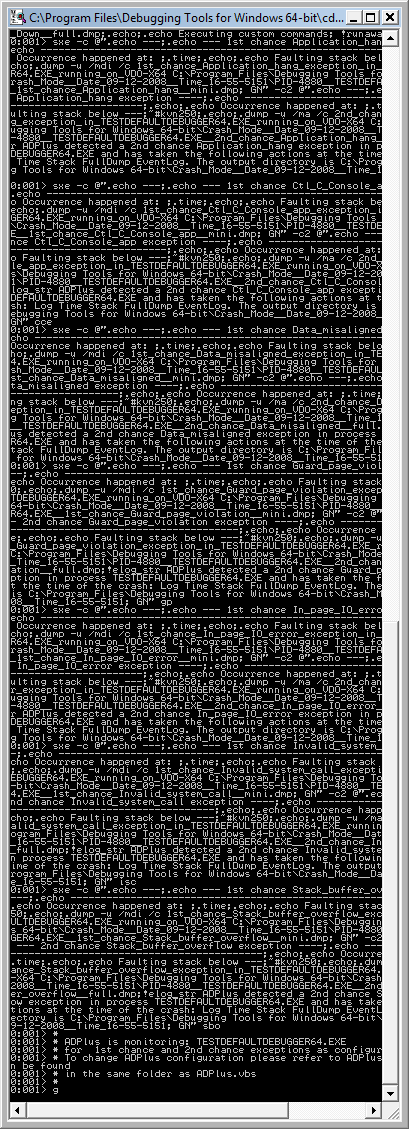
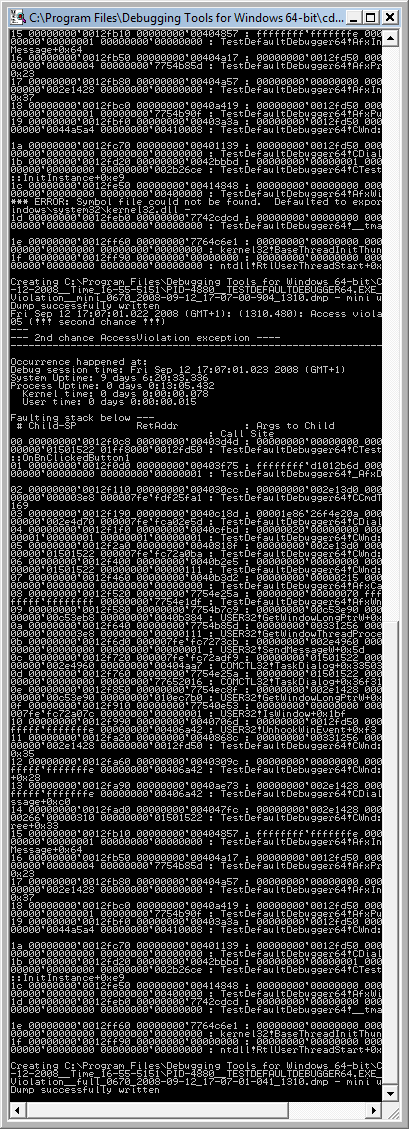
12. We can dismiss the message from the previous step and wait for the crash to occur when we push the big button on TestDefaultDebugger window from step 10. We see the crash instantaneously in debugger console window if it is still running:
The following message box might appear and that depends on AEDebug registry key and WER settings which are beyond the scope of this post:
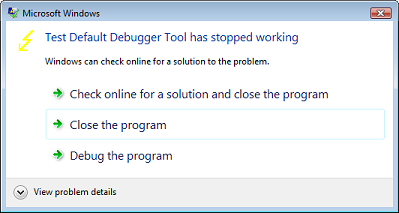
In case it appears you can simply choose to close the program.
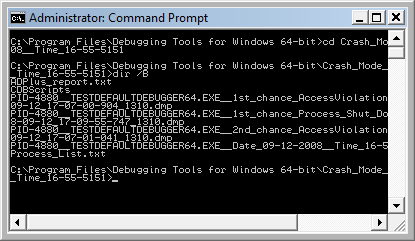
13. That’s it. All files appear in this folder:
C:\Program Files\Debugging Tools for Windows 64-bit\Crash_Mode__Date_09-12-2008__Time_16-55-5151:
- Dmitry Vostokov @ DumpAnalysis.org -
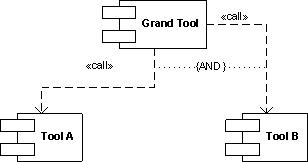
Usually after writing and using a tool we think about an extension of it or we find another tool that is suitable as that extension. In such cases it is better to reuse existing components and adapt the former tool to use the latter. Tool Chain is a good pattern name here. A programming analogy could be a compiler and linker:
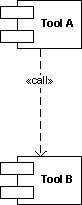
Typical example could be a logging tool that now acquires log viewer functionality by implementing a button that launches a separate log viewer or vice versa, a log viewer that can now do logging. Another simple example is a command file that launches different tools in a sequence. The tools might not be related by the data they produce and operate upon: this not the same as well-known architectural Filters and Pipes pattern. What is important is the fact that tools are related buy overall tool chain goal, for example, to debug problems by recording and analyzing log files or monitor some process activity and periodically create memory dumps:
- Dmitry Vostokov @ DumpAnalysis.org -
“I like people who can do” debugging.
Ralph Waldo Emerson, Journals
- Dmitry Vostokov @ DumpAnalysis.org -
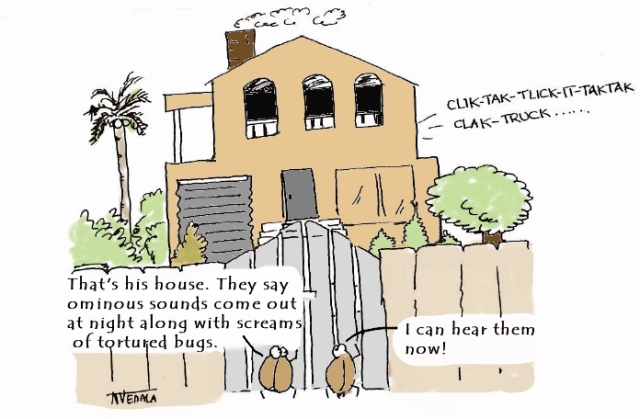
New cartoon and a word “bugxorcist” from Narasimha Vedala (click on it to enlarge):
Bugs At The Gate
- Dmitry Vostokov @ DumpAnalysis.org -
“Crash dumps are fossils” of computations.
Thomas Monahan and Dmitry Vostokov, Crash Dump Analysis for System Administrators and Support Engineers (Chapter 1: The Origin of Crash Dumps)
- Dmitry Vostokov @ DumpAnalysis.org -
Dynamic memory allocation architecture usually consists of different layers where the lower layers provide support for the upper ones and some general layers can be combined or omitted like in TCP/IP implementation of OSI reference model:
1a. Custom memory management library.
1b. Runtime language support (malloc/free, new/delete, gc).
1c. OS dynamic memory support (HeapAlloc/HeapFree, ExAllocatePool/ExFreePool).
2. OS virtual and/or segmented memory infrastructure support (VirtualAlloc/VirtualFree).
3. OS hardware memory layer and storage support.
We can call it DMI (Dynamic Memory Infrastructure) and this can be summarized on the following diagram:
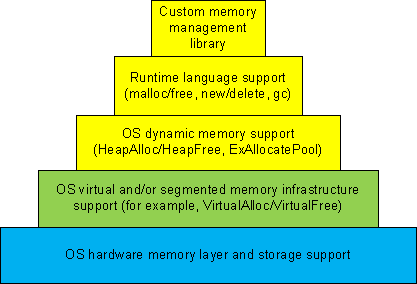
First-order memory leaks happen when an application uses layers 1a, 1b or 1c and doesn’t free allocated memory. Typical pattern examples include:
What we cover here are second-order leaks in layers 2 an 3. These include cases when an application frees memory but the underlying supporting layer doesn’t due to its design or factors like fragmentation. Consider an example of a Windows service that undergone committed memory increase from 600Mb to almost 1.2Gb during peak hours and then remained at that size even when no activity happened afterwards. We can examine virtual memory statistics using !address WinDbg command from 3 sampled memory dumps:
Before peak hours:
-------------------- Usage SUMMARY --------------------------

    TotSize (      KB)   Pct(Tots) Pct(Busy)   Usage

    734d000 (  118068) : 05.63%    07.50%    : RegionUsageIsVAD

   1ff11000 (  523332) : 24.96%    00.00%    : RegionUsageFree

    4352000 (   68936) : 03.29%    04.38%    : RegionUsageImage

    5a00000 (   92160) : 04.39%    05.86%    : RegionUsageStack

      5a000 (     360) : 00.02%    00.02%    : RegionUsageTeb

   4efe3000 ( 1294220) : 61.72%    82.24%    : RegionUsageHeap

          0 (       0) : 00.00%    00.00%    : RegionUsagePageHeap

       1000 (       4) : 00.00%    00.00%    : RegionUsagePeb

       1000 (       4) : 00.00%    00.00%    : RegionUsageProcessParametrs

       1000 (       4) : 00.00%    00.00%    : RegionUsageEnvironmentBlock

       Tot: 7fff0000 (2097088 KB) Busy: 600df000 (1573756 KB)
-------------------- Type SUMMARY --------------------------

    TotSize (      KB)   Pct(Tots)  Usage

   1ff11000 (  523332) : 24.96%   : <free>

    4352000 (   68936) : 03.29%   : MEM_IMAGE

     b78000 (   11744) : 00.56%   : MEM_MAPPED

   5b215000 ( 1493076) : 71.20%   : MEM_PRIVATE
-------------------- State SUMMARY --------------------------

    TotSize (      KB)   Pct(Tots)  Usage

   25e50000 (  620864) : 29.61%   : MEM_COMMIT

   1ff11000 (  523332) : 24.96%   : MEM_FREE

   3a28f000 (  952892) : 45.44%   : MEM_RESERVE
During peak hours:
-------------------- Usage SUMMARY --------------------------

  TotSize ( KB) Pct(Tots) Pct(Busy) Usage

  734d000 ( 118068) : 05.63% 07.49% : RegionUsageIsVAD

  1fd0f000 ( 521276) : 24.86% 00.00% : RegionUsageFree

  4352000 ( 68936) : 03.29% 04.37% : RegionUsageImage

  5c00000 ( 94208) : 04.49% 05.98% : RegionUsageStack

  5c000 ( 368) : 00.02% 00.02% : RegionUsageTeb

4efe3000 ( 1294220) : 61.72% 82.13% : RegionUsageHeap

  0 ( 0) : 00.00% 00.00% : RegionUsagePageHeap

  1000 ( 4) : 00.00% 00.00% : RegionUsagePeb

  1000 ( 4) : 00.00% 00.00% : RegionUsageProcessParametrs

  1000 ( 4) : 00.00% 00.00% : RegionUsageEnvironmentBlock

  Tot: 7fff0000 (2097088 KB) Busy: 602e1000 (1575812 KB)
-------------------- Type SUMMARY --------------------------

  TotSize ( KB) Pct(Tots) Usage

  1fd0f000 ( 521276) : 24.86% :

  4352000 ( 68936) : 03.29% : MEM_IMAGE

  b78000 ( 11744) : 00.56% : MEM_MAPPED

  5b417000 ( 1495132) : 71.30% : MEM_PRIVATE
-------------------- State SUMMARY --------------------------

  TotSize ( KB) Pct(Tots) Usage

41498000 ( 1069664) : 51.01% : MEM_COMMIT

  1fd0f000 ( 521276) : 24.86% : MEM_FREE

  1ee49000 ( 506148) : 24.14% : MEM_RESERVE
After peak hours:
-------------------- Usage SUMMARY --------------------------

    TotSize (      KB)   Pct(Tots) Pct(Busy)   Usage

    734d000 (  118068) : 05.63%    07.49%    : RegionUsageIsVAD

   1fd0f000 (  521276) : 24.86%    00.00%    : RegionUsageFree

    4352000 (   68936) : 03.29%    04.37%    : RegionUsageImage

    5c00000 (   94208) : 04.49%    05.98%    : RegionUsageStack

      5c000 (     368) : 00.02%    00.02%    : RegionUsageTeb

   4efe3000 ( 1294220) : 61.72%    82.13%    : RegionUsageHeap

          0 (       0) : 00.00%    00.00%    : RegionUsagePageHeap

       1000 (       4) : 00.00%    00.00%    : RegionUsagePeb

       1000 (       4) : 00.00%    00.00%    : RegionUsageProcessParametrs

       1000 (       4) : 00.00%    00.00%    : RegionUsageEnvironmentBlock

       Tot: 7fff0000 (2097088 KB) Busy: 602e1000 (1575812 KB)
-------------------- Type SUMMARY --------------------------

    TotSize (      KB)   Pct(Tots)  Usage

   1fd0f000 (  521276) : 24.86%   : <free>

    4352000 (   68936) : 03.29%   : MEM_IMAGE

     b78000 (   11744) : 00.56%   : MEM_MAPPED

   5b417000 ( 1495132) : 71.30%   : MEM_PRIVATE
-------------------- State SUMMARY --------------------------

    TotSize (      KB)   Pct(Tots)  Usage

   4505d000 ( 1130868) : 53.93%   : MEM_COMMIT

   1fd0f000 (  521276) : 24.86%   : MEM_FREE

   1b284000 (  444944) : 21.22%   : MEM_RESERVE
We see that in every memory dump the amount of process heap is the same 1.2Gb but during peak hours the amount of committed memory increased by 20% and remained the same even after. At the same time if we look at process heap statistics we would see the increase of free heap KB and blocks and this means that allocated memory was freed after peak hours but underlying virtual memory ranges were not decommitted and fragmentation increased by 25%.
Before peak hours:
0:000> !heap -s

LFH Key : 0x07262959

  Heap     Flags   Reserv  Commit  Virt   Free  List   UCR  Virt  Lock  Fast

                    (k)     (k)    (k)     (k) length      blocks cont. heap

[...]

00310000 00001002 1255320 512712 1177236 260583 45362 41898 2 3751a5 L

  External fragmentation 50 % (45362 free blocks)

  Virtual address fragmentation 56 % (41898 uncommited ranges)

  Lock contention 3625381

[…]
During peak hours:
0:000> !heap -s

LFH Key : 0x07262959

  Heap     Flags   Reserv  Commit  Virt   Free  List   UCR  Virt  Lock  Fast

                    (k)     (k)    (k)     (k) length      blocks cont. heap

[...]

00310000 00001002 1255320 961480 1249548 105378 0 16830 2 453093 L

  Virtual address fragmentation 23 % (16830 uncommited ranges)

  Lock contention 4534419

[…]
After peak hours:
0:000> !heap -s

LFH Key : 0x07262959

  Heap     Flags   Reserv  Commit  Virt   Free  List   UCR  Virt  Lock  Fast

                    (k)     (k)    (k)     (k) length      blocks cont. heap

[...]

00310000 00001002 1255320 1022648 1224344 772682 264787 17512 2 580634 L

  External fragmentation 75 % (264787 free blocks)

  Virtual address fragmentation 16 % (17512 uncommited ranges)

  Lock contention 5768756

[…]
Another example would be custom memory management library that by design never releases virtual memory allocated to accommodate the increased number of allocation requests after all of them are freed.
- Dmitry Vostokov @ DumpAnalysis.org -
“A perfectly healthy” program “, it is true, is extremely rare.”
Henry David Thoreau, The Journal of Henry D. Thoreau
- Dmitry Vostokov @ DumpAnalysis.org -
New cartoon from Narasimha Vedala (click on it to enlarge):
Bugs Trying To Bell The Cat…

- Dmitry Vostokov @ DumpAnalysis.org -
After writing about large heap allocations I updated the sample chapter for Windows Debugging Notebook:
- Dmitry Vostokov @ DumpAnalysis.org -
Engineers’ source codes “reveal their characters.”
Luc de Clapiers, marquis de Vauvenargues, Reflexions and Maximes
- Dmitry Vostokov @ DumpAnalysis.org -
Previously I wrote about security options in WinDbg but recently discovered that PEB is included with sensitive data for full user dumps despite stack and page cleaning and removing module paths. Module paths are removed indeed from lmv command output but _PEB.Ldr lists contain full module path information:
0:000> dt _PEB Ldr

ntdll!_PEB

   +0x018 Ldr : Ptr64 _PEB_LDR_DATA
0:000> dt _PEB_LDR_DATA

ntdll!_PEB_LDR_DATA

   +0x000 Length           : Uint4B

   +0x004 Initialized      : UChar

   +0x008 SsHandle         : Ptr64 Void

   +0×010 InLoadOrderModuleList : _LIST_ENTRY

   +0×020 InMemoryOrderModuleList : _LIST_ENTRY

   +0×030 InInitializationOrderModuleList : _LIST_ENTRY

   +0×040 EntryInProgress  : Ptr64 Void
0:000> !peb

PEB at 000007fffffdb000

[...]
You can see this in the dump sample saved with /r and /R options:
ftp://dumpanalysis.org/pub/LargeHeapAllocations.zip
The only options I see currently are:
- Custom minidumps: do not save process dumps containing full user space with /ma or /mf option for .dump command
- Include PEB but erase specific sections and regions pointed to like environment blocks. See the previous Data Hiding in Crash Dumps post.
- Erase specific ASCII or UNICODE fragments manually using any binary editor. This was done for the dump file above.
Do not send dumps but logs. See All at once: postmortem logs and dump files.
Anyway manual inspection of a dump saved with security options is recommended before sending it.
- Dmitry Vostokov @ DumpAnalysis.org -
New cartoon from Narasimha Vedala provides insight into Dr. Debugalov’s embedded programming hobby:
Dr. Debugalov tests his new invention “BugSlasher” the fuzzy logic bug hunting robot.

- Dmitry Vostokov @ DumpAnalysis.org -
“A new” bugfix “is often a” new “error.”
Malesherbes, Pensées et maximes
- Dmitry Vostokov @ DumpAnalysis.org -
I needed to check some data structures and how they change in the case of heap memory leaks and wrote a very small C program that was allocating memory in a loop using malloc function. The VM size was growing very fast and I saved process memory dumps at 200Mb and 500Mb. When checking heap segments I noticed that they had not increased although the process was allocating 0×1000000 chunks of heap memory:
0:000> !heap 0 0

Index   Address  Name      Debugging options enabled

  1:   00260000

    Segment at 0000000000260000 to 0000000000360000 (00008000 bytes committed)

  2:   00360000

    Segment at 0000000000360000 to 0000000000370000 (00004000 bytes committed)

  3:   00440000

    Segment at 0000000000440000 to 0000000000450000 (00010000 bytes committed)

    Segment at 0000000000450000 to 0000000000550000 (00021000 bytes committed)

  4:   00560000

    Segment at 0000000000560000 to 0000000000570000 (00010000 bytes committed)

    Segment at 0000000000570000 to 0000000000670000 (0003a000 bytes committed)
I was puzzled because inspection of virtual memory showed those chunks as belonging to heap regions:
0:000> !address

[...]

    0000000009700000 : 0000000009700000 - 0000000001002000

                    Type     00020000 MEM_PRIVATE

                    Protect  00000004 PAGE_READWRITE

                    State    00001000 MEM_COMMIT

                    Usage    RegionUsageHeap

                    Handle   0000000000560000

    000000000a702000 : 000000000a702000 - 000000000000e000

                    Type     00000000

                    Protect  00000001 PAGE_NOACCESS

                    State    00010000 MEM_FREE

                    Usage    RegionUsageFree

    000000000a710000 : 000000000a710000 - 0000000001002000

                    Type     00020000 MEM_PRIVATE

                    Protect  00000004 PAGE_READWRITE

                    State    00001000 MEM_COMMIT

                    Usage    RegionUsageHeap

                    Handle   0000000000560000

    000000000b712000 : 000000000b712000 - 0000000004aee000

                    Type     00000000

                    Protect  00000001 PAGE_NOACCESS

                    State    00010000 MEM_FREE

                    Usage    RegionUsageFree

[…]
And then I recalled that large allocations for a process heap go to a separate linked list:
0:000> !peb

PEB at 000007fffffdb000
0:000> dt _PEB 000007fffffdb000

ntdll!_PEB

[...]

   +0x0f0 ProcessHeaps     : 0×00000000`77fa3460  -> 0×00000000`00260000

[..]
0:000> dq 0×00000000`77fa3460

00000000`77fa3460  00000000`00260000 00000000`00360000

00000000`77fa3470  00000000`00440000 00000000`00560000

00000000`77fa3480  00000000`00000000 00000000`00000000

00000000`77fa3490  00000000`00000000 00000000`00000000

00000000`77fa34a0  00000000`00000000 00000000`00000000

00000000`77fa34b0  00000000`00000000 00000000`00000000

00000000`77fa34c0  00000000`00000000 00000000`00000000

00000000`77fa34d0  00000000`00000000 00000000`00000000
0:000> dt _HEAP 00000000`00260000

ntdll!_HEAP

[...]

   +0×090 VirtualAllocdBlocks : _LIST_ENTRY [ 0×00000000`00260090 - 0×260090 ]

[…]
0:000> dl 00000000`00260000+90 10 2

00000000`00260090  00000000`00260090 00000000`00260090
0:000> dl 00000000`00360000+90 10 2

00000000`00360090  00000000`00360090 00000000`00360090
0:000> dl 00000000`00440000+90 10 2

00000000`00440090  00000000`00440090 00000000`00440090
0:000> dl 00000000`00560000+90 10 2

00000000`00560090  00000000`00670000 00000000`0a710000

00000000`00670000  00000000`01680000 00000000`00560090

00000000`01680000  00000000`02690000 00000000`00670000

00000000`02690000  00000000`036a0000 00000000`01680000

00000000`036a0000  00000000`046b0000 00000000`02690000

00000000`046b0000  00000000`056c0000 00000000`036a0000

00000000`056c0000  00000000`066d0000 00000000`046b0000

00000000`066d0000  00000000`076e0000 00000000`056c0000

00000000`076e0000  00000000`086f0000 00000000`066d0000

00000000`086f0000  00000000`09700000 00000000`076e0000

00000000`09700000  00000000`0a710000 00000000`086f0000

00000000`0a710000  00000000`00560090 00000000`09700000
We see that the last process heap has large allocations directly from virtual memory, for example:
0:000> !address 00000000`0a710000

    000000000a710000 : 000000000a710000 - 0000000001002000

                    Type     00020000 MEM_PRIVATE

                    Protect  00000004 PAGE_READWRITE

                    State    00001000 MEM_COMMIT

                    Usage    RegionUsageHeap

                    Handle   0000000000560000
Actually if I used heap statistics option for !heap command I would see these large allocations:
0:000> !heap -s

LFH Key                   : 0x000000a4e8aa078c

          Heap     Flags   Reserv  Commit  Virt   Free  List   UCR  Virt  Lock  Fast

                            (k)     (k)    (k)     (k) length      blocks cont. heap

0000000000260000 00000002    1024     32     32      7     1     1    0      0   L

0000000000360000 00008000      64     16     16     12     1     1    0      0

0000000000440000 00001002    1088    196    196      4     1     1    0      0   LFH

Virtual block: 0000000000670000 - 0000000000670000

Virtual block: 0000000001680000 - 0000000001680000

Virtual block: 0000000002690000 - 0000000002690000

Virtual block: 00000000036a0000 - 00000000036a0000

Virtual block: 00000000046b0000 - 00000000046b0000

Virtual block: 00000000056c0000 - 00000000056c0000

Virtual block: 00000000066d0000 - 00000000066d0000

Virtual block: 00000000076e0000 - 00000000076e0000

Virtual block: 00000000086f0000 - 00000000086f0000

Virtual block: 0000000009700000 - 0000000009700000

Virtual block: 000000000a710000 - 000000000a710000

0000000000560000 00001002    1088    296    296     18     3     1   11      0   LFH
The dump file can be downloaded from FTP to play with:
ftp://dumpanalysis.org/pub/LargeHeapAllocations.zip
- Dmitry Vostokov @ DumpAnalysis.org -
“A good” bugfix “is one that makes us wiser.”
Yuri Manin, A Course in Mathematical Logic
- Dmitry Vostokov @ DumpAnalysis.org -
Album cover and songs list from Narasimha Vedala:
DUMPSTATIC
Dr. Debugalov Feat.
Assembly Crooks and
E.I.P. Wailers.
1. Mistah Dumpstatic Feat. E.I.P Wailers.
2. Attached to your pros-ass.
3. I put a dump on you.
4. Be my debugger.
5. When push comes to shove, call Debugalov.
6. Pop ECX Feat. Assembly Crooks.
7. You corrupted my memory Feat. E.I.P Wailers.
8. Dark side of the dump.
9. Sweet Dump o’mine.
10. Optimize your soul.
11. Load address blues Feat. Assembly Crooks.
12. Good bye, Kernel.

Some music for this album will be written with the help of Dump2Wave technology ![]() Stay statically tuned to further announcements.
Stay statically tuned to further announcements.
- Dmitry Vostokov @ DumpAnalysis.org -
Debugging “of today reminds one of the Tower of Babel, for few” engineers “can follow profitably the” internals of components “other than their own, and even there they sometimes made to feel like strangers.”
George Sarton, The Study of the History of Mathematics
- Dmitry Vostokov @ DumpAnalysis.org -
Crash dump analysis ”is anticipated with” joy, “performed with” eagerness, “and bragged about forever.”
Anonymous
- Dmitry Vostokov @ DumpAnalysis.org -
The Songs of Distant Earth is my favorite Mike Oldfield album. Highly recommended to keep optimism when doing remote debugging on different systems.

Here is my alternative track naming:
1. The Decision To Go Remote
2. Let There Be A Connection
3. Super System Crash
4. Connection Established
5. First Break In
6. The Sea Of Threads
7. Setting Breakpoints
8. Prayer For A Match
9. Lament For Users
10. The Kernel
11. Screensaver Starts
12. Tabular Output
13. The Shining Threads
14. Breakpoint Match
15. The Sunken Debugger
16. Contemplating Observations
17. A New Session
- Dmitry Vostokov @ DumpAnalysis.org -