Crash Dumps for Dummies (Part 8)
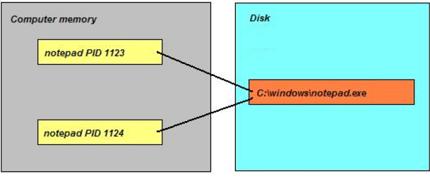
It has been some time since I wrote the previous part of these series. Now I turn back to the theory again and uncover the mystery of the the following phrase used so often in analysis reports: “stack trace of the problem thread“. What is a thread actually? It is defined as a unit of execution or processing. Imagine an Internet browser running on your computer. It was launched by clicking on browser.exe file which we call an application executable file. When this file is loaded and running it occupies some memory regions and we call all these memory regions an Internet browser process. Let click on browser.exe again. A new instance is launched and again, a new running instance is also called a process, the second one. We see that one application file corresponds to several simultaneously running processes where each one has its own unique number, process id (PID). This is illustrated on the following picture for the case of notepad.exe:
Some processes do several tasks in parallel. We call them threads of execution and each one is assigned a unique number, thread id (TID). Consider an Internet browser again. TID 112 is processing keyboard / mouse events (scrolls the page), TID 114 is downloading a graphics file and TID 212 is drawing an animated GIF picture. Every thread does its task in steps, splitting its steps into sub-tasks, dividing every sub-tasks into even smaller units and so on. For example downloading a graphics file can be split into locating a file name on an HTML page, establishing a TCP/IP connection, receiving data and then closing down that connection. Sub-task of locating a file name on an HTML page can be subdivided into finding an IMG tag, then finding its SRC attribute, then parsing a file name, an so on. Abstractly this can be depicted as the nested hierarchy of sequential actions (called functions):
- A
- a …
- b …
- c …
- B
- d
- α …
- β …
- γ …
- e
- d
- C
- f …
- g …
Suppose during the step γ we have a problem. At that time a crash dump is saved. Then in the crash dump we would see the sequence B -> d -> γ. It is called a stack trace (or a backtrace) of the problem thread that was supposed to successfully finish the sequence A -> B -> C but was interrupted at the sub-sub-step γ. In the debugger this stack trace would have been shown as:
application!γ
application!d
application!B
The most recent action is on the top. Let’s go back to our Internet browser example and the thread locating a file name on an HTML page. Suppose the code for parsing file names contains a defect and Internet browser crashes. Then the crash dump would reveal the following stack trace:
browser!ParseFileName
browser!FindSRCAttrubute
browser!FindIMGTag
browser!LocateFileName
browser!DownloadFile
It is often possible to interpret stack traces and guess their meanings by reading the names of corresponding actions.
- Dmitry Vostokov @ DumpAnalysis.org -
October 14th, 2009 at 2:23 pm
[…] centers on considering each individual thread as a Turing machine. One of popular definitions is a parallel activity inside a process. The following diagram depicts a thread in equi-bipartitional virtual memory space comprised from […]