Archive for the ‘Core Dump Analysis’ Category

Crash Dump Analysis Patterns (Part 60, Linux)

Saturday, December 19th, 2015

This is a Linux variant of Execution Residue pattern previously described for Mac OS X and Windows platforms. This is symbolic information left in a stack region including ASCII and UNICODE fragments or pointers to them, for example, return addresses from past function calls:

(gdb) bt
#0  0x00000000004431f1 in nanosleep ()
#1  0x00000000004430c0 in sleep ()
#2  0x0000000000400771 in procNE() ()
#3  0x00000000004007aa in bar_two() ()
#4  0x00000000004007b5 in foo_two() ()
#5  0x00000000004007c8 in thread_two(void*) ()
#6  0x00000000004140f0 in start_thread (arg=<optimized out>)
at pthread_create.c:304
#7  0x0000000000445879 in clone ()
#8  0x0000000000000000 in ?? ()

(gdb) x/512a $rsp-2000
0x7f4cacc42360: 0x0 0x0
0x7f4cacc42370: 0x0 0x0
0x7f4cacc42380: 0x0 0x0
0x7f4cacc42390: 0x0 0x0
[...]
0x7f4cacc42830: 0x0 0x0
0x7f4cacc42840: 0x0 0x0
0x7f4cacc42850: 0x0 0x0
0x7f4cacc42860: 0x7f4cacc42870 0×4005af <_Z6work_8v+9>
0×7f4cacc42870: 0×7f4cacc42880 0×4005ba <_Z6work_7v+9>
0×7f4cacc42880: 0×7f4cacc42890 0×4005c5 <_Z6work_6v+9>
0×7f4cacc42890: 0×7f4cacc428a0 0×4005d0 <_Z6work_5v+9>
0×7f4cacc428a0: 0×7f4cacc428b0 0×4005db <_Z6work_4v+9>
0×7f4cacc428b0: 0×7f4cacc428c0 0×4005e6 <_Z6work_3v+9>
0×7f4cacc428c0: 0×7f4cacc428d0 0×4005f1 <_Z6work_2v+9>
0×7f4cacc428d0: 0×7f4cacc428e0 0×4005fc <_Z6work_1v+9>
0×7f4cacc428e0: 0×7f4cacc42cf0 0×40060e <_Z4workv+16>
0×7f4cacc428f0: 0×0 0×0
0×7f4cacc42900: 0×0 0×0
0×7f4cacc42910: 0×0 0×0
[…]
0×7f4cacc42af0: 0×0 0×0
0×7f4cacc42b00: 0×0 0×0
0×7f4cacc42b10: 0×0 0×0
0×7f4cacc42b20: 0×0 0×4431e6 <nanosleep+38>
0×7f4cacc42b30: 0×0 0×4430c0 <sleep+224>
0×7f4cacc42b40: 0×0 0×0
0×7f4cacc42b50: 0×0 0×0
0×7f4cacc42b60: 0×0 0×0
0×7f4cacc42b70: 0×0 0×0
[…]
0×7f4cacc42cb0: 0×0 0×0
0×7f4cacc42cc0: 0×0 0×0
0×7f4cacc42cd0: 0×0 0×0
0×7f4cacc42ce0: 0xfffffed2 0×3ad3affa
0×7f4cacc42cf0: 0×7f4cacc42d00 0×0
0×7f4cacc42d00: 0×7f4cacc42d20 0×49c740 <default_attr>
0×7f4cacc42d10: 0×7f4cacc439c0 0×400771 <_Z6procNEv+19>
0×7f4cacc42d20: 0×7f4cacc42d30 0×4007aa <_Z7bar_twov+9>
0×7f4cacc42d30: 0×7f4cacc42d40 0×4007b5 <_Z7foo_twov+9>
0×7f4cacc42d40: 0×7f4cacc42d60 0×4007c8 <_Z10thread_twoPv+17>
0×7f4cacc42d50: 0×0 0×0
0×7f4cacc42d60: 0×0 0×4140f0 <start_thread+208>
0×7f4cacc42d70: 0×0 0×7f4cacc43700
0×7f4cacc42d80: 0×0 0×0
0×7f4cacc42d90: 0×0 0×0
[…]

However, supposed return addresses need to be checked for Coincidental Symbolic Information.

- Dmitry Vostokov @ DumpAnalysis.org + TraceAnalysis.org -

Crash Dump Analysis Patterns (Part 2, Linux)

Saturday, December 19th, 2015

This is a Linux variant of Dynamic Memory Corruption (process heap) pattern previously described for Mac OS X and Windows platforms.

The corruption may be internal for heap structures with subsequent memory access violation:

(gdb) bt
#0  0×000000000041482e in _int_malloc ()
#1  0×0000000000416d88 in malloc ()
#2  0×00000000004005dc in proc ()
#3  0×00000000004006ee in bar_three ()
#4  0×00000000004006fe in foo_three ()
#5  0×0000000000400716 in thread_three ()
#6  0×0000000000401760 in start_thread (arg=<optimized out>)
at pthread_create.c:304
#7  0×0000000000432609 in clone ()
#8  0×0000000000000000 in ?? ()

(gdb) x/i $rip
=> 0x41482e <_int_malloc+622>: mov    %rbx,0×10(%r12)

(gdb) x $r12+0x10
0x21687371: Cannot access memory at address 0x21687371

(gdb) p (char[4])0x21687371
$1 = "qsh!"

Or it may be detected with a diagnostic message (similar to double free):

(gdb) bt
#0  0×000000000043ef65 in raise ()
#1  0×0000000000409fc0 in abort ()
#2  0×000000000040bf5b in __libc_message ()
#3  0×0000000000412042 in malloc_printerr ()

#4  0×0000000000416c27 in free ()
#5  0×0000000000400586 in proc ()
#6  0×000000000040067e in bar_four ()
#7  0×000000000040068e in foo_four ()
#8  0×00000000004006a6 in thread_four ()
#9  0×00000000004016c0 in start_thread (arg=<optimized out>)
at pthread_create.c:304
#10 0×0000000000432589 in clone ()
#11 0×0000000000000000 in ?? ()

- Dmitry Vostokov @ DumpAnalysis.org + TraceAnalysis.org -

Crash Dump Analysis Patterns (Part 235, Linux)

Friday, December 18th, 2015

We first introduced Critical Region pattern in Accelerated Mac OS X Core Dump Analysis training but didn’t submit the pattern itself to the catalog at that time.

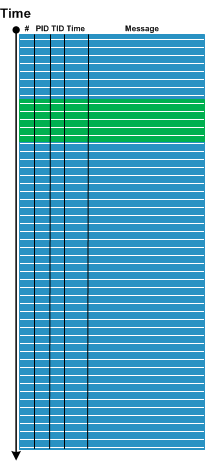
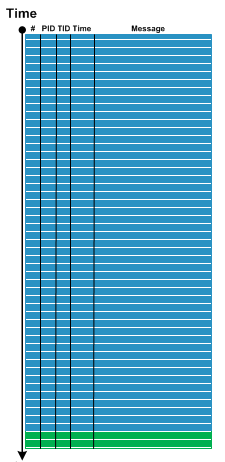
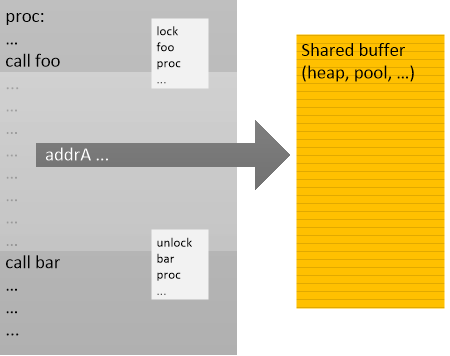
A critical region is usually a region of code protected by synchronization objects such as critical sections and mutexes. However, Critical Region analysis pattern is about identifying code regions “sandwiched” between contending function calls (which may or may not involve synchronization objects and corresponding synchronization calls such as identified in Contention patterns), and then identifying any possible shared data referenced by such code regions:

(gdb) thread apply all bt

Thread 6 (Thread 0x7f2665377700 (LWP 17000)):
#0  0x00000000004151a1 in _int_malloc ()
#1  0x0000000000416cf8 in malloc ()
#2  0x00000000004005a4 in proc ()
#3  0x0000000000400604 in bar_two ()
#4  0x0000000000400614 in foo_two ()
#5  0x000000000040062c in thread_two ()
#6  0x00000000004016c0 in start_thread (arg=<optimized out>)
at pthread_create.c:304
#7  0x0000000000432589 in clone ()
#8  0x0000000000000000 in ?? ()

Thread 5 (Thread 0x7f2664b76700 (LWP 17001)):
#0  __lll_unlock_wake_private ()
at ../nptl/sysdeps/unix/sysv/linux/x86_64/lowlevellock.S:343
#1  0×000000000041886d in _L_unlock_9670 ()
#2  0×0000000000416d22 in malloc ()
#3  0×00000000004005a4 in proc ()

#4  0×0000000000400641 in bar_three ()
#5  0×0000000000400651 in foo_three ()
#6  0×0000000000400669 in thread_three ()
#7  0×00000000004016c0 in start_thread (arg=<optimized out>)
at pthread_create.c:304
#8  0×0000000000432589 in clone ()
#9  0×0000000000000000 in ?? ()

Thread 4 (Thread 0x7f2665b78700 (LWP 16999)):
#0  __lll_lock_wait_private ()
at ../nptl/sysdeps/unix/sysv/linux/x86_64/lowlevellock.S:97
#1  0×0000000000418836 in _L_lock_9558 ()
#2  0×0000000000416c1c in free ()
#3  0×0000000000400586 in proc ()

#4  0×00000000004005c7 in bar_one ()
#5  0×00000000004005d7 in foo_one ()
#6  0×00000000004005ef in thread_one ()
#7  0×00000000004016c0 in start_thread (arg=<optimized out>)
at pthread_create.c:304
#8  0×0000000000432589 in clone ()
#9  0×0000000000000000 in ?? ()

Thread 3 (Thread 0x1ab1860 (LWP 16998)):
#0  0x000000000042fed1 in nanosleep ()
#1  0x000000000042fda0 in sleep ()
#2  0x000000000040078a in main ()

Thread 2 (Thread 0x7f2663b74700 (LWP 17003)):
#0  __lll_lock_wait_private ()
at ../nptl/sysdeps/unix/sysv/linux/x86_64/lowlevellock.S:97
#1  0x0000000000418836 in _L_lock_9558 ()
#2  0x0000000000416c1c in free ()
#3  0x0000000000400586 in proc ()
#4  0x00000000004006bb in bar_five ()
#5  0x00000000004006cb in foo_five ()
#6  0x00000000004006e3 in thread_five ()
#7  0x00000000004016c0 in start_thread (arg=<optimized out>)
at pthread_create.c:304
#8  0x0000000000432589 in clone ()
#9  0x0000000000000000 in ?? ()

Thread 1 (Thread 0x7f2664375700 (LWP 17002)):
#0  0x000000000043ef65 in raise ()
#1  0x0000000000409fc0 in abort ()
#2  0x000000000040bf5b in __libc_message ()
#3  0x0000000000412042 in malloc_printerr ()
#4  0x0000000000416c27 in free ()
#5  0x0000000000400586 in proc ()
#6  0x000000000040067e in bar_four ()
#7  0x000000000040068e in foo_four ()
#8  0x00000000004006a6 in thread_four ()
#9  0x00000000004016c0 in start_thread (arg=<optimized out>)
at pthread_create.c:304
#10 0x0000000000432589 in clone ()
#11 0x0000000000000000 in ?? ()

From threads #4 and #5 we can identify one such a region with a shared buffer 0×6b8fc0 which may further point to heap entries.

(gdb) disassemble proc
Dump of assembler code for function proc:
0x00000000004004f0 <+0>: push   %rbp
0x00000000004004f1 <+1>: mov    %rsp,%rbp
0x00000000004004f4 <+4>: push   %rbx
0x00000000004004f5 <+5>: sub    $0x18,%rsp
0x00000000004004f9 <+9>: callq  0x40ac70 <rand>
0x00000000004004fe <+14>: mov    %eax,%ecx
0x0000000000400500 <+16>: mov    $0x68db8bad,%edx
0x0000000000400505 <+21>: mov    %ecx,%eax
0x0000000000400507 <+23>: imul   %edx
0x0000000000400509 <+25>: sar    $0xc,%edx
0x000000000040050c <+28>: mov    %ecx,%eax
0x000000000040050e <+30>: sar    $0x1f,%eax
0x0000000000400511 <+33>: mov    %edx,%ebx
0x0000000000400513 <+35>: sub    %eax,%ebx
0x0000000000400515 <+37>: mov    %ebx,%eax
0x0000000000400517 <+39>: mov    %eax,-0x14(%rbp)
0x000000000040051a <+42>: mov    -0x14(%rbp),%eax
0x000000000040051d <+45>: imul   $0x2710,%eax,%eax
0x0000000000400523 <+51>: mov    %ecx,%edx
0x0000000000400525 <+53>: sub    %eax,%edx
0x0000000000400527 <+55>: mov    %edx,%eax
0x0000000000400529 <+57>: mov    %eax,-0x14(%rbp)
0x000000000040052c <+60>: callq  0x40ac70 <rand>
0x0000000000400531 <+65>: mov    %eax,%ecx
0x0000000000400533 <+67>: mov    $0x68db8bad,%edx
0x0000000000400538 <+72>: mov    %ecx,%eax
0x000000000040053a <+74>: imul   %edx
0x000000000040053c <+76>: sar    $0xc,%edx
0x000000000040053f <+79>: mov    %ecx,%eax
0x0000000000400541 <+81>: sar    $0x1f,%eax
0x0000000000400544 <+84>: mov    %edx,%ebx
0x0000000000400546 <+86>: sub    %eax,%ebx
0x0000000000400548 <+88>: mov    %ebx,%eax
0x000000000040054a <+90>: mov    %eax,-0x18(%rbp)
0x000000000040054d <+93>: mov    -0x18(%rbp),%eax
0x0000000000400550 <+96>: imul   $0x2710,%eax,%eax
0x0000000000400556 <+102>: mov    %ecx,%edx
0x0000000000400558 <+104>: sub    %eax,%edx
0x000000000040055a <+106>: mov    %edx,%eax
0x000000000040055c <+108>: mov    %eax,-0x18(%rbp)
0x000000000040055f <+111>: mov    -0x14(%rbp),%eax
0x0000000000400562 <+114>: cltq
0x0000000000400564 <+116>: mov    0x6b8fc0(,%rax,8),%rax
0x000000000040056c <+124>: test   %rax,%rax
0x000000000040056f <+127>: je     0x400597 <proc+167>
0x0000000000400571 <+129>: mov    -0x14(%rbp),%eax
0x0000000000400574 <+132>: cltq
0x0000000000400576 <+134>: mov    0x6b8fc0(,%rax,8),%rax
0x000000000040057e <+142>: mov    %rax,%rdi
0x0000000000400581 <+145>: callq  0x416bc0 <free>
0×0000000000400586 <+150>: mov    -0×14(%rbp),%eax
0×0000000000400589 <+153>: cltq
0×000000000040058b <+155>: movq   $0×0,0×6b8fc0(,%rax,8)
0×0000000000400597 <+167>: mov    -0×18(%rbp),%eax
0×000000000040059a <+170>: cltq
0×000000000040059c <+172>: mov    %rax,%rdi

0×000000000040059f <+175>: callq  0×416c90 <malloc>
0×00000000004005a4 <+180>: mov    %rax,%rdx
0×00000000004005a7 <+183>: mov    -0×14(%rbp),%eax
0×00000000004005aa <+186>: cltq
0×00000000004005ac <+188>: mov    %rdx,0×6b8fc0(,%rax,8)
0×00000000004005b4 <+196>: jmpq   0×4004f9 <proc+9>
End of assembler dump.

- Dmitry Vostokov @ DumpAnalysis.org + TraceAnalysis.org -

Crash Dump Analysis Patterns (Part 6b, Linux)

Friday, December 18th, 2015

This is a Linux variant of NULL Pointer (data) pattern previously described for Mac OS X and Windows platforms:

(gdb) bt
#0  0×0000000000400500 in procA ()
#1  0×000000000040057a in bar_two ()
#2  0×000000000040058a in foo_two ()
#3  0×00000000004005a2 in thread_two ()
#4  0×0000000000401630 in start_thread (arg=<optimized out>)
at pthread_create.c:304
#5  0×00000000004324e9 in clone ()
#6  0×0000000000000000 in ?? ()

(gdb) x/i 0x400500
=> 0x400500 <procA+16>: movl   $0x1,(%rax)

(gdb) info r $rax
rax            0×0 0

(gdb) x $rax
0×0: Cannot access memory at address 0×0

- Dmitry Vostokov @ DumpAnalysis.org + TraceAnalysis.org -

Crash Dump Analysis Patterns (Part 25, Linux)

Friday, December 18th, 2015

This is a Linux variant of Stack Trace pattern previously described for Mac OS X and Windows platforms. Here we show a stack trace when debug symbols are not available (stripped executable) and also how to apply debug symbols from the executable where they were preserved:

(gdb) bt
#0 0x000000000043e4f1 in nanosleep ()
#1 0x000000000043e3c0 in sleep ()
#2 0x0000000000400789 in main ()

(gdb) symbol-file ./App/App.debug
Reading symbols from /home/Apps/App/App.debug...done.

(gdb) bt
#0 0x000000000043e4f1 in nanosleep ()
#1 0x000000000043e3c0 in sleep ()
#2 0x0000000000400789 in main (argc=1, argv=0x7fff5d1572d8) at main.cpp:85

- Dmitry Vostokov @ DumpAnalysis.org + TraceAnalysis.org -

Crash Dump Analysis Patterns (Part 6a, Linux)

Friday, December 18th, 2015

This is a Linux variant of NULL Pointer (code) pattern previously described for Mac OS X and Windows platforms:

(gdb) bt
#0  0×0000000000000000 in ?? ()
#1  0×0000000000400531 in procB ()
#2  0×00000000004005f8 in bar_four ()
#3  0×0000000000400608 in foo_four ()
#4  0×0000000000400620 in thread_four ()
#5  0×0000000000401630 in start_thread (arg=<optimized out>)
at pthread_create.c:304
#6  0×00000000004324e9 in clone ()
#7  0×0000000000000000 in ?? ()

(gdb) disassemble procB
Dump of assembler code for function procB:
0x0000000000400516 <+0>: push   %rbp
0x0000000000400517 <+1>: mov    %rsp,%rbp
0x000000000040051a <+4>: sub    $0x10,%rsp
0x000000000040051e <+8>: movq   $0x0,-0x8(%rbp)
0x0000000000400526 <+16>: mov    -0x8(%rbp),%rdx
0x000000000040052a <+20>: mov    $0x0,%eax
0x000000000040052f <+25>: callq  *%rdx
0×0000000000400531 <+27>: leaveq
0×0000000000400532 <+28>: retq
End of assembler dump.

(gdb) info r rdx
rdx            0×0 0

- Dmitry Vostokov @ DumpAnalysis.org + TraceAnalysis.org -

Crash Dump Analysis Patterns (Part 78a, Linux)

Tuesday, December 15th, 2015

This is a Linux variant of Divide by Zero (user mode) pattern previously described for Mac OS X and Windows platforms:

GNU gdb (GDB)
[...]
Program terminated with signal 8, Arithmetic exception.
#0 0×000000000040056f in procD ()

(gdb) x/i $rip
=> 0x40056f <procD+18>: idivl -0×8(%rbp)

(gdb) info r $rax
rax 0x1 1

(gdb) x/w $rbp-0x8
0x7f0f6806bd28: 0×00000000

- Dmitry Vostokov @ DumpAnalysis.org + TraceAnalysis.org -

Crash Dump Analysis Patterns (Part 4, Linux)

Tuesday, December 15th, 2015

This is a Linux variant of Lateral Damage pattern previously described for Windows platforms. It also covers memory dumps where some usual commands may not work and we have to find a workaround to simulate their output, for example, by using other commands:

(gdb) info threads
Cannot find new threads: generic error

(gdb) thread apply all bt
Cannot find new threads: generic error

(gdb) thread 2
[Switching to thread 2 (LWP 12567)]
#0 0x000000000042ff51 in nanosleep ()

(gdb) thread 3
[Switching to thread 3 (LWP 12566)]
#0 0x000000000041482e in _int_malloc ()

- Dmitry Vostokov @ DumpAnalysis.org + TraceAnalysis.org -

Crash Dump Analysis Patterns (Part 187, Linux)

Monday, December 14th, 2015

Here we publish a Linux variant of Active Thread pattern that was previously introduced for Mac OS X and Windows. Basically it is a thread that is not waiting, sleeping, or suspended (most threads are). However, from a memory dump it is not possible to find out whether it was Spiking Thread at the dump generation time (unless we have a set of memory snapshots and in each one we have the same or similar back trace) and we don’t have any Paratext with CPU consumption stats for threads. For example, in one core dump we have this thread:

(gdb) info threads
Id Target Id Frame
6 Thread 0×7f560d467700 (LWP 3483) 0×00000000004324a9 in clone ()
5 Thread 0×7f560c465700 (LWP 3485) 0×000000000042fe31 in nanosleep ()
4 Thread 0×7f560bc64700 (LWP 3486) 0×000000000042fe31 in nanosleep ()
3 Thread 0×7f560b463700 (LWP 3487) 0×000000000042fe31 in nanosleep ()
2 Thread 0×18b9860 (LWP 3482) 0×000000000042fe31 in nanosleep ()
1 Thread 0×7f560cc66700 (LWP 3484) 0×000000000042fe31 in nanosleep ()

Thread #6 is not waiting so we inspect its back trace:

(gdb) thread 6
[Switching to thread 6 (Thread 0x7f560d467700 (LWP 3483))]
#0 0x00000000004324a9 in clone ()

(gdb) bt
#0 0×00000000004324a9 in clone ()
#1 0×0000000000401560 in ?? () at pthread_create.c:217
#2 0×00007f560d467700 in ?? ()
#3 0×0000000000000000 in ?? ()

(gdb) x/i 0x4324a9
=> 0x4324a9 : test %rax,%rax

Perhaps the core dump was saved at the thread creation time.

- Dmitry Vostokov @ DumpAnalysis.org + TraceAnalysis.org -

Crash Dump Analysis Patterns (Part 14, Linux)

Monday, December 14th, 2015

This is a variant of Spiking Thread pattern previously described for Mac OS X and Windows platforms:

(gdb) info threads
Id Target Id Frame
6 LWP 3712 0x00000000004329d1 in nanosleep ()
5 LWP 3717 0×00000000004007a3 in isnan ()
4 LWP 3716 0×00000000004329d1 in nanosleep ()
3 LWP 3715 0×00000000004329d1 in nanosleep ()
2 LWP 3714 0×00000000004329d1 in nanosleep ()
* 1 LWP 3713 0×00000000004329d1 in nanosleep ()

We notice a non-waiting thread and switch to it:

(gdb) thread 5
[Switching to thread 5 (LWP 3717)]
#0 0x00000000004007a3 in isnan ()

(gdb) bt
#0 0×00000000004007a3 in isnan ()
#1 0×0000000000400743 in sqrt ()
#2 0×0000000000400528 in procB ()
#3 0×0000000000400639 in bar_five ()
#4 0×0000000000400649 in foo_five ()
#5 0×0000000000400661 in thread_five ()
#6 0×0000000000403e30 in start_thread ()
#7 0×0000000000435089 in clone ()
#8 0×0000000000000000 in ?? ()

If we disassemble the return address for procB function to come back from sqrt call we see an infinite loop:

(gdb) disassemble 0x400528
Dump of assembler code for function procB:
0x0000000000400500 <+0>: push   %rbp
0x0000000000400501 <+1>: mov    %rsp,%rbp
0x0000000000400504 <+4>: sub    $0x20,%rsp
0x0000000000400508 <+8>: movabs $0x3fd5555555555555,%rax
0x0000000000400512 <+18>: mov    %rax,-0x8(%rbp)
0×0000000000400516 <+22>: mov    -0×8(%rbp),%rax
0×000000000040051a <+26>: mov    %rax,-0×18(%rbp)
0×000000000040051e <+30>: movsd  -0×18(%rbp),%xmm0
0×0000000000400523 <+35>: callq  0×400710 <sqrt>
0×0000000000400528 <+40>: movsd  %xmm0,-0×18(%rbp)
0×000000000040052d <+45>: mov    -0×18(%rbp),%rax
0×0000000000400531 <+49>: mov    %rax,-0×8(%rbp)
0×0000000000400535 <+53>: jmp    0×400516 <procB+22>
End of assembler dump.

- Dmitry Vostokov @ DumpAnalysis.org + TraceAnalysis.org -

Crash Dump Analysis Patterns (Part 77, Linux)

Monday, December 14th, 2015

This is a Linux variant of C++ Exception pattern previously described for Mac OS X and Windows platforms:

(gdb) bt
#0 0x00007f0a1d0e5165 in *__GI_raise ()
at ../nptl/sysdeps/unix/sysv/linux/raise.c:64
#1 0x00007f0a1d0e83e0 in *__GI_abort () at abort.c:92
#2 0x00007f0a1db5789d in __gnu_cxx::__verbose_terminate_handler() ()
from /usr/lib/x86_64-linux-gnu/libstdc++.so.6
#3 0x00007f0a1db55996 in ?? () from /usr/lib/x86_64-linux-gnu/libstdc++.so.6
#4 0x00007f0a1db559c3 in std::terminate() ()
from /usr/lib/x86_64-linux-gnu/libstdc++.so.6
#5 0x00007f0a1db55bee in __cxa_throw ()
from /usr/lib/x86_64-linux-gnu/libstdc++.so.6
#6 0x0000000000400dcf in procB() ()
#7 0x0000000000400e26 in procA() ()
#8 0x0000000000400e88 in procNH() ()
#9 0x0000000000400ea8 in bar_one() ()
#10 0x0000000000400eb3 in foo_one() ()
#11 0x0000000000400ec6 in thread_one(void*) ()
#12 0x00007f0a1d444b50 in start_thread ()
#13 0x00007f0a1d18e95d in clone ()
at ../sysdeps/unix/sysv/linux/x86_64/clone.S:112
#14 0x0000000000000000 in ?? ()

- Dmitry Vostokov @ DumpAnalysis.org + TraceAnalysis.org -

Crash Dump Analysis Patterns (Part 180, Linux)

Monday, December 14th, 2015

This is Linux variant of Paratext pattern for Mac OS X. Because of debugger tool limitations additional software logs and the output of other tools may help in memory dump analysis. Typical examples of such pattern usage can be the list of modules with version and path info, application crash specific information from instrumentation tools such as valgrind, memory region names with attribution and boundaries, and CPU usage information. For example, top and pmap commands output:

14039: ./App1.shared
0000000000400000 4K r-x-- /home/training/ALCDA/App1/App1.shared
0000000000600000 4K rw--- /home/training/ALCDA/App1/App1.shared
0000000000611000 132K rw--- [ anon ]
00007fe8999a6000 4K ----- [ anon ]
00007fe8999a7000 8192K rw--- [ anon ]
00007fe89a1a7000 4K ----- [ anon ]
00007fe89a1a8000 8192K rw--- [ anon ]
00007fe89a9a8000 4K ----- [ anon ]
00007fe89a9a9000 8192K rw--- [ anon ]
00007fe89b1a9000 4K ----- [ anon ]
00007fe89b1aa000 8192K rw--- [ anon ]
00007fe89b9aa000 4K ----- [ anon ]
00007fe89b9ab000 8192K rw--- [ anon ]
00007fe89c1ab000 1540K r-x-- /lib/x86_64-linux-gnu/libc-2.13.so
00007fe89c32c000 2048K ----- /lib/x86_64-linux-gnu/libc-2.13.so
00007fe89c52c000 16K r---- /lib/x86_64-linux-gnu/libc-2.13.so
00007fe89c530000 4K rw--- /lib/x86_64-linux-gnu/libc-2.13.so
00007fe89c531000 20K rw--- [ anon ]
00007fe89c536000 92K r-x-- /lib/x86_64-linux-gnu/libpthread-2.13.so
00007fe89c54d000 2044K ----- /lib/x86_64-linux-gnu/libpthread-2.13.so
00007fe89c74c000 4K r---- /lib/x86_64-linux-gnu/libpthread-2.13.so
00007fe89c74d000 4K rw--- /lib/x86_64-linux-gnu/libpthread-2.13.so
00007fe89c74e000 16K rw--- [ anon ]
00007fe89c752000 128K r-x-- /lib/x86_64-linux-gnu/ld-2.13.so
00007fe89c966000 12K rw--- [ anon ]
00007fe89c96f000 8K rw--- [ anon ]
00007fe89c971000 4K r---- /lib/x86_64-linux-gnu/ld-2.13.so
00007fe89c972000 4K rw--- /lib/x86_64-linux-gnu/ld-2.13.so
00007fe89c973000 4K rw--- [ anon ]
00007ffd458c1000 132K rw--- [ stack ]
00007ffd459e9000 4K r-x-- [ anon ]
ffffffffff600000 4K r-x-- [ anon ]
total 47208K

- Dmitry Vostokov @ DumpAnalysis.org + TraceAnalysis.org -

Workaround Patterns (Part 5)

Saturday, September 26th, 2015

We resume our workaround patterns for common reusable solutions to common software execution problems. In the past we proposed a general pattern of Axed Code for removing problem software behavior. The Shadow File blog post about fixing free() crashes by introducing heap metadata header with a data length set to zero led me to generalize and introduce a complementary Axed Data pattern. Such a pattern suggests cutting the data size specified in metadata memory plane (which may be separate from the data plane). In some cases, it may avoid buffer overwrites including Local and Shared in addition to Dynamic Memory Corruption (process heap and kernel pool). The following picture illustrates this general pattern approach.

Sometimes, it may even be possible to provide a workaround by cutting real file data, for example, by changing its file or database record size. But this is also done conceptually by changing file or database system metadata.

- Dmitry Vostokov @ DumpAnalysis.org + TraceAnalysis.org -

Trace Analysis Patterns (Part 113)

Saturday, September 12th, 2015

Recently we analyzed a few logs which ended with a specialized Activity Region from a subsystem that sets operational parameters. The problem description stated that the system became unresponsive after changing parameters in a certain sequence. Usually, for that system, when we stop logging (even after setting parameters) we end up with messages from some Background Components since some time passes between the end of setting parameters activity and the time the operator sends stop logging request:

However, in the problem case we see message flow stops right in the middle of parameter setting activity:

So we advised to check for any crashes or hangs, and, indeed, it was found that the system was actually experiencing system crashes, and we got memory dumps for analysis where we found Top Module from a 3rd-party vendor related to parameter setting activity.

Please also note an analogy here between normal thread stack traces from threads that are waiting most of the time and Spiking Thread stack trace caught up in the middle of some function.

We call this pattern Ruptured Trace after a ruptured computation.

Note, that if it is possible to restart the system and resume the same tracing we may get an instance of Blackout analysis pattern.

- Dmitry Vostokov @ DumpAnalysis.org + TraceAnalysis.org -

Crash Dump Analysis Patterns (Part 221)

Saturday, February 21st, 2015

Corrupt Structure is added for completeness of pattern discourse. We mentioned it a few times, for example, in Self-Diagnosis (kernel mode), and Critical Section Corruption. Typical signs of the corrupt structure include:

- Regular Data such as ASCII and UNICODE fragments over substructures and pointer areas
- Large values where you expect small and vice versa
- User space address values where we expect kernel space and vice versa
- Malformed and partially zeroed _LIST_ENTRY data (see exercise C3 for linked list navigation)
- Memory read errors for pointer dereferences or inaccessible memory indicators (??)
- Memory read error at the end of the linked list while traversing structures

0: kd> dt _ERESOURCE ffffd0002299f830
ntdll!_ERESOURCE
+0x000 SystemResourcesList : _LIST_ENTRY [ 0xffffc000`07b64800 - 0xffffe000`02a79970 ]
+0x010 OwnerTable       : 0xffffe000`02a79940 _OWNER_ENTRY
+0x018 ActiveCount      : 0n0
+0x01a Flag             : 0
+0x01a ReservedLowFlags : 0 ''
+0x01b WaiterPriority   : 0 ''
+0x020 SharedWaiters    : 0x00000000`00000001 _KSEMAPHORE
+0x028 ExclusiveWaiters : 0xffffe000`02a79a58 _KEVENT
+0x030 OwnerEntry       : _OWNER_ENTRY
+0x040 ActiveEntries    : 0
+0x044 ContentionCount  : 0
+0×048 NumberOfSharedWaiters : 0×7b64800
+0×04c NumberOfExclusiveWaiters : 0xffffc000

+0×050 Reserved2        : (null)
+0×058 Address          : 0xffffd000`2299f870 Void
+0×058 CreatorBackTraceIndex : 0xffffd000`2299f870
+0×060 SpinLock         : 1

0: kd> dt _ERESOURCE ffffd0002299d830
ntdll!_ERESOURCE
+0×000 SystemResourcesList : _LIST_ENTRY [ 0×000001e0`00000280 - 0×00000000`00000004 ]
+0×010 OwnerTable       : 0×00000000`0000003c _OWNER_ENTRY
+0×018 ActiveCount      : 0n0
+0×01a Flag             : 0
+0×01a ReservedLowFlags : 0 ”
+0×01b WaiterPriority   : 0 ”
+0×020 SharedWaiters    : 0×0000003c`000001e0 _KSEMAPHORE
+0×028 ExclusiveWaiters : (null)
+0×030 OwnerEntry       : _OWNER_ENTRY
+0×040 ActiveEntries    : 0
+0×044 ContentionCount  : 0×7f
+0×048 NumberOfSharedWaiters : 0×7f
+0×04c NumberOfExclusiveWaiters : 0×7f
+0×050 Reserved2        : 0×00000001`00000001 Void
+0×058 Address          : 0×00000000`00000005 Void
+0×058 CreatorBackTraceIndex : 5
+0×060 SpinLock         : 0

However, we need to be sure that we supplied the correct pointer to dt WinDbg command. One of the signs that the pointer was incorrect are memory read errors or all zeroes:

0: kd> dt _ERESOURCE ffffd000229af830
ntdll!_ERESOURCE
+0x000 SystemResourcesList : _LIST_ENTRY [ 0x00000000`00000000 - 0x00000000`00000000 ]
+0x010 OwnerTable : (null)
+0x018 ActiveCount : 0n0
+0x01a Flag : 0
+0x01a ReservedLowFlags : 0 ''
+0x01b WaiterPriority : 0 ''
+0x020 SharedWaiters : (null)
+0x028 ExclusiveWaiters : (null)
+0x030 OwnerEntry : _OWNER_ENTRY
+0x040 ActiveEntries : 0
+0x044 ContentionCount : 0
+0x048 NumberOfSharedWaiters : 0
+0x04c NumberOfExclusiveWaiters : 0
+0x050 Reserved2 : (null)
+0x058 Address : (null)
+0x058 CreatorBackTraceIndex : 0
+0x060 SpinLock : 0

0: kd> dt _ERESOURCE ffffd00022faf830
ntdll!_ERESOURCE
+0x000 SystemResourcesList : _LIST_ENTRY
+0x010 OwnerTable       : ????
+0x018 ActiveCount      : ??
+0x01a Flag             : ??
+0x01a ReservedLowFlags : ??
+0x01b WaiterPriority   : ??
+0x020 SharedWaiters    : ????
+0x028 ExclusiveWaiters : ????
+0x030 OwnerEntry       : _OWNER_ENTRY
+0x040 ActiveEntries    : ??
+0x044 ContentionCount  : ??
+0x048 NumberOfSharedWaiters : ??
+0x04c NumberOfExclusiveWaiters : ??
+0x050 Reserved2        : ????
+0x058 Address          : ????
+0x058 CreatorBackTraceIndex : ??
+0x060 SpinLock         : ??
Memory read error ffffd00022faf890

- Dmitry Vostokov @ DumpAnalysis.org + TraceAnalysis.org -

Trace Analysis Patterns (Part 100)

Saturday, January 31st, 2015

Sometimes we need memory reference information not available in software traces and logs, for example, to see pointer dereferences, to follow pointers and linked structures. In such cases memory dumps saved during logging sessions may help. In case of process memory dumps we can even have several Step Dumps. Complete and kernel memory dumps may be forced after saving a log file. We call such pattern Adjoint Space:

Then we can analyze logs and memory dumps together, for example, to follow pointer data further in memory space:

There is also a reverse situation when we use logs to see past data changes before memory snapshot time (Paratext memory analysis pattern):

- Dmitry Vostokov @ DumpAnalysis.org + TraceAnalysis.org -

Crash Dump Analysis Patterns (Part 214)

Wednesday, October 8th, 2014

When we look at a stack trace in a memory dump we see only the current thread execution snapshot of function calls. Consider this stack trace, for example, from Spiking Thread:

0:000> k
Child-SP RetAddr  Call Site
00000000`0012d010 00000000`76eb59ed App!WinMain+0x1eda
00000000`0012f7c0 00000000`770ec541 kernel32!BaseThreadInitThunk+0xd
00000000`0012f7f0 00000000`00000000 ntdll!RtlUserThreadStart+0x1d

By looking at Rough Stack Trace we may be able to reconstruct Past Stack Trace of what had happened just before the memory snapshot was taken:

0:000> k
Child-SP RetAddr  Call Site
00000000`0012cfd8 00000000`76fd9e9e user32!ZwUserGetMessage+0xa
00000000`0012cfe0 00000000`ffd91a8c user32!GetMessageW+0x34
00000000`0012d010 00000000`76eb59ed App!WinMain+0x1dca
00000000`0012f7c0 00000000`770ec541 kernel32!BaseThreadInitThunk+0xd
00000000`0012f7f0 00000000`00000000 ntdll!RtlUserThreadStart+0x1d

The stack region “time” zones are illustrated on the following picture:

The “Future” zone takes its name from the not yet executed returns. Of course, each stack subtrace generates its own partition. A similar version of this pattern was first introduced in Debugging TV Frames episode 0×24. You watch the video here and can find source code, WinDbg logs, and presentation here.

- Dmitry Vostokov @ DumpAnalysis.org + TraceAnalysis.org -

Malware Analysis Patterns (Part 23)

Sunday, February 10th, 2013

Out-of-Module Pointer pattern is about pointers to addresses outside the container module range. Typical example here would be some kernel table or structure, for example, a driver IRP dispatch table having pointers to outside that driver module address range. Other examples may include 32-bit SSDT pointing outside nt module range and IDT entries pointing outside hal and expected drivers:

[...]
818809dc 8193c4e7 nt!NtQueryOpenSubKeys
818809e0 8193c76b nt!NtQueryOpenSubKeysEx
818809e4 81a909b0 nt!NtQueryPerformanceCounter
818809e8 819920e7 nt!NtQueryQuotaInformationFile
818809ec 819e34f2 nt!NtQuerySection
818809f0 819f470b nt!NtQuerySecurityObject
818809f4 81a882fe nt!NtQuerySemaphore
818809f8 819eff54 nt!NtQuerySymbolicLinkObject
818809fc 81a8a223 nt!NtQuerySystemEnvironmentValue
81880a00 81a8a831 nt!NtQuerySystemEnvironmentValueEx
81880a04 96ca1a73
81880a08 81a7ac06 nt!NtQuerySystemTime
81880a0c 81a8f913 nt!NtQueryTimer
81880a10 81a7aeeb nt!NtQueryTimerResolution
81880a14 8193985a nt!NtQueryValueKey
81880a18 819e9273 nt!NtQueryVirtualMemory
81880a1c 8199274e nt!NtQueryVolumeInformationFile
81880a20 81a1a655 nt!NtQueueApcThread
[…]

0: kd> lm m nt
start end module name
81800000 81ba1000 nt

Such pointers may also be Raw Pointers but it also could be the case that all pointers are raw in the absence of symbols with only a few outside of the expected range.

- Dmitry Vostokov @ DumpAnalysis.org + TraceAnalysis.org -

Static Code Analysis Patterns (Part 1)

Friday, January 11th, 2013

Static program analysis is used to eliminate certain coding errors that may lead to abnormal software behaviour. So it is naturally a part of software diagnostics but at source code level. Our goal here is to identify certain patterns directly linkable to patterns we see in memory dumps and software logs and collect them into a catalog. One such pattern candidate is called Loop Construct. It covers conditional and unconditional loops, for example, in one of modern languages:

extern bool soonToBeTrue; 
int mediumValue = ...;
while (true)

{

  TRACE("Waiting");

  sleep(mediumValue);

  if (soonToBeTrue)

  {

    break;

  }

  doHeavyWork();

}
while (--pControl->aFewPasses)

{

  TRACE("Waiting");

  sleep(mediumValue);

  doHeavyWork();

}

Such loops may potentially lead to Spiking Thread memory dump analysis and High Message Current and Density trace analysis patterns. Of course, we shouldn’t suspect every loop but only some that have potential to be altered by Local Buffer Overflow (for mediumValue) or Shared Buffer Overwrite (for Control.aFewPasses) or by a race condition (soonToBeTrue).

We expect things to get more interesting when we start associating source code that uses certain API with patterns of abnormal behavior.

- Dmitry Vostokov @ DumpAnalysis.org + TraceAnalysis.org -

Crash Dump Analysis Patterns (Part 187, Mac OS X)

Saturday, November 17th, 2012

Here we publish Active Thread pattern that was previously introduced in Accelerated Mac OS X Core Dump Analysis training. Basically it is a thread that is not waiting or suspended (most threads are). However, from a memory dump it is not possible to find out whether it was spiking at the dump generation time (unless we have a set of memory snapshots and in each one we have the same or similar back trace) and we don’t have any paratext with CPU consumption stats for threads. For example, in one core dump we have these threads:

(gdb) info threads
12 0x98c450ee in __workq_kernreturn ()
11 0x98c4280e in semaphore_wait_trap ()
10 0x98c448e2 in __psynch_cvwait ()
9 0×00110171 in std::_Rb_tree<int, std::pair<int const, _iCapture*>, std::_Select1st<std::pair<int const, _iCapture*> >, std::less<int>, std::allocator<std::pair<int const, _iCapture*> > >::find ()
8 0×98c428e6 in mach_wait_until ()
7 0×98c448e2 in __psynch_cvwait ()
6 0×98c427d2 in mach_msg_trap ()
5 0×98c427d2 in mach_msg_trap ()
4 0×98c428e6 in mach_wait_until ()
3 0×98c427d2 in mach_msg_trap ()
2 0×98c459ae in kevent ()
*  1 0×014bcee0 in cgGLGetLatestProfile ()

Threads #9 and #1 are not waiting so we inspect their back traces:

(gdb) bt
#0  0x014bcee0 in cgGLGetLatestProfile ()
#1  0x99060dd5 in exit ()
#2  0x001ef859 in os_exit ()
#3  0x001dc873 in luaD_precall ()
#4  0x001e7d9e in luaV_execute ()
#5  0x001dc18b in luaD_rawrunprotected ()
#6  0x001dced4 in lua_resume ()
#7  0x0058a526 in ticLuaManager::executeProgram ()
#8  0x005a09af in ticLuaScript::_execute ()
#9  0x003a6480 in darcScript::execute ()
#10 0x003af4d8 in darcTimeline::execute ()
#11 0x0034a2ba in darcSequenceur::executeAll ()
#12 0x0036904b in darcEventManager::ExecuteEventHandler ()
#13 0x003a37d2 in darcScene::process ()
#14 0x0034a2ba in darcSequenceur::executeAll ()
#15 0x0036904b in darcEventManager::ExecuteEventHandler ()
#16 0x00343ec0 in darcContext::process ()
#17 0x00347339 in darcContext::main ()
#18 0x003cf73d in darcPlayerImpl::renderOneFrame ()
#19 0x003cf078 in darcPlayerImpl::render ()
#20 0x000b1f6f in Run ()
#21 0x000b1fe9 in tiMain ()
#22 0x000c73ee in main ()

(gdb) thread 9
[Switching to thread 9 (core thread 8)]
0x00110171 in std::_Rb_tree<int, std::pair<int const, _iCapture*>, std::_Select1st<std::pair<int const, _iCapture*> >, std::less<int>, std::allocator<std::pair<int const, _iCapture*> > >::find ()

(gdb) bt
#0  0x00110171 in std::_Rb_tree<int, std::pair<int const, _iCapture*>, std::_Select1st<std::pair<int const, _iCapture*> >, std::less<int>, std::allocator<std::pair<int const, _iCapture*> > >::find ()
#1  0x0010f936 in ticVideoManager::isPaused ()
#2  0x00201801 in ticMLT_VideoCapture::Execute ()
#3  0x0020aa0b in ticModuleGraph::runOnce ()
#4  0x002632be in TrackingApp::ProcessTracking ()
#5  0x005b2f5d in ticMLTTracking::processInternal ()
#6  0x005b322d in ticMLTTracking::processThread ()
#7  0x005b36f3 in trackingThread ()
#8  0x004eaf1e in ticThread::threadFunc ()
#9  0x99023557 in _pthread_start ()
#10 0x9900dcee in thread_start ()

Windows equivalent would be a process memory dump which doesn’t have any information saved for !runaway WinDbg command.

- Dmitry Vostokov @ DumpAnalysis.org + TraceAnalysis.org -